Several recent studies in dairy cattle have found a large number of quantitative trait loci (QTL) associated with productive and functional traits that are summarized in three internet databases (http://www.vetsci.usyd.edu.au/reprogen/QTL_Map/; http://www.animalgenome.org/QTLdb/cattle.html; http://bovineqtl.tamu.edu/). Most of these studies were carried out in Holstein-Friesian populations from different countries, using either the daughter (DD) or the granddaughter (GDD) experimental design (Weller et al. Reference Weller, Kashi and Soller1990) and a few hundred microsatellite markers distributed over the genome. To reduce genotyping effort while maintaining the statistical power of QTL identification, a strategy of typing individuals in the tails of the phenotypic distribution (selective genotyping, Darvasi & Soller, Reference Darvasi and Soller1992) has been proposed. The efficiency of such an approach could be further increased by the use of microsatellite multiplexing or by high throughput technologies. Multilocus amplified fragment length polymorphisms (AFLP) technology (Vos et al. Reference Vos, Hogers, Bleeker, Reijans, Van De Lee, Hornes, Fritjers, Pot, Peleman, Kuiper and Zabeau1995) is a cost-effective PCR-based technique for the rapid identification of hundreds of reproducible polymorphisms in any species. AFLP are biallelic dominant markers that allow an efficient screening of a large number of loci per experiment. Although this technology is well established both in plants and in animals, the overwhelming majority of AFLP studies have focused on crop species and only few on livestock (Wimmers et al. Reference Wimmers, Murani, Ponsuksili, Yerle and Schellander2002; Bensch & Åkesson, Reference Bensch2005; Xiao et al. Reference Xiao, Wibowo, Wu, Michal, Reeves, Busboom, Thorgaard and Jiang2007).
The objective of the current study was to evaluate for the first time the combined use of AFLP markers and selective genotyping in a GDD, to identify chromosomal regions candidate to contain QTL for milk protein percentage (P%) in Italian Holstein cattle. The approach was verified by comparison of results with existing QTL information and by microsatellite analysis of four candidate regions.
Materials and Methods
Samples and AFLP genotyping
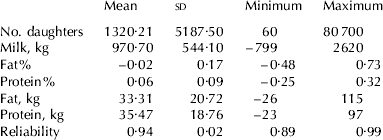
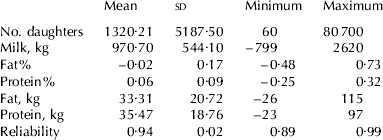
Half-sib families in GDD were selected following a preliminary study on a population of 1170 Italian Holstein progeny tested sires, born between 1985 and 1994, having at least 60 daughters each (Table 1).
Descriptive statistics of 1170 Italian Friesian sires born between 1985 and 1994 and having at least 60 daughters. EBV were calculated with the lactation animal model and refer to the genetic base of females born in 1995
For each family, tails were identified differing by at least 2×population sd of EBVP%. Two of these families, named D and S, having at least 15 half-sib sires per tail and DNA or other biological material available, were selected for molecular analyses.
A total of 64 sires lying in the tails of EBVP% distribution, 31 members of family D (16 extreme low and 15 extreme high) and 33 of family S (16 extreme low and 17 extreme high) and the 2 grandsires were assayed with AFLP markers. AFLP markers were produced according to the protocol described in Ajmone-Marsan et al. (Reference Ajmone-Marsan, Valentini, Cassandro, Vecchiotti-Antaldi, Bertoni and Kuiper1997). A total of 25 primer combinations were assayed on the 64 extreme bulls, AFLP markers were binary scored as dominant markers (1=band present; 0=band absent).
Association between AFLP markers and EBVP%
Analysis of marker-trait association based on individual genotyping was performed for all markers of paternal origin according to the following model:

where y ijk=EBVP% calculated with a lactation BLUP animal model of the sire k of family i; μ=the general mean; fami=fixed effect of family i; bandj=the presence or absence of the marker band j; and eijk=the random residual error. Different significant thresholds were set: P⩽0·05 adjusted to account for multiple comparisons by Bonferroni correction; adjusted false discovery rate (Mosig et al. Reference Mosig, Lipkin, Khutoreskaya, Tchourzyna, Soller and Friedmann2001) of a FDR⩽0·05; and nominal P⩽0·05 not adjusted for multiple comparisons.
Sequencing and chromosomal localization of AFLP bands
AFLP bands associated with EBVP% were excised from the gel and eluted overnight in 50 μl of TE buffer 1× (10 mm-Tris, 1 mm-EDTA). Eluted bands were re-amplified using the corresponding AFLP primer pairs and cloned in pGEM®-T Easy Vector Systems (Promega Corporation, Madison WI, USA). Five clones per marker were run side by side with the original AFLP profile, to confirm the isolation of the target bands. Three clones of the correct size per band were sequenced.
To convert AFLP markers into sequence tagged sites (STS) primer pairs were designed based on band sequences and then were mapped on the TM-112-3000 Rad bovine/hamster radiation hybrids panel (Williams et al. Reference Williams, Eggen, Ferretti, Farr, Gautier, Amati, Ball, Caramorr, Critcher, Costa, Hextall, Hills, Jeulin, Kiguwa, Ross, Smith, Saunier, Urquhart and Waddington2002). AFLP-derived STS were assigned to linkage groups and included in the BovGen_RH 2006 map (Jann et al. Reference Jann, Aerts, Jones, Hastings, Law, McKay, Marques, Prasad, Yu, Moore, Floriot, Mahe, Eggen, Silveri, Negrini, Milanesi, Ajmone-Marsan, Valentini, Marchitelli, Savarese, Janitz, Herwig, Hennig, Gorni, Connor, Sonstegard, Smith, Drogemuller and Williams2006; www.thearkdb.org) using Carthagene software (Schiex et al. Reference Schiex and Gaspin1997; de Givry et al. Reference de Givry, Bouchez, Chabrier, Milan and Schiex2005).
Sequences were also mapped in silico on the assembled 7·1× bovine sequence assembly (Btau_3.1, Baylor College of Medicine; http://www.hgsc.bcm.tmc.edu/projects/bovine/). A custom perl script (www.perl.org) employing BLAST program (Altschul et al. Reference Altschul, Gish, Miller, Myers and Lipman1990) was used to perform an in-silico PCR to determine the position of the markers on the assembled linear Bos taurus (BTA) chromosome scaffolds. Only the fragments below 500 bp in length and amplified with primer pairs showing at least 90% identity with the genome sequence were considered. Chromosome graphics were generated with PostScript language (Adobe System Incorporated, www.adobe.com).
To support the results obtained by AFLP-P% association study, map position of AFLP-derived STS significantly associated to P% was compared with the location of already published QTL. Comparison of AFLP and QTL location was accomplished by ‘QTL map–University of Sidney’ (Khatkar et al. Reference Khatkar, Thomson, Tammen and Raadsma2004; http://www.vetsci.usyd.edu.au/reprogen/QTL_Map/), Cattle QTLdb at Iowa State University (Hu et al. Reference Hu, Fritz and Reecy2007; http://www.animalgenome.org/QTLdb/cattle.html) and ‘Bovine QTL viewer – Texas A&M University’ (Polineni et al. Reference Polineni, Aragonda, Xavier, Furuta and Adelson2006; http://bovineqtl.tamu.edu/) genomic tools available at the NCBI Bovine Genome Resources web site (http://www.ncbi.nlm.nih.gov/genome/guide/cow). Both QTL and AFLP-derived STS were positioned on the MARC 2004 genetic map (http://www.marc.usda.gov/genome/genome.html). The position of the AFLP-derived STS was estimated relative to this genetic map by comparative mapping with the BovGen_RH 2006 map and the sequence assembly.
Selection and production of microsatellite markers
To validate the AFLP-based strategy, we focused on family D performing a microsatellite analysis in four chromosome regions (proximal BTA 10, proximal and distal BTA 18, and proximal BTA 28) in which AFLP-derived STS resulted in significant association with P%.
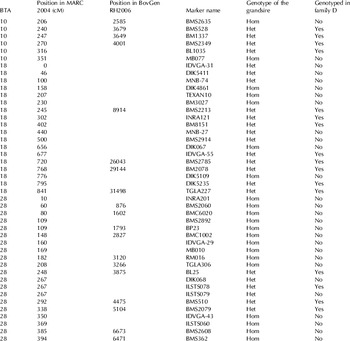
A total of 44 microsatellites mapping in these regions were selected from the USDA MARC 2004 genetic map and from the BovGen_RH 2006 map and assayed on family D grandsire (Table 2). All 122 sires of the D family were then genotyped with the 16 microsatellites heterozygous in the grandsire.
Chromosome, position, marker name, genotype of the grandsire (Hom=homozygous, Het=heterozygous) and genotyping of family D of the microsatellite markers used in association analyses

Microsatellites were resolved on an ABI 377 DNA Sequencer (Applied Biosystems, Foster City CA, USA) and scored by Genescan and Genotyper software (Applied Biosystems). The sequence of the primers, the annealing temperature and the size of the products were retrieved from the USDA map web site (http://www.marc.usda.gov/genome/genome.html).
Microsatellite association testing
Two approaches were used to assess the presence of QTL in the candidate regions by microsatellite markers: (1) single marker association using a one way Analysis of Variance (ANOVA) weighted by trait reliability following the model:

where y ij=the EBVP% of the half-sib i; μ=the general mean; Alli=effect of the allele i; eij=random residual error; and (2) interval mapping based on marker position reported in the MARC 2004 genetic map (Ihara et al. Reference Ihara, Takasuga, Mizoshita, Takeda, Sugimoto, Mizoguchi, Hirano, Itoh, Watanabe, Reed, Snelling, Kappes, Beattie, Bennet and Sugimoto2004; www.thearkdb.org) using QTL-Express software (Seaton et al. Reference Seaton, Haley, Knott, Kearsey and Visscher2002). A 5% threshold was chosen as significance criterion in both analyses. In detail, we used the QTL-Express software setting: half-sib analysis analysis, 1 QTL, 1 cM intervals; significance of association was tested by permutation test (1000 permutations) at chromosome-wide level.
Extending the genotyping from the tails of the distribution to the whole family D allowed us to test the association not only with protein percent (P%) but also with milk, fat and protein yield (MY, FY and PY), fat percentage (F%) and milk somatic cell score (SCS). Marker-trait association was investigated with EBV calculated with the lactation BLUP animal model (L2001), the test-day random regression model with only the first lactation (P2006) and the test-day random regression model with the first three lactations (A2006; Muir et al. Reference Muir, Kistemaker, Jamrozik and Canavesi2007).
Results
Descriptive statistics for milk traits EBV of the population of 1170 sires are shown in Table 2. First and second crop sires were included in this population, as evident from the wide range in the number of daughters. Descriptive statistics (mean, sd, minimum and maximum) for P%, F%, and MY of families D and S selected for molecular analyses are shown in detail in Table 3.
Number of sires analysed (n), mean, sd, minimum (Min) and maximum (Max) of EBV indexes for milk protein percentage (P%), fat percentage (F%), and milk yield (MY) in individuals belonging to the high and low tails for EBVP% subjected to molecular analyses in D and S families

Association between AFLP markers and EBVP%
Statistical analysis considered only 155 AFLP markers of paternal origin. Forty-six of these were polymorphic and paternal in both families, 59 only in family D, and 50 only in family S.
Association tests adjusted for multiple comparisons by Bonferroni correction or by adjusted false discovery rate, detected no marker significantly associated with EBV-P% at P⩽0·05. When no correction was applied, 17 significant markers were detected at P⩽0·05: 8 only in family D, 3 in family D and across families, 5 only in family S, 1 in family S and across families.
Sequencing and chromosomal localization of candidate AFLP markers
A total of 13 out of 17 associated paternal bands were successfully cloned and sequenced. These were mapped in silico on the 7·1× of the bovine genome sequence and on the BovGen_RH 2006 map (Jann et al. Reference Jann, Aerts, Jones, Hastings, Law, McKay, Marques, Prasad, Yu, Moore, Floriot, Mahe, Eggen, Silveri, Negrini, Milanesi, Ajmone-Marsan, Valentini, Marchitelli, Savarese, Janitz, Herwig, Hennig, Gorni, Connor, Sonstegard, Smith, Drogemuller and Williams2006; http://www.thearkdb.org).
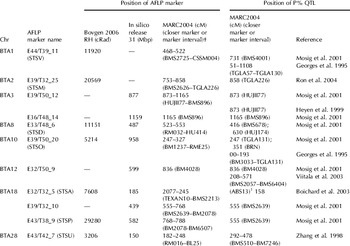
Eleven of the 13 sequences found significant homologies on the bovine genome sequence. Out of these, four mapped on scaffold sequences still to be located on BTA chromosomes. The other nine markers mapped on BTA 3, BTA 8, BTA 10, BTA 12, BTA 18 and BTA 28 (Table 4).
Comparison of AFLP marker location in this study with P% QTL reported in the literature

† marker interval does not refer to QTL position but to the position of ABS13, the marker closest to the QTL
Bovine specific primers giving no cross-amplification in hamster could be designed for 8 AFLP bands. These were successfully amplified as STS in the RH panel and produced a unique and clearly readable profile. Seven out of the 8 STS resulted significantly linked (LOD 4) to BTA 1, BTA 2, BTA 8, BTA 10, BTA 18 and BTA 28 (Table 4; Jann et al. Reference Jann, Aerts, Jones, Hastings, Law, McKay, Marques, Prasad, Yu, Moore, Floriot, Mahe, Eggen, Silveri, Negrini, Milanesi, Ajmone-Marsan, Valentini, Marchitelli, Savarese, Janitz, Herwig, Hennig, Gorni, Connor, Sonstegard, Smith, Drogemuller and Williams2006). Five STS were mapped both in silico and on the RH map. They consistently mapped on the same chromosomes and on the same or nearby marker interval in the two maps.
Comparison with known P% QTL
Comparison between AFLP and P% QTL positions is summarized in Table 4. AFLP probably associated with P% mapped on BTA chromosomes where at least one QTL for P% had already been identified by independent investigations (Georges et al. Reference Georges, Nielsen, Mackinnon, Mishra, Okimoto, Pasquino, Sargeant, Sorensen, Steele, Zhao, Womack and Hoeschele1995; Zhang et al. Reference Zhang, Boichard, Hoeschele, Ernst, Eggen, Murkve, Pfister-Genskow, Witte, Grignola, Uimari, Thaller and Bishop1998; Heyen et al. Reference Heyen, Weller, Ron, Band, Beever, Feldmesser, Da, Wiggans, VanRaden and Lewin1999; Mosig et al. Reference Mosig, Lipkin, Khutoreskaya, Tchourzyna, Soller and Friedmann2001; Boichard et al. Reference Boichard, Grohs, Bourgeois, Cerqueira, Faugeras, Neau, Rupp, Amigues, Boscher and Leveziel2003; Viitala et al. Reference Viitala, Schulman, de Koning, Elo, Kinos, Virta, Virta, Mäki-Tanila and Vilkki2003; Ron et al. Reference Ron, Feldmesser, Golik, Tager-Cohen, Kliger, Reiss, Domochovsky, Alus, Seroussi, Ezra and Weller2004). In six cases (E44/T39_11 on BTA 1; E39/T50_12 and E36/T48_14 on BTA 3; E39/T50_21 on BTA 10; E32/T50_9 on BTA 12; E39/T32_10 on BTA 18) AFLP markers mapped in close proximity of the QTL location (less than 1 cM) or within the same marker interval. In four cases (E39/T32_25 on BTA 2; E33/T48_6 on BTA 8; E32/T32_5 on BTA 18 and E43/T42_7 on BTA 28) AFLP mapped in an adjacent marker interval between 4 and about 10 cM from the QTL location. Only one AFLP (E43/T38_9 on BTA 18), mapped rather distant from any known P% QTL (more than 20 cM).
Microsatellite analysis
Microsatellites were assayed to confirm the presence of significant QTL in BTA 10 and BTA 28 (one region), and BTA 18 (two regions) where AFLP showed significant association with P%. Out of 44 microsatellites tested, 26 were heterozygous in the Grandsire D (4 on BTA 10, 13 on BTA 18 and 9 on BTA 28) and 16 were genotyped in family D (Table 2). In BTA 10 and in the distal region of BTA 18 heterozygous microsatellites were found on both sides of the AFLP markers, but in the proximal region of BTA 18 and in BTA 28 heterozygous microsatellites were found only distal to the AFLP markers. At the 16 loci assayed, the number of informative genotypes spanned from 52 (IDVGA55 on BTA 18) to 107 (BMS2079 on BTA 28). The number of informative individuals for interval mapping was 102 in BTA 28, 118 in BTA 18 and 121 in BTA 10.
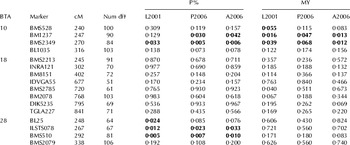
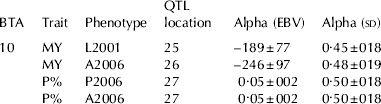
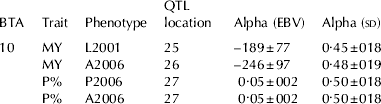
On BTA 10 single marker analysis found significant association between EBVP% and markers BM1237 and BMS2349 (Table 5). The same two markers were significantly associated with MY. Interval mapping confirmed the association between the chromosomal region, P% and MY at a chromosome-wide 5% significance threshold. Allele substitution effects for MY and P% are reported in Table 6 in sd units of EBV for the different phenotypes used in the analysis. Values in sd units are calculated by dividing the allelic substitution effects (alpha values) by the within family sd, to make them comparable across different scales of genetic evaluations (phenotypes).
P values for milk protein percent (P%) and milk yield (MY) according to EBV calculated with a lactation model (L2001), with a test day model only with first lactation (P2006) and with a test day model with all three lactation (A2006)

† Numerator degrees of freedom
On BTA 18, P values of single marker analysis (Table 5) and interval mapping analysis suggested the presence of a QTL nearby the positions identified by AFLP markers. However, no marker reached the significant threshold. Accordingly, interval mapping analysis found no significant effects in the two regions investigated in this chromosome, except for F%-A2006 at marker BM2078 when the two regions in the chromosome were analysed separately.
On BTA 28, single marker analysis indicated association between EBVP% and markers BL025, ILSTS078 and BMS510 (Table 5). Interval mapping analysis did not confirm the presence of the QTL for P% at the chromosome-wide level.
MSCS-EBV was associated only in single marker analysis (one way ANOVA weighted by trait reliability) at one marker (DIK5235, cM 79·5) on BTA 18 as found by Ashwell et al. (Reference Ashwell, Rexroad, Miller, Vanraden and Da1997), Schrooten et al. (Reference Schrooten, Bovenhuis, Coppieters and van Arendonk2000) and Rodriguez-Zas et al. (Reference Rodriguez-Zas, Southey, Heyen and Lewin2002).
Discussion
With present technology, whole genome sequencing and large scale marker development is unlikely to be carried out in a number of species of minor economic importance and in wild species. In these cases AFLP markers may be an option to investigate the genome and to map genes and complex traits of interest, because–even if dominant and biallelic–AFLP can be easily and economically applied to any species with no need for sequence information or availability of other markers. However, to date only few attempts have been made to use and verify this marker technology for mapping QTL in animals (Sharma et al. Reference Sharma, Jansen, Karrow, Kelton and Jiang2006). In the present investigation we applied a method to identify QTL-associated candidate AFLP, to be ex-post validated by classical microsatellite analysis and comparison with known QTL location.
To test the strategy, we targeted Holstein-Friesian cattle, in which a large number of investigations reported the existence of QTL for milk traits (Khatkar et al. Reference Khatkar, Thomson, Tammen and Raadsma2004), and a subset of animals in GDD having precise estimates of breeding values for P% due to the high heritability of the trait. The strategy used was: (1) select tails of EBVP% in GDD families; (2) identify AFLP associated with the target trait; (3) clone, sequence, and map associated AFLP; (4) confirm AFLP-trait association by microsatellite analysis and comparison with known QTL location.
Association between AFLP markers and EBVP%
AFLP technology was also assessed for its ability to identify markers associated with EBVP%. Candidate AFLP were identified through a linear model, testing each marker for the effect of band presence or absence. This model assumes that AFLP alleles associated to a QTL do not evenly distribute among sires lying in the tails of the EBV distribution for the target trait. The contribution in allele frequency from the mothers is unknown and considered randomly distributed between EBV tails. With the AFLP approach, a large number of loci were rapidly screened. Twenty-five primer pairs amplified approximately 2000 loci out of which 347 were polymorphic in one or both GDD families investigated. Association was tested on 105 segregating paternal bands in family D and 96 in family S. Not accounting for a multiple comparisons, a proportion of markers larger than expected was significant at a 5% threshold in family D (11 observed v. 5·2 expected by chance). Hence in family D, some of the genomic regions detected by AFLP markers might really contain QTL affecting P% and deserved independent confirmation. To accomplish this task the first necessary step was the localization of AFLP on the cattle genome in silico and by RH mapping.
AFLP mapping and comparison with known P% QTL
AFLP bands were isolated from gels and sequenced. The combined in-silico and RH mapping approaches permitted the localization of 11 AFLP on 8 chromosomes. In 5 cases the same marker was mapped with both approaches on the same chromosome and the same or nearby marker interval.
Interestingly all 11 AFLP markers that could be located on either the RH or the sequence release, mapped in the region of QTL identified in the Israeli Holstein (Mosig et al. Reference Mosig, Lipkin, Khutoreskaya, Tchourzyna, Soller and Friedmann2001; Ron et al. Reference Ron, Feldmesser, Golik, Tager-Cohen, Kliger, Reiss, Domochovsky, Alus, Seroussi, Ezra and Weller2004), French Holstein-Friesian (Boichard et al. Reference Boichard, Grohs, Bourgeois, Cerqueira, Faugeras, Neau, Rupp, Amigues, Boscher and Leveziel2003) and North American Holstein-Friesian populations (Georges et al. Reference Georges, Nielsen, Mackinnon, Mishra, Okimoto, Pasquino, Sargeant, Sorensen, Steele, Zhao, Womack and Hoeschele1995; Zhang et al. Reference Zhang, Boichard, Hoeschele, Ernst, Eggen, Murkve, Pfister-Genskow, Witte, Grignola, Uimari, Thaller and Bishop1998; Heyen et al. Reference Heyen, Weller, Ron, Band, Beever, Feldmesser, Da, Wiggans, VanRaden and Lewin1999). With an exception on BTA 18, AFLP mapped within 10 cM from the P% QTL published locations, with some AFLP mapping in close proximity (less than 1 cM) of the QTL peaks. Considering that the QTL position has rather long confidence intervals, our data are in good agreement with the results described in the literature.
Confirmation of region-QTL association by microsatellite analysis
In this study the association analysis with microsatellite markers had the goal to confirm the presence of QTL affecting P% identified with AFLP markers on three chromosomes in one family, genotyping individuals in a region flanking the AFLP markers identified to be in association with QTL. Analysis of microsatellite data was run considering single marker, interval mapping and EBV estimated by BLUP animal model and by two different test-day models.
Association with EBVP% suggested by AFLP analysis was confirmed by single marker analysis in two regions on BTA 10 and BTA 28, out of the four investigated. In both cases all EBVP% were significantly associated with at least one of the microsatellite markers assayed. Interval mapping analysis (average information content 0·80) confirmed the presence of the QTL for P% at the chromosome-wide level only in BTA 10 and not in BTA 28.
In BTA 10 significant association was also found with MY, by single marker and interval mapping (Tables 5 and 6). In sd units, allele substitution effect was very similar for MY and P%, and were in reverse phase, as expected by the negative genetic correlation between the traits. Indeed, in Italian Holstein-Friesian the genetic correlation between P% and MY is very high (<−0·80; Samoré et al. Reference Samoré, Boettcher, Jamrozik, Bagnato and Groen2002), increasing the probability that the same genomic region carries genes influencing both traits, as reported in the three public QTL map databases on the websites mentioned above.
Allele substitution effect estimated by interval mapping for milk protein percent (P%) and milk yield (MY) at the QTL identified on BTA 10
On BTA 18, neither of the two regions in which suggestive AFLP were found was confirmed by microsatellite analysis. A peak was observed in the correspondence of IDVGA55 (Table 5) but it did not reach the significance threshold, possibly because of the low number of informative genotypes at this locus (52). Accordingly, interval mapping is only suggestive of the presence of QTL on this chromosome and for traits other than P%. The variance ratio values peak in the interval between cM 28 and 46 for MY, PY and FY-EBV and between cM 70 and 84 for MY, F%, PY and SCS-EBV (results not shown) never reaching the significance threshold.
Considering the low stringency significance threshold used, AFLP data alone can only be suggestive of the presence of P% QTL. However, confirmation from microsatellites and compatible data from independent investigations reinforce one other, and provide strong circumstantial evidence of the presence of significant P% effects in at least two of the chromosomal locations identified in BTA 10 and BTA 28. Hence, some of the same P% QTL identified in Israeli, French and American Friesian populations are segregating in the Italian Friesian population.
In summary, although assayed in rather optimal conditions–i.e., to search QTL for a moderately high heritability trait (P%) in Holstein Friesian GDD families having high reliability of EBV–our results indicate that firstly, AFLP markers may be used to seek QTL exploiting a selective genotyping approach; and provide new information on QTLs for an economic important trait in a never before investigated Holstein cattle population. Furthermore we test for the first time the approach in a GDD design widely used for searching QTL in dairy cattle and propose two approaches for AFLP mapping, namely, in-silico mapping exploiting most updated release from the bovine whole genome sequencing project, and physical mapping exploiting a panel of Bovine/Hamster Radiation Hybrids. The method can be particularly useful in minor livestock species, sometimes having large economic impact in marginal areas or carrying some interesting adaptative traits, where more informative markers are poorly developed. The effectiveness of the strategy in more challenging conditions (e.g., in traits showing lower heritability or in animals having lower reliability of the EBV) remains to be tested.
This work was funded by MURST97. The authors thank Dr Stefano Sangalli and Laboratorio Genetica e Servizi for provision of DNA samples.