


Introduction
A well-known consequence of gas transport within the interconnected pores of polar firn is the difference in age (Δage) between trapped air and the surrounding ice. the gas transport results in a wide spread of air ages within pores of a distinct horizon, while the surrounding ice is approximately of uniform age (Schwander and Stauffer, 1984; Trudinger and others, 1997). A reliable estimation of Δage, especially on the longer time-scale of glacial and interglacial cycles, is of great importance in examining their relation to climate proxies deduced from the ice itself (e.g. isotopic temperatures or aerosol concentrations). A great deal of effort has been devoted to deduce Δage estimates using macroscopic firnification models (Schwander and others, 1997; Kawamura, 2000). However, it is not evident that the assumed empirical densification model and the transport properties of recent firn are applicable to different climate conditions during glacial times. No reliable error bars of Δage estimates could be specified due to lack of knowledge about structure-related firn properties and their dependence on temperature, accumulation rate and impurity content.
The gas transport in firn is mainly controlled by molecular diffusion. the diffusion is forced by the concentration gradient that is triggered by concentration changes in the atmosphere. the diffusion takes place through the cramped and tortuous pores of firn. the firn structure effectively lowers the diffusion in comparison to that in free air. Advective transport by airflow due to windpumping or convection plays only a minor role within the firn column, because under recent climate conditions both the permeability of firn and the driving forces are too small to ventilate more than the uppermost metres, which make up approximately 10–20% of the firn column height. Therefore the effective diffusion coefficient and its relation to firn structure are of primary interest. Previously measured diffusivity–porosity relationships (Schwander and others, 1988; Fabre and others, 2000) show only slight variations for firn sintered at different temperatures. However, the regressions are based on data measured in a small range 0.15–0.37 of open porosity (Fabre and others, 2000) and give rise to unreasonable values in both limits. Above 0.6, the tortuosities of the firn pores tend to values 51 (lower than for free space and without physical meaning). Below 0.12, the diffusion vanished totally, although even below this limit connected pores exist. on the other hand, firn with low open porosity is of particular importance because the reduced diffusion in the vicinity of the firn–ice transition significantly affects the Δage of the isolated air. Furthermore, the influence of differences in firn structure on diffusion increases with decreasing porosity. This is evident when, for example, the tortuosity of a bed of spheres is compared with that of a sintered material. In the porosity range 0.5–1 the tortuosities vary only by a maximum factor of 2, whereas in the lower part of porosity the differences of the tortuosities tend to a factor of 50 and more. Therefore the diffusivity–porosity relationships for firn sintered at different temperatures might be different for low porosities.
In other studies, inverse modeling techniques (Rommelaere and others, 1997; Fabre and others, 2000) and trial-and-errormethods (Trudinger and others, 1997) are applied to the diffusion process using measured atmospheric and firn air compositions to tune the diffusion–porosity relationships at several locations. These studies resulted in markedly different curves at different locations. Interpreting these differences is difficult because all model errors (e.g. uncertainties in the density parameterization due to ignoring density fluctuations or melt layers) are ``mapped’’ into the reconstructed diffusivity values. So far, the relationship between effective diffusion coefficients and open porosity over the whole range of open porosity remains unclear even for recent firn.
Consider firn in glacial times. Measurements of δ15N2 reflect the gravitational separation of isotopes dependent on the diffusion column height (DCH). Measurements of δ15N2 in the deep ice core from Dome Fuji, Antarctica, indicate unexpected changes of the DCH during the glacial cycles. the DCH decreases during glacial times, whereas the close-off depth increases (Kawamura, 2000). If the estimated DCH is correct, the influence of the colder glacial climate on firn structure, diffusivity–porosity relationship and on the whole process of densification would lead to lower DCHs and hence would require new explanations. Sowers and others (1992) postulate non-diffusive zones above the firn– ice transition. Furthermore, the occurrence of thin impermeable zones in the upper firn column (e.g. melting layers) could lead to a significant lowering of diffusion (Trudinger and others, 1997). Until now, the formation of such non-diffusive zones and the condition that controls their thickness have not been understood. All the aspects mentioned above reveal a lack of knowledge about firn structure for present, and even more for glacial, climate conditions.
The overall aim of this contribution is to provide a method to investigate specific features of firn structures on the pore-space scale that allows the estimation of relevant parameters for gas transport, such as permeability and effective diffusion coefficients. In the following, the method will be presented in detail and applied, in a pilot study, to firn samples from an ice core drilled in North Greenland. the deduced permeability–porosity and diffusivity–porosity relationships are discussed in the context of previous, experimentally derived estimates. Further applications of this method with respect to gas transport in the firn column will be presented elsewhere.
Three-Dimensional Reconstruction Method (3DRM)
The reconstruction of pore space in firn is based on a serial sectioning method. the experimental set-up is placed in a cold room at temperatures of about –208C. Samples are successively cut by shaving off thin horizontal ice slices with a microtome. Subsequently, the planar surfaces are photographed using a charge coupled device (CCD) camera (Hamamatsu C3077). the camera is mounted on top of the stage, with light sources on both sides. During processing, the distance between camera and ice surfaces remains constant. the images are taken when the sledge has reached the final position of the microtome track. Before each cut, the pore spaces are filled with a white-coloured mixture of titanium dioxide powder in oil to enhance the contrast between ice and pore space. the dimensions of an ice specimen are approximately 30 mm×40mm×40mm. the lateral resolution of the digital surface images is 0.074 mm per pixel. the distance of two sequentially photographed surface sections is set to 0.200 mm. However, a single microtome cut reduces the ice thickness by 0.040 mm or less. In the last cut, between pore filling and imaging, only 0.01mm ice is microtomed off. A set of approximately 200 images is combined to a three-dimensional ice–pore matrix by using well-known tools of digital image processing (Gonzalez and Wintz, 1987; Russ, 1995). the digital images consist of 7686512 pixels. the brightness is digitized to 256 levels of grey values.
In the first step, the relative position of serial surfaces is tested. Already, slight displacements during the imaging process would significantly change the connectivity of the three-dimensional structure. to correct the displacements, the two-dimensional cross-correlation functions between adjacent digital images are calculated. the position of the local maximum of each correlation function indicates the necessary displacement in the x and y directions (Gonzalez and Wintz, 1987). the images are successively correlated and relocated using windows of 2566256 pixels in the centre of the images.
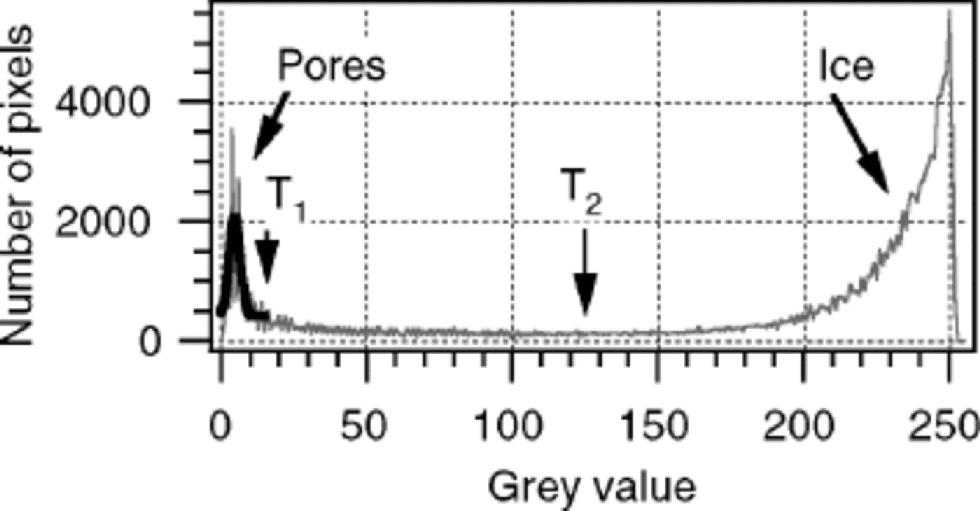
In the second step, the grey-level images are analyzed with a segmentation algorithm using two thresholds to obtain binary representations of solid ice and pore regions. the segmentation is a common process in digital imaging to subdivide an image into its constituent regions (Gonzalez and Wintz, 1987). Thresholding is one of the most important approaches to image segmentation. In the case of objects with grey levels grouped into two clearly distinguished modes, the selection of one threshold is sufficient to separate these modes. Surface images of firn show this bimodal distribution function in grey levels (Fig. 1). the maximum grey value, maxpore, in the lower part of the histogram corresponds to pixels predominantly representing pores; the maximum, maxice, in the upper part corresponds to pixels representing ice. However, a separation by only one threshold between the two maxima would overestimate the pore region because the grey levels of marked regions beneath the surface overlap with a wide area of pore-representing values. Therefore a set of two thresholds is defined. the first threshold, T1 is defined as T1 = maxpore+ 2σ, where the standard deviation σ is derived by fitting a Gaussian function onto the lower part of grey levels (Fig. 1). T1 usually varies between 5 and 50, and separates only the narrow region of grey levels assumed to be explicit pore-representing pixels. In addition, a fraction of mixed pixels at the ice–pore interface has to be added to the pore-representing pixels. A mixed pixel represents an area covered by both ice and pores, with a mean grey value that is weighted by their fraction of coverage. Due to the small-scale structures, the images consist of a large number of mixed pixels. to separate pore-representing mixed pixels, a second threshold T2 is defined as a mean grey value of the two maxima given by T2 = (maxpore + maxice)/2. T2 varies between 100 and 128. A mixed pixel is classified as a pore if its grey value gv<T2 and if at least one adjacent pixel represents a pore with a grey value gv < T1 (to ensure that the considered pixel is at the ice–pore interface). All residual pixels are assigned to the ice phase.
Bimodal grey-value histogram of a surface image (grey curve) including a Gaussian fit of the pore region (black curve) and the estimates of both thresholds T1 and T2 that are used for segmentation.
The total porosity n of the reconstructed firn cube is simply given by the ratio of pore-representing pixels to the sum of ice- and pore-representing pixels. Pores connected via the pore phase to two opposite sides of the firn cube are defined as open pores. the open porosity nop is then given by the ratio of open-pore-representing pixels to the whole number of ice- and pore-representing pixels. In the models described below, the open pores are estimated with respect to the cube sites in the direction of the imposed pressure and concentration gradients.
Models of Gas Transport
Two independent models for advective and diffusive transport are developed. Both are based on the lattice Boltzmann formulation. In recent years, lattice Boltzmann models (LBMs) have been applied to various problems described by partial differential equations, for example to hydrodynamics in three dimensions, flow through porous media, immiscible fluids and diffusion-reaction problems (Wolf-Gladrow, 2000). the LBMs are ``bottom-up’’ approaches, where the starting point is a discrete microscopic grid model which by construction conserves the desired quantities. However, the derivation of the corresponding macroscopic equations requires lengthy calculation by multi-scale analysis and goes beyond the scope of this paper. the next subsection outlines the specific model constructions, focusing on the handling of the boundary conditions. for more detailed derivations of LBMs see Wolf-Gladrow (2000).
The advection model
The advection model solves the Navier–Stokes equations for an incompressible fluid with Reynolds numbers 51 to simulate laminar flow through the reconstructed pore space. In the following we use advection to mean fluid movement within the pores of firn, whereas others use it to describe the downward movement of air with the surrounding firn layers, due to snow accumulation at the surface. This is not addressed in this paper. from the flow-field simulation on the pore scale, the structure-related permeability k of porous firn is calculated. k (m2) is defined in Darcy’s law

with specific discharge  pressure gradient along the main flow direction
 and fluid viscosity μ (kgm–1 s –1).
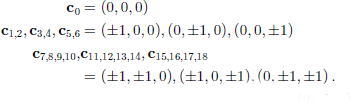
For the advection model, a cubic lattice with 19 velocities on each gridpoint, in combination with the Bhatnagar and others (1954; BGK) collision term, is used. the BGK collision term was originally introduced by d’Humières and others (1986) for hydrodynamic simulations. the normalized velocities of this lattice allow a mass and momentum exchange to the next 18 neighboured nodes. In Cartesian coordinates they read
The local equilibrium distributions  of the mass density on the grid can be written as
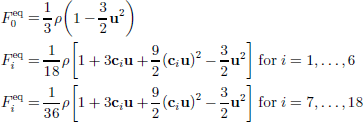
with density ρ and velocity u. the kinetic equation describing the time development of the distribution functions (Qian and others, 1992) reads:

where i is the index for the lattice velocities and ω is the collision frequency. the mass and momentum densities ρ(x, t) and  at the gridpoint x are defined as mean values of Fi(x, u; t) over velocity space:
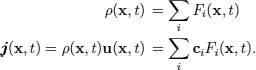
It can be shown that ρ(x, t) and obey the Navier– Stokes equation whereby the kinematic shear viscosity ν depends on ω. for proper choice of ω in the range 0–2 the viscosity can be adjusted to the viscosity of any desired fluid:

The pressure p(x, t) is defined up to an arbitrary additive constant p0 and given by the density field as:

The non-equilibrium distribution functions Fi have to be calculated at each new time-step t + 1. the Fi propagate from the gridpoint (x– ci) to the point (x). for the grid-points on the boundaries, not all Fi are known, because some points from which propagation starts are outside the domain and some Fi are propagating out of the domain. Boundary conditions that can be used in this work must conserve mass and fulfil the no-slip conditions between the fluid (gas phase) and the solid phase. Therefore the halfway bounce-back scheme (HBS; see He and others, 1997) is applied: for two neighbouring nodes−one ``wet’’ node (gas phase) and one ``dry’’ node (solid phase) −the boundary is located halfway between the two nodes. Particle distributions propagate from wet to dry nodes and vice versa. on the dry nodes, no collision or forcing takes place. If a distribution propagates from a wet node to a dry node, the distribution-oriented reverse direction of the dry node is set equal to that ``wet’’ distribution. Thus the original distribution is bounced back from the dry node to the original wet node in the next time-step. Which distributions are reflected depends on the relative position of wet and dry nodes. Complete changing of all contrary-oriented distributions fulfils the HBS for all positions. Along the open boundaries at x = (x, y, 0) and x = (x, y, zmax) the gradient of the velocities in the direction of the main flow (z direction) must vanish. This requires that Fi(x, y, 0) propagates to Fi(x, y, 1) for i = 5,11,12,15,17, and Fi(x,y,zmax) propagates to Fi(x, y, zmax – 1) for i = 6,13,14,16,18. the forcing of the LBM is implemented by an imposed pressure difference between the model boundaries in the direction of the main flow at  In the notation of the LBM, it is equivalent to a density difference (Equation (7)). the density difference is distributed symmetrically on both boundaries so that the arithmetic average is equal to the density ρ0 of the internal nodes at the time t = 0. the model always starts with
 and
 0) = 1. the imposed pressure difference is kept constant during all model iterations.
The model calculates the local pressure (density) and velocity vectors. Using Equation (1), the macroscopic permeability of the firn cube is calculated by

where ΔL is the distance between two vertically oriented cross-sections with pressure difference Δp, A is the total surface cross-section area, ud is the specific discharge in the z direction and can be expressed as the sum of the local velocities in the z direction, qz is an arbitrary cross-section divided by A, and m is the index for the ``wet’’ nodes in the cross-section CS.
The diffusion model
The diffusion model solves the diffusion equation within the complex pore structure, excluding all kinds of adsorption processes. It simulates diffusion paths and enables us to calculate the effective diffusion coefficient Deff of firn. Deff , the effective diffusion coefficient for a porous medium (m2 s–1), is defined in Fick’s law:

where  mol m–2 s –1) is the flux and rC (mol m–4) is the concentration gradient. the relation between Deff and the constant diffusion coefficient D (m2 s–1) of a specific gas in free air is given by

where nop is open porosity and τ is tortuosity of the porous structure. the dependency of D on temperature and pressure is not included.
For the diffusion model, a cubic lattice with six lattice velocities on each gridpoint is sufficient (Toffoli and Margulos (1990) in Wolf-Gladrow, 1995). the lattice velocities read c0, c2;3, c4;5
 The kinetic equation with the BKG collision term looks like the one in the advection model. Here, the concentration
 is given as the sum over the distribution functions

The local equilibrium distributions  can be written as

C(x,t) obeys the diffusion equation (Wolf-Gladrow, 1995) where the free-air diffusion coefficient D depends on ω as

The boundary conditions are expressed by the HBS as in the advection model.The scheme conserves the mass within the gas phase. No absorption takes place at the pore–ice surfaces. to prevent diffusion to the outside, the cube surfaces are sealed with a solid gridpoint layer.
The forcing is implemented by an imposed concentration difference between two opposite model boundaries at  The values at the boundaries are kept constant during the model iterations. the model starts with a linear concentration profile that is the solution in case of free diffusion.
The effective diffusion coefficient Deff of the firn cube results from the calculated total fluxes in the direction of the imposed concentration gradient ΔC/ΔL using Equation (9):

whereby the total concentration flux in the z direction is the sum over the local fluxes (jz)m in an arbitrary vertical cross-section.The local flux in the z direction at node xm is given by the mean value of the local propagated distribution functions  m is the index for the ``wet’’ nodes in the cross-section CS.
Methodological Aspects
The three-dimensional reconstruction of firn encompasses several potential sources of errors. Foremost, errors could occur during sample preparation when pores only partially fill or the marker is smeared over the ice after microtoming. to avoid inaccurate preparations, several ice surfaces marked by different mixtures were analyzed under a microscope. It turned out that a mixture of titanium dioxide in oil with a weight ratio of 3–4 is most suitable for reducing inaccuracies. In comparison with the favoured resolution of 0.1 mm, the error is negligible. During imaging, a uniform and sufficient illumination without over- or underexposures prevents additional errors. However, the segmentation algorithm has difficulty distinguishing between marked pores at the ice surface and beneath it when the marked pores underneath the ice have horizontally oriented pore–ice interfaces. for this reason, the segmentation tends to overestimate pore regions. Furthermore, the finite vertical and lateral resolution causes errors. the thickness of the microtome cut directly after pore-filling and before imaging defines the lower limit of pore detection. All pore cuts with a vertical dimension of 0.01 mm or less are ignored and lead to an underestimation of pore regions. the limitation of the lateral resolution to 0.1 mm implies a relatively high number of mixed pixels. Assuming circular pores 1 mm in diameter, approximately 20% of the pore-representing pixels are mixed pixels. to handle this, the second threshold was introduced in the segmentation algorithm. So long as mixed pixels are independently recorded, no systematic deviations in the calculated pore and ice fractions are expected.
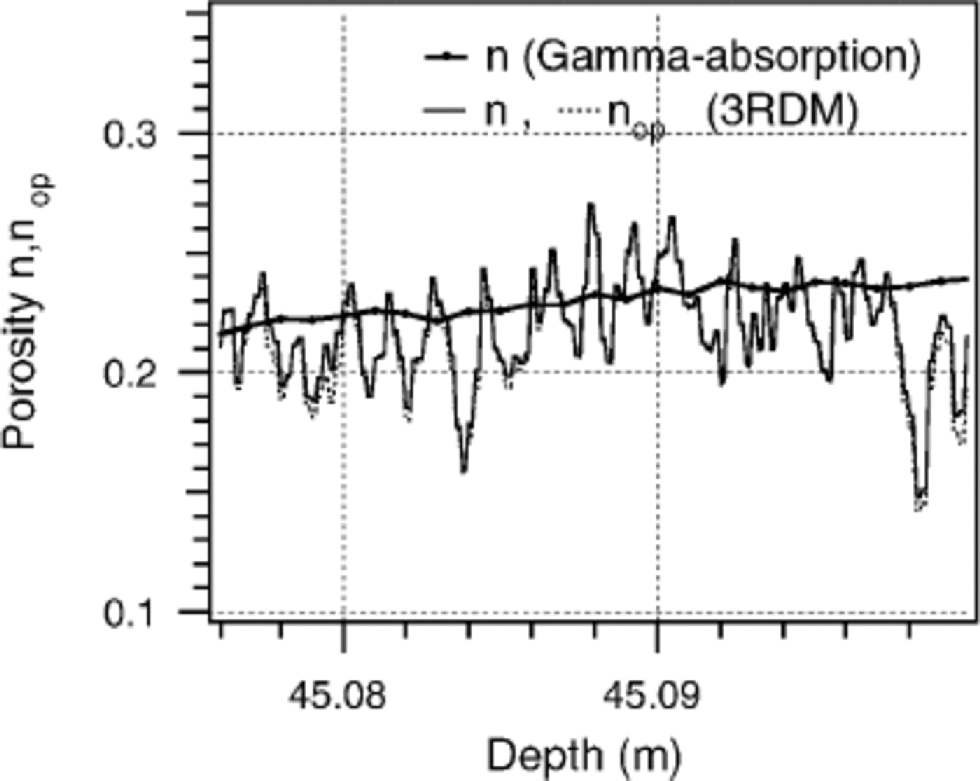
To validate the 3 DRM, the total porosity is measured independently by gamma absorption (Wilhelms, 1996). Figure 2 displays the porosity of a firn core, 98 mm in diameter, measured by gamma absorption with a resolution of 1mm. In comparison, the porosity of the same firn horizon is measured by the 3DRM with a vertical resolution of 0.2 mm on a cube segment of 24mm length. the mean values of both porosity curves are in good agreement. the porosity measured by 3DRM has better resolution and shows more variations with depth. the porosity measured by gamma absorption is always used as a control parameter for the 3DRM.
Porosity profiles estimates from the 3DRM and by gamma absorption for an arbitrary depth interval.
The model algorithms are tested on simplified geometries with well-known analytical solutions. for the verification of the advection model we simulated Hagen–Poiseuille flow in a short cylindrical pipe with radius 2.45mm, length 10.2mm and a pixel resolution of 0.1mm. the flow is forced with a pressure difference of 0.005 mbar. This results in a Reynolds number of approximately Re =0.4 if water is used as the model fluid. the small Reynolds number ensures laminar flow and stable solutions. Convergent behaviour of the absolute value of momentum in the model system indicates convergence towards a stable solution during the iteration process. for this specific geometry, the stable stage was reached after only 4000 iterations. the deviations between the modeled and analytical solution for the radial velocity field and the pressure gradients are in the range of 1%. Up to 2% is obtained for the calculated permeability. the diffusion model is validated with the diffusion in free air. This leads to deviations of <1% between modeled concentration profiles and analytical solutions.
Further, the effect of a reduced number of gridpoints in presenting flat channel geometries is investigated. In a series of simulations, the channel height is continuously reduced from 10 to 2 gridpoints. Width and length are fixed to 180 and 100 gridpoints, respectively. the model results are compared with the analytical solution of two-dimensional channel flow. A channel with a height of only two gridpoints leads to reduced simulated permeability of 80% of the analytical solution and only slightly reduced diffusion of 99%. for channels represented by as few as five or more grid-points, the simulated and analytical solutions yield the same value. the low gridpoint resolution allows the application of our models to complex pore structures without the need of a large number of gridpoints. the resolution of the 3DRM is set to the upper limit of 0.1mm, and results in a representation of typical pore sizes in real firn structures by five or more gridpoints. Additionally, when the models are applied to polar firn, the ice-specimen size necessary to provide characteristic values for diffusivity and permeability has to be determined. for that, the hydraulic properties are modelled for a firn cube as a whole, and for several subsections of different length. Figure 3 displays the different diffusion profiles for single subsections, and the composition of all subsections to the whole cube. the effective diffusion coefficients of the composites are derived using
Diffusion profiles of the same firn cube divided into different subsection lengths. the dashed lines represent the calculated diffusivity of their composites in serial order.

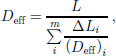
with a total cube length L composed by m layers of height ΔLi and effective diffusion coefficient (Deff)i. the composites of sections with length <6mm overestimate the hydraulic properties since the tortuosity of firn is not completely developed on this scale. Only when the cube length exceeds 12 mm do the composites result in the same total diffusivity as the simulated composite of the whole cube. Therefore, all model runs are done on firn cubes with a length of at least 12 mm. Using a Sun workstation Ultra 10, approximately 10 hours of central processing unit time is needed for one simulation.
Application to Greenland Firn
Reconstruction and model simulations were performed on Greenland firn samples from an ice core (B27) drilled at 76839’N, 46829’ Win 1995. Twelve samples were selected from 57,45 and 16 m depth. on each horizon, a group of four serial cubes were analyzed which cover a depth interval of 19 cm. Assuming an accumulation rate of 18 cm w.e. a–1 and mean porosities of 0.16, 0.21 and 0.45, the reconstructed intervals represent 60–90% of an annual layer.
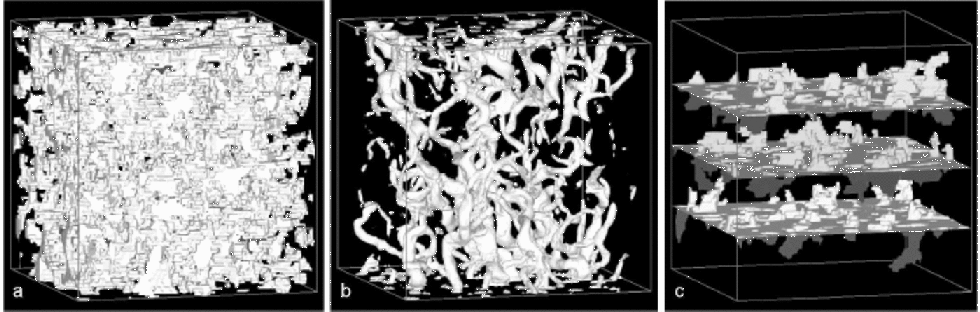
Figure 4a shows a typical 3DRM of firn with a cube length of 12mm. Imposing a constant pressure difference, the simulation of the advection model yields a flow field that is plotted in Figure 4b. the flow concentrates on dominant paths that are uniformly distributed over the whole cube. An impression of diffusion through the pores, forced by a constant concentration difference at opposite sites, gives Figure 4c. Already the visualized uniform permeation and diffusion suggest a high degree of isotropy on the pore scale. Model runs are performed in all three dimensions on the same firn cubes. Direct comparison of lateral and vertical components reveals near-isotropy in diffusivity as well as in permeability, with slightly reduced lateral components. the ratio between laterally and vertically oriented permeability is 0.3–1.3; the ratio for the effective diffusion coefficients is 0.6–1.2.
(a) Example of a reconstructed firn cube (12 mm 612 mm 612 mm) from 45 m depth with n =0.22, pore space in white. (b) Simulated flow field forced by a vertical pressure gradient; in white the contour of the velocity isosurface with v > (0.1vmax) which indicates the dominant flow paths. (c) Simulated concentration field forced by a vertical concentration gradient. Three isosurfaces of different concentration are plotted.
In Figure 5, the dependence of the transport properties (k, Deff)/D) on open porosity nop is plotted. nop varies between 0.05 and 0.45. Both the Deff/D vs nop and k vs nop relations are described by power-law functions with different exponents:

Independent estimates of the Deff/D vs nop relation were made by Schwander and others (1988, regression 2) and Fabre and others (2000, regression 4). They determined effective diffusion coefficients in analyzing the shape of an elution peak of a given gas pushed through the firn sample by a carrier gas. Fabre and others (2000) pointed out that for nop <0.15 the experimental technique was no longer valid. for nop >0.15 the model data fit fairly well in the range of their calculated regression curves. Below nop = 0.15 the trends diverge. the diffusion disappears at nop = 0.12 when using the regression curves of Schwander and others (1988) and Fabre and others (2000). Although Fabre and others (2000) explicitly refer to open porosity (and not total porosity!), it is not reasonable to assume that any gas transport stops for nop <0.12, although connected pores exist. Therefore, the derived power-law function with exponent 2.1 seems to be a more realistic description of the Deff/D vs nop relation in polar firn.
Modelled Deff/D vs nop and k vs nop relations in comparison to measured estimates.
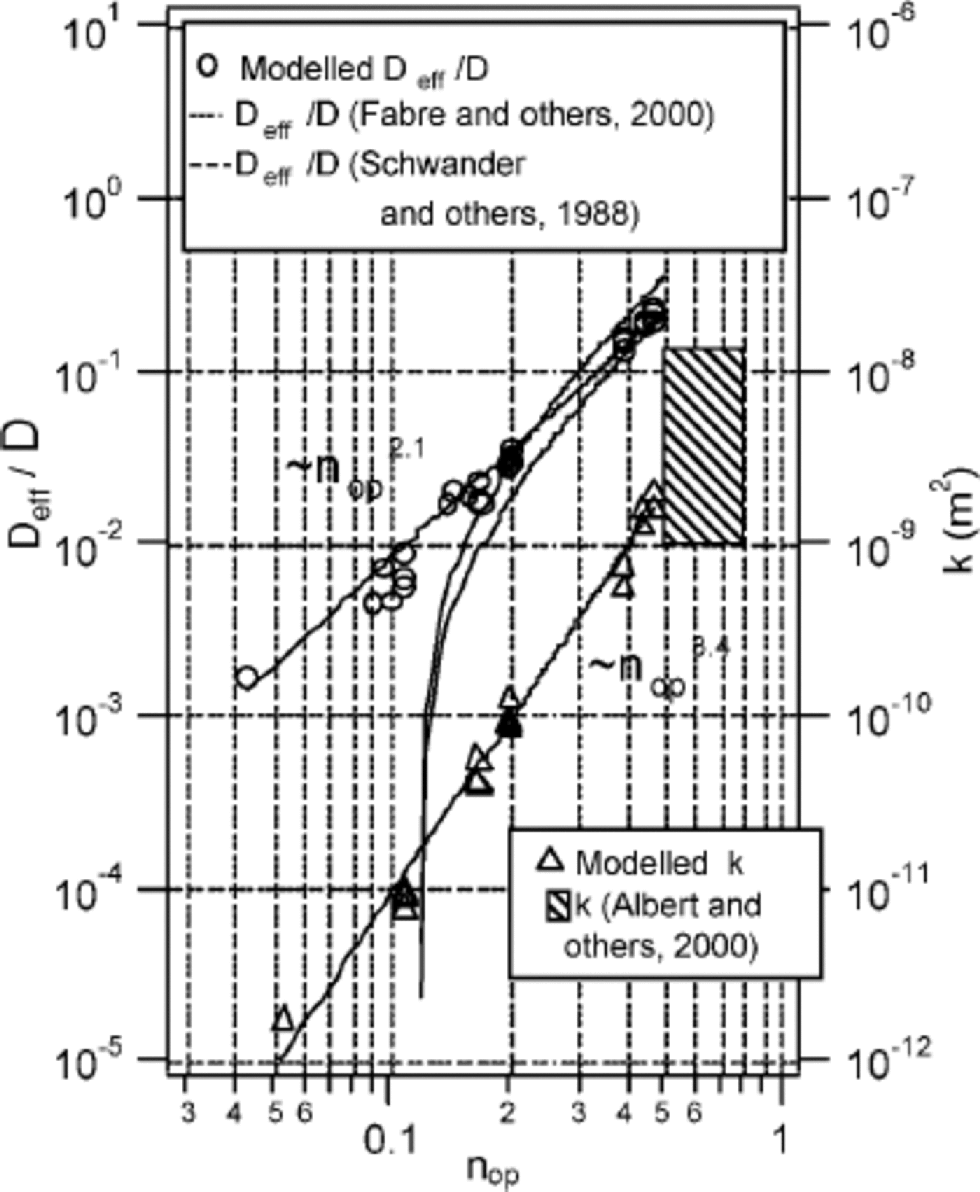
The estimated k vs nop relation for polar firn follows a power-law function with exponent 3.4 that is much higher than for diffusion. It results in a higher sensitivity of advection against slight variations in open porosity. Both relationships illustrate the specific change of transport properties during densification of polar firn by the sintering process. Other sintered materials show comparable k vs nop relations like sandstone with exponent 3 (Doyen,1988) or hot pressed calcite aggregates with exponent 3.8 (Zhang and others, 1994). Permeability measurements of the top metre of polar firn performed by Albert and others (2000) validate the absolute values of model data for high porosities. the estimated k vs nop relation shows only slight data spreading. A reason could be that the simulations are carried out on samples of smallest possible size where variations of porosity are minimized.
It should be pointed out that in order to apply both the Deff/D vs nop and k vs nop relation to polar firn, a profile of open porosity is required. In the context of the whole firn column, only pores with contact to the atmosphere are open pores. A scale of tens of metres is involved in estimating open porosity within the firn column, bearing in mind that seasonal density fluctuations or impermeable layers near the firn–ice transition could separate pore clusters on a scale of metres without any connection to the open pores. Consequently the open porosity of the reconstructed firn cubes could differ from the open porosity of the firn layer within the column. However, for the estimation of the effective diffusion coefficients (and permeability), the size of the reconstructed firn cubes is large enough to reflect the characteristic tortuosity of the pore structure, as is shown by reaching constant coefficients for cube sizes larger than 12mm (Fig. 3).
Summary
In this study we presented a new method for estimating transport properties of porous media using three-dimensional reconstructions in combination with model simulations on the pore scale. Its application to the complex pore structure of polar firn was demonstrated. It was shown that promising modeling on three-dimensional firn reconstructions did not exceed contemporary computer capacities.
The method was applied to Greenland firn ice. It provides realistic Deff/D vs nop and k vs nop relations following power-law functions with exponents 2.1 and 3.4 over a wide range of an order of magnitude in open porosity. the investigation of lateral and vertical components reveals near-isotropy in the transport properties with slightly reduced lateral values.
In future, the presented method could help to answer many questions linked to firn structure. Further information about structure (e.g. the pore-size and ice-cluster distributions, the number of free surfaces and the pore connectivity) can be easily derived from the three-dimensional reconstructions using standard image analysis software. An interesting problem to investigate, which has to be solved on the pore scale, is the evolution of stratigraphical characteristics during densification, especially the development of impermeable layers.
Acknowledgements
We are grateful to P. Doroshkevychwho prepared many serial images. We would like to thank H. Fischer, D. Wolf-Gladrow, F. ValeroDelgado,T. H. Jacka andtwo anonymous referees for helpful comments on the manuscript.



