Introduction
Controlling weed populations is essential for optimal productivity of agricultural crops. Weeds can diminish crop yield by outcompeting for resources and may also interfere with farming equipment at harvest. Selective herbicides are used as a management strategy to remove weeds from a cropping system such that crops may grow without interference.
Herbicides often work through a single mechanism of action (MOA), targeting a single gene product in the weed and disrupting part of the weed’s normal life cycle. However, applications of a herbicide year after year can select for weed resistance. Resistance can occur via monogenic or polygenic (quantitative) mechanisms. Monogenic resistance develops when weeds that possess a resistant gene begin to flourish, eventually dominating the population. Polygenic resistance occurs when more than one gene contributes to resistance. Polygenic resistance is often quantitative, with each gene contributing a small amount to the overall resistance trait (Powles and Yu Reference Powles and Yu2010).
Since the advent of GMO crops in the 1980s, there has been increased use of the herbicide glyphosate in commercial agriculture in the United States. After a decade or more of intense glyphosate use, glyphosate-resistant weeds began to emerge across the country. Many of the current herbicide MOAs (trazines, acetolactate synthase and acetyl-CoA carboxylase inhibitors, glyphosate) have already produced resistance in a variety of weed species (Heap Reference Heap2017). The objective of this work is to increase the life span of a herbicide before resistance occurs. However, predicting the time before resistant weed populations develop is difficult through experimentation alone. The frequency of a resistant gene in a weed population is likely extremely small (10−6 to 10−9 resistant seeds per total population), so an experimental study of resistance would require millions to billions of plants (Neve et al. Reference Neve, Norsworthy, Smith and Zelaya2011a, Reference Neve, Norsworthy, Smith and Zelaya2011b). Other than the technical difficulties of studying such large populations, having so many plants creates the possibility of growing a rare resistant plant, which could then spread outside the experimental population. Furthermore, resistant populations may take decades to appear (as was seen for glyphosate). Modeling weed population dynamics provides a cheaper, more practical alternative for studying weed population dynamics and herbicide-resistance evolution. Modeling allows the simulation of various “what if” scenarios within minutes, not years. Additionally, a model can be used to investigate management strategies (hundreds of potential best management practices [BMPs] combinations) to predict the best course of action to delay resistance and maximize a product’s life span. With reliable models, multiple sites of herbicide action could be considered by farmers and agricultural producers to minimize the onset of weed resistance for remaining herbicide products.
Applying every herbicide management practice each year would be impractical. In a follow-up paper, an appropriate objective function with penalties is defined and optimization procedures are exercised to offer the best combinations of management strategies that lead to maximizing herbicide life span. However, in the current paper, we document the modeling used and illustrate how various mitigation practices can be used to extend a product concept over a long (many year) duration. Examples for the new EnlistTM weed control system herbicide (2,4-D) used in cotton fields are provided.
Materials and Methods
Life Cycle and Seedbank Dynamics
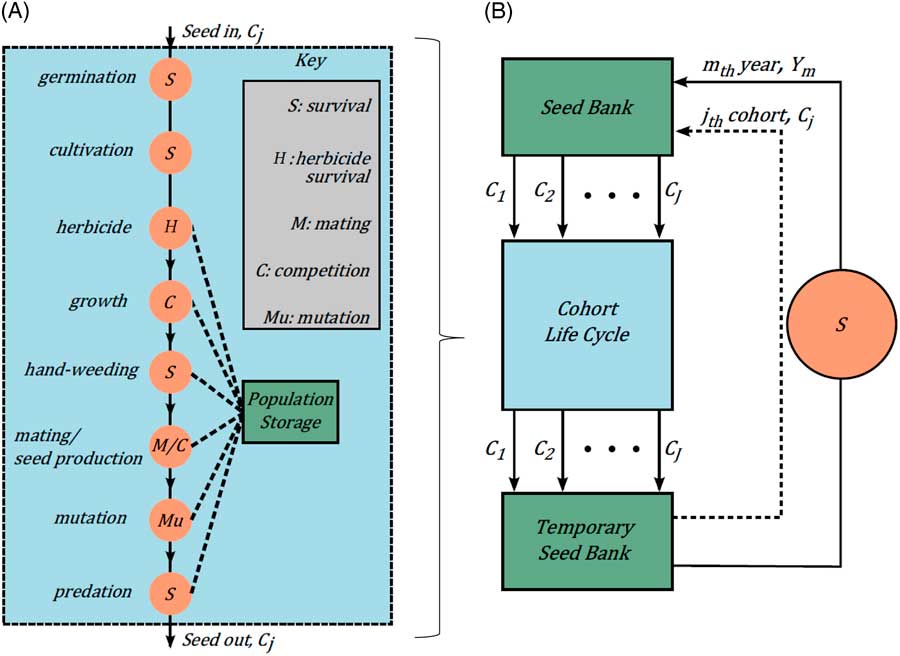
This work follows the weed life cycle (LC) originally proposed by Maxwell et al. (Reference Maxwell, Roush and Radosevich1990), Figure 1A. Beginning at the seedbank, which is the natural storage of viable seeds in the soil, weeds go through various life stages, ultimately ending with the plant producing new seeds, which enter the seedbank. At the start of the season, seeds exit the seedbank. The seeds (plants) go through a variety of life cycle functions. A life cycle function takes a population as an input and produces a new population as its output. The life cycle chosen for this study was: seedbank→germination→cultivation→herbicide(s) application(s)→growth to reproductive maturity→hand weeding→mating+seed production→mutation of newly produced seed→predation→winter survival→next year’s seedbank.
Weed life cycles of (A) a single cohort and (B) multiple cohorts.

Many weeds do not emerge at a single time within a season, but instead emerge continuously throughout the season. An approximation is to relax the model to allow weeds to appear in groups at different times in the season, called cohorts. For example, if weeds appear continuously from May through August, an approximation to this could be to group weeds into four cohorts, one for each month in that time period. The cohort life cycle structure is shown in Figure 1. At the end of each cohort period, seed can be passed back to the current seedbank to emerge during the same season (to create new cohorts) or directly to next year’s seedbank at the end of the season (Figure 1B).
Model Setup
A chief goal of the current weed resistance models is modularity that allows for ease, freedom, and flexibility in creating an LC. Several generic and specific resistance functions were created to simulate various stages in the weed LC. All functions take population as an input (P o) and return a new population (P n), respectively. The resistance specific functions for a weed are herbicide survival, mating, and mutation. Each function will be discussed separately. Before we discuss the LC functions in detail, we describe how population information for the different types of resistance is stored at each step.
Monogenic Resistance
Monogenic resistance occurs when a single gene confers resistance. Single-MOA herbicides are used to target a single gene product for which a diploid plant is assumed to have a pair of alleles of either the resistant (R) or susceptible (S) type, or one of each. For a single herbicide, three genotypes are therefore considered: homozygous resistant (RR), heterozygous (RS), and homozygous susceptible (SS). As additional herbicide MOAs are used, additional single target-gene loci must be considered, with a subscript assigned to each gene locus. When multiple genes are considered, we assume they are not linked. There are 3 M different genotypes, if M is the number of different herbicide MOAs against a weed species. For example, for two herbicides each targeting a separate gene product, there would be nine possible genotypes (e.g., 32), where P represents the total population and the genotype indexes represent the population of the respective genotype, as seen below.
 $$\eqalignno{ P\,\,\,&{\rm R}_{{\rm 1}} {\rm R}_{{\rm 1}} {\rm R}_{{\rm 2}} {\rm R}_{{\rm 2}} \,\,\,{\rm R}_{{\rm 1}} {\rm R}_{{\rm 1}} {\rm R}_{{\rm 2}} {\rm S}_{{\rm 2}} \,\,{\rm R}_{{\rm 1}} {\rm R}_{{\rm 1}} {\rm S}_{{\rm 2}} {\rm S}_{{\rm 2}} \,\,\,{\rm R}_{{\rm 1}} {\rm S}_{{\rm 1}} {\rm R}_{{\rm 2}} {\rm R}_{{\rm 2}} \,\,\,{\rm R}_{{\rm 1}} {\rm S}_{{\rm 1}} {\rm R}_{{\rm 2}} {\rm S}_{{\rm 2}} \,\,{\rm R}_{{\rm 1}} {\rm S}_{{\rm 1}} {\rm S}_{{\rm 2}} {\rm S}_{{\rm 2}} \,\cr&{\rm S}_{{\rm 1}} {\rm S}_{{\rm 1}} {\rm R}_{{\rm 2}} {\rm R}_{{\rm 2}} \,\,\,{\rm S}_{{\rm 1}} {\rm S}_{{\rm 1}} {\rm R}_{{\rm 2}} {\rm S}_{{\rm 2}} \,\,\,{\rm S}_{{\rm 1}} {\rm S}_{{\rm 1}} {\rm S}_{{\rm 2}} {\rm S}_{{\rm 2}} $$
Quantitative Resistance
Polygenic resistance typically occurs when multiple polygenes each confer a small amount to the overall herbicide resistance. The assumption is that the herbicide dosage a weed can survive to reproduce follows a normal (or log-normal) distribution with a fixed standard deviation for each generation (Falconer and Mackay Reference Falconer and Mackay1996). We also assume tolerance levels follow a log-normal distribution to avoid unphysical negative values (Liu et al. Reference Liu, Bridges, Kaundun, Glasgow, Owen and Neve2017).
A log-normal distribution is parameterized by μ and σ (the mean and standard deviation of the normal distribution associated with the log-normal distribution). Note the median tolerance level, LD50, is equal to e μ. We assume, for simplicity, there is no cross-resistance. Hence, if M is the number of herbicide MOAs, then there are M pairs of μ and σ. For example, when using two different herbicides having different MOAs, P represents the population, and μ and σ define the log-normal distribution for their respective herbicide tolerance levels.
 $$P\,\left( {\rmu _{{\rm 1}} ,\rsigma _{{\rm 1}} } \right)\,\left( {\rmu _{{\rm 2}} ,\rsigma _{{\rm 2}} } \right)$$
Life Cycle Functions
The generic life cycle functions, survival and competition, are the same for monogenic and polygenic resistance. However, the resistant specific functions differ.
Survival
The simplest function is survival, which assumes a linear model to calculate the change in the population. Survival is used to model germination, cultivation, hand weeding, predation, and winter survival. The equation is
 $$P_{{\rm n}} \,{\equals}\,fP_{{\rm o}} $$
where f is a proportionality constant, P n is the new plant density, P o is the original plant density. Survival can be used to model population growth if f is greater than 1 or death if f is less than 1.
Competition
A competition function is used to model the process for a weed to compete for resources for survival. The competition algorithm is
 $$P_{{\rm n}} \,{\equals}\,{{AP_{\rm o} } \over {1{\plus}C{\plus}kP_{\rm o} }},$$
where A is a weed growth rate constant, C represents competition with the crop plants, and k is the weed competitiveness parameter. Thus, competition for seed survival to maturity and seed production is accounted for. Some further explanation may help clarify the behavior of the competition function. For the special case of C=0 and k<<1, the model reduces to
 $$P_{{\rm n}} \approx AP_{{\rm o}} ,$$
which is a simple linear model like survival. For the limit of P 0 → ∞, the ratio limits to the value
 $${A \over k},$$
which is the maximum value that the function can attain (and thus is a ceiling on how large the population can get). This ceiling is the maximum number of weeds possible per unit area used in modeling weed growth.
In the context of seed production, the model may be written as
 $$P_{{\rm n}} \,{\equals}\,\left( {{A \over {1{\plus}C{\plus}kP_{{\rm o}} }}} \right)P_{\rm o} .$$
Since P o (plants area−1) is a plant density, and the new population of seed produced has units of seed density (seed area−1), the quantity in parentheses must have units of (seeds plant−1).
An equivalent form for Equation 3 can be written as:
 $$P_{{\rm n}} \,{\equals}\,{{{\rm \alpha }P_{\rm o} } \over {1{\plus}C{\plus}{\alpha \over {P_{{{\rm max}}} }}P_{\rm o} }},$$
where α is a growth parameter and P max is the maximum population achievable by the competition model.
Herbicide Survival
The user may specify whether a herbicide application is applied to each cohort or not. Herbicides do not always have 100% efficacy. For example, it can be the case that weeds in the field may escape an application of herbicide altogether. In this paper, “weeds surviving a herbicide application” refers to weeds that survive a herbicide application undamaged and are able to reproduce unimpeded. This assumption, while not perfect, relaxes the model and allows for more straightforward computations.
Monogenic Resistance.
Herbicide survival for monogenic resistance uses a linear model to calculate the change in the population. It acts on each genotype and is represented as:
 $$P_{{{\rm n},j}} \,{\equals}\,f_{j} P_{{{\rm o},j}} .$$
Here the subscript j is an index that can take on value RR, RS, or SS. Each genotype will have a unique proportionality constant f j . Like survival, this function can be used to simulate growth (or death) for a weed species.
Polygenic Resistance.
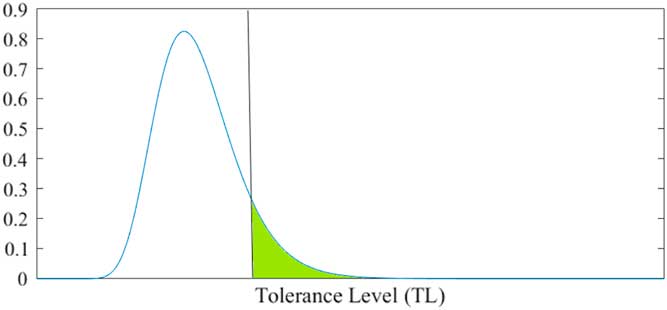
When a herbicide dose is applied to a population, P, all plants with a tolerance level, TL, above the applied dose survive (those with a lower tolerance die off) (Figure 2). However, herbicides do not always have 100% efficacy. Thus, a fraction of the susceptible plants may escape the herbicide application.
Herbicide dose–response function. The dark solid line represents the herbicide dose. A percentage of plants (in green) with higher tolerance level than the dose can survive.

One can calculate the fraction of resistant plants, F R, surviving the dose and the average tolerance level, T LR, of that population assuming the weed population’s tolerance levels follow a log-normal distribution. The fraction of susceptible plants, F S, escaping the herbicide application and the average tolerance level, T LS, of that population is known (depending on the efficacy of the herbicide).
When more susceptible plants escape a herbicide application, seed production is increased but the average tolerance level of the produced seed is reduced. Hence, if no susceptible plants survive, there will be fewer seedlings sprouting the next year but, on average, those seedlings will have a higher tolerance level. In contrast, if more susceptible plants survive, more seedlings will sprout the next year, but those seedlings will have a lower tolerance level.
With σ assumed to be constant, the population surviving the herbicide, P H, the tolerance level of that population, TL H, and the mean μ value for the surviving population, μH, is calculated as:
 $$P_{{\rm H}} \,{\equals}\,P(F_{{\rm R}} {\plus}F_{{\rm S}} ),$$
 $$TL_{{\rm H}} \,{\equals}\,{{F_{{\rm R}} TL_{{\rm R}} {\plus}F_{{\rm S}} TL_{{\rm S}} } \over {F_{{\rm R}} {\plus}F_{{\rm S}} }},$$
 $${\rm \rmu }_{{\rm H}} \,{\equals}\,\ln \left( {TL_{{\rm H}} } \right){\minus}{{\rsigma ^{2} } \over 2}.$$
Mating
Monogenic Resistance.
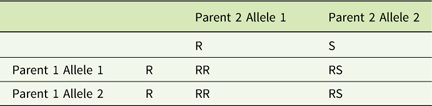
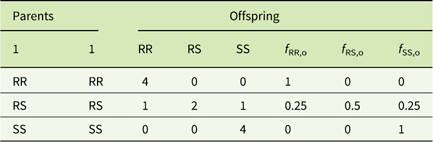
Plants may mate with neighboring plants (outcrossing) or self-fertilize (selfing), and a selfing fraction, τ, is defined to allow for all combinations (i.e.,τ may assume any value from 0 [pure outcrossing] to 1 [pure selfing]). To illustrate the two cases, a single gene locus and three unique genotypes are considered: RR, RS, and SS. When plants cross-pollinate or are self-compatible, the genetics of the progeny are assumed to follow Mendelian genetics, producing offspring according to the Punnett square. For example, an RR mating with an RS have the Punnett square and offspring summarized in Table 1. In this case, two offspring have the RR genotype and two have RS. In the case of a selfing plant, the alleles for Parent 1 and Parent 2 would be the same.
Punnett square example for a homozygous resistant (RR) mating with a heterozygous (RS).

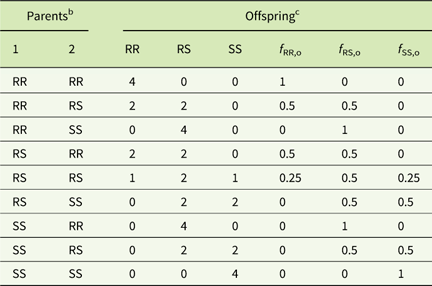
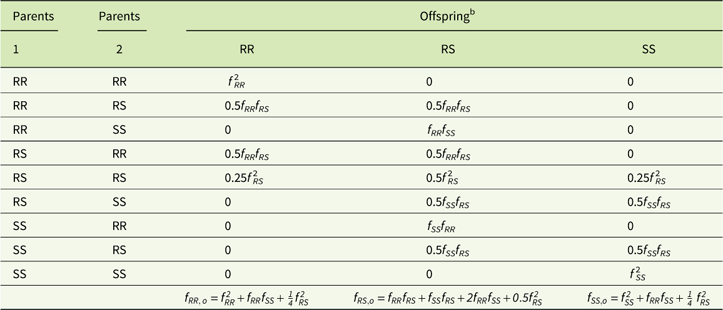
A mating table for outcrossing can be constructed wherein each possible combination of parent genotypes is considered. There are nine possibilities for outcrossing plants with one gene locus (Table 2), where each row corresponds to one mating-pair possibility and one Punnett square. The columns RR, RS, and SS are the total number of offspring of each type from each mating pair. Columns f
RR,o, and so on are the frequency of each genotype, computed by dividing each of the previous three columns by the total number of offspring (four for this example). The offspring frequency can be related to the parent frequency. For example, the frequency of Parent 1 RR×Parent 2 RR matings are equal to the parent frequencies
 $ f_{{{\rm RR}}} {\times}f_{{{\rm RR}}} \,{\equals}\,f_{{{\rm RR}}}^{2} $
. The frequency of offspring from this pair is
 $1f_{{{\rm RR}}}^{2} $
. Similarly, the frequency of Parent 1 RR×Parent 2 RS matings are equal to the parent frequencies f
RR×f
RS. Since this mating produces 2 RR and 2 RS, the frequency of offspring from these pairs is RR:0.5f
RR
f
RS and RS:0.5f
RR
f
RS. The bookkeeping for each mating pair is shown in Table 3. The total offspring frequency is found by summing the rows in each column. It is customary to define the total allele frequency of R and S as:
 $$p\,\equiv\,f_{{{\rm RR}}} {\plus}0.5f_{{{\rm RS}}} ,$$
 $$q\,\equiv\,f_{{{\rm SS}}} {\plus}0.5f_{{{\rm RS}}} ,$$
where p+q=1. After some algebra, it can be found that
 $$f_{{{\rm RR},{\rm o}}} \,{\equals}\,p^{2} \,\,f_{{{\rm RS},{\rm o}}} \,{\equals}\,2pq\,\,f_{{(SS,o)}} \,{\equals}\,q^{2} .$$
Mating table for outcrossing plants.Footnote a

a Abbreviations: RR, homozygous resistant; RS, heterozygous; SS, homozygous susceptible.
b Each row corresponds to one Punnett square.
c RR, RS, and SS columns represent the number of offspring of each genotype from each mating pair. f columns are the frequency of each genotype of the offspring.
Relationship between parent frequency and offspring frequency.Footnote a

a Rows correspond to the rows seen in Table 2.
b Offspring frequency, shown in the final row, is found by summing the columns and assumes the plants are not spatially structured.
There is an underlying assumption that the gene pool is infinite. Outcrossing populations that mate according to the infinite gene pool assumption achieve equilibrium after one round of mating, this is known as the Hardy-Weinberg equilibrium.
For multiple genotypes, outcrossing generalizes in a straightforward manner to
 $$f_{{j,o}} \,{\equals}\,{\rm }\mathop \prod\limits_{n\,{\equals}\,1}^{N_{{{\rm loci}}} } Q_{n} ,$$
where j is the genotype identifier, n is an index to refer to the gene locus under consideration, N loci are the total number of gene loci, and
 $$Q_{n} \,{\equals}\,\left\{ {\matrix{ {p_{n}^{2} } \cr {2p_{n} q_{n} }. \cr {q_{n}^{2} } \cr } } \right $$
For example, the offspring proportions for two gene loci are represented in Table 4.
Offspring proportions for two gene loci.

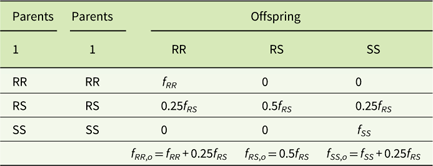
Selfing does not generalize as easily and requires a mating table approach. The single gene locus case is presented here. Unlike in outcrossing, Parent 1 and Parent 2 are the same plant, and thus have the same genotype. The mating table for a single gene locus (Table 5) with the frequency of offspring (Table 6) is provided.
Mating table for a selfing plant for a single gene locus.

The frequency of the offspring for a selfing plant with a single gene locus.

These results show that for a pure selfing population, the frequency of the RS genotype is halved each time. Thus, the heterozygote population tends to approach zero for a selfing population. Selfing with multiple genes, is programmed into the model. However, the calculations are not reader-friendly.
Quantitative Resistance.
Weeds that survive the herbicide application and competition functions pass their genetic information to their seeds through additive heritability via Breeder’s equation (Falconer and Mackay Reference Falconer and Mackay1996), where the subscript H represents the weeds that survived the herbicide, NS represents new seed, CSB represents the current seedbank, NSB represents the new seedbank after incorporation of new seeds into the current seedbank, and h 2 is the narrow-sense heritability constant between 0 (no heritability) and 1 (full heritability)
 $${\rm \rmu }_{{{\rm NS}}} \,{\equals}\,{\rm \rmu }_{{{\rm CSB}}} {\plus}h^{2} \left( {{\rm \rmu }_{{\rm H}} {\minus}{\rm \rmu }_{{{\rm CSB}}} } \right).$$
Seed are incorporated into the seedbank when produced. The following equations are used to calculate the new herbicide tolerance level (TL) for newly produced seeds (TL NS), the tolerance level for the new seedbank (TL NSB), the population of the new seedbank (P NSB), and the mean value for the new seedbank (μNSB).
 $$TL_{{{\rm NS}}} \,{\equals}\,exp({\rm \rmu }_{{{\rm NS}}} {\plus}{{{\rm \rsigma }^{2} } \over 2}),$$
 $$TL_{{{\rm NSB}}} \,{\equals}\,{{P_{{{\rm NS}}} TL_{{{\rm NS}}} {\plus}P_{{{\rm CSB}}} TL_{{{\rm CSB}}} } \over {P_{{{\rm NS}}} {\plus}P_{{{\rm CSB}}} }},$$
 $$P_{{{\rm NSB}}} \,{\equals}\,P_{{{\rm NS}}} {\plus}P_{{{\rm CSB}}} $$
 $${\rm \rmu }_{{{\rm NSB}}} \,{\equals}\,\ln ({\rm TL}_{{{\rm NSB}}} ){\minus}{{{\rm \rsigma }^{2} } \over 2}.$$
Mutation
Mutation is important if gene amplification is the mechanism conferring resistance. The effect of mutation for monogenic resistance is included in the model code. However, mutation will not be considered in this paper.
Extinction
Populations are tracked on a per area basis, (e.g., 2 plants m−2 or 500 seed m−2), and if a field were considered infinite, populations could become indefinitely small. However, a finite field cannot have a population smaller than 1 plant field−1, and this is when an extinction event is used. As an example, suppose that the population after 5 yr of simulation reaches a small value of 10−7 plants m−2. In the infinite-field assumption, this is not an issue, because the field is always large enough for fractions of plants or seeds. On the other hand, if the field is 106 m 2, and the model predicted 10−1plants in the field, this would be a physical impossibility. Thus, to enforce the finite-field assumption, a random number is used to decide whether the population is 1 plant field−1 or 0 plant field−1.
In the monogenic resistance model, the population density of each genotype is checked after each life stage. If the field size is infinite, no extinction event is enforced. Otherwise, the population will randomly be set to 0 or 1 (which adds a stochastic element to make each simulation unique).
Genetics of the progeny are not considered in this model. Hence, if a gene goes extinct, there is no possibility of that gene returning to the field via gene drift. However, gene drift could be a future extension of this model.
Management Practices
Herbicide applications, cultivation, hand weeding, cover crops, and deep tillage are weed management methods considered in this model. With the exception of deep tillage, the methods are built into the life cycle shown in Figure 1. Currently four herbicides (MOAs) are allowed. One can specify a herbicide application rate for each cohort in each year as long as a representative dose–response function is also specified. Different efficacy values may be used for each of the genotypes for monogenic resistance, allowing for partial resistance for the heterozygote.
Cultivation and hand weeding are incorporated using the survival function (user specified) and may be unique for each cohort per year. Cover crops are modeled using the competition function and, similar to cultivation and hand weeding, are specified in an on/off manner. The competition function has a term that accounts for weed competition with surrounding cover crop plants. While not considered in this paper, a user could set cover crops to also affect germination rates of weeds.
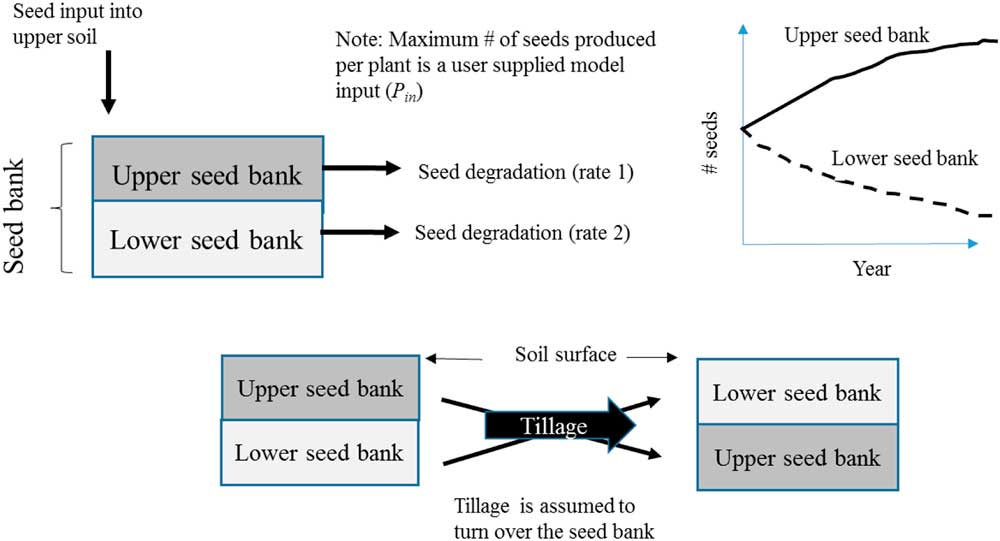
Deep tillage (any other shallower form of tillage falls under cultivation) requires a slight modification to the life cycle. The seedbank is divided into a lower seedbank and an upper seedbank (Figure 3). Beneath the upper seedbank lies the lower seedbank, which is deep enough in the soil to keep seed from growing into weeds. Instead, the seed lies dormant. Depending on the soil conditions, seed may decay rapidly or slowly, and a simple survival function acts on the seed population once per year.
When a deep-tillage event occurs, the upper and lower seedbanks (and respective properties as seen: density, fraction of resistant seeds, and so on) are switched. Seeds are only input into the upper seedbank. If no deep-tillage event occurs, seeds accumulate in the upper seedbank, while seeds in the lower seedbank degrade over time.

Seeds dropped from the growing weeds are assumed to only be incorporated into the upper seedbank. Hence, it is assumed there are no cracks for seeds to fall into the lower seedbank. Thus, the seed density and the fraction of resistant seeds increases in the upper seedbank over time (and without deep tillage). The lower seedbank density decreases as seeds degrade over time, since no seeds are assumed to be incorporated into the lower seedbank. When a deep-tillage event occurs, it is assumed that the upper seedbank is completely replaced by the lower seedbank (and vice versa) (Figure 3).
For example, consider two simple populations for the upper and lower seedbanks. The frequency of resistance in each is denoted by U and L, respectively. Suppose that in the upper seedbank, the frequency is increasing by two times per year, represented by the difference equation (n=new, o=old)
 $$U_{{\rm n}} \,{\equals}\,2U_{{\rm o}} , $$
and in the lower seedbank, the frequency remains constant
 $$L_{{\rm n}} \,{\equals}\,L_{{\rm o}} .$$
If deep tillage is assumed to occur in year 10, the upper and lower seedbank values are swapped
 $$U_{{10}} \leftrightarrow L_{{10}} .{\rm }$$
As we will see in the “Results” section, simulations assuming no deep tillage versus deep tillage suggest weed resistance can be greatly delayed simply by swapping the upper and lower seedbanks
Parameterizing the Model
Palmer amaranth (Amaranthus palmeri S. Watson) is the weed chosen and assumed growing in cotton (Gossypium hirsutum L.) fields. The herbicides used are not specific to any particular chemistry, but each herbicide is assumed to operate by a different MOA. Cotton seed is typically planted with 10-cm spacing, in rows spaced 91 cm apart. For the following section, Y, sd, pl, and M represent yield, seeds, plants and population, respectively. An average cotton plant density is about 10 plants m−2. Properties for A. palmeri (PA) include:
∙ Massinga et al. (Reference Massinga, Currie, Horak and Boyer2001) found that Y *=421,000sdpl−1, Y m =582,300sdm−2 for A. palmeri growing with corn, fitting equation Y=Y * M/(1+MY */Y m ). Note that Y * is the maximum number of seeds produced per plant (as defined above), and Y m is the maximum number of seeds per area as M → ∞.
∙ Norsworthy et al. (Reference Norsworthy, Neve, Smith, Foresman, Glasgow and Zelaya2008) assumed cotton is 16.7% more competitive than corn, yielding Y *=505,200sdpl−1, Y m =698,760sdm−2
∙ Keeley et al. (Reference Keeley, Carter and Thullen1987) report that, with no competition, PA produces 613,000, 245,000, 83,000, and 62,000 seeds from weeds that were planted in May, June, July, and August, respectively. This study was done in Shafter, CA.
∙ MacRae et al. (Reference MacRae, Culpepper, Webster, Sosnoskie and Kichler2008) also report (citing various sources):
° PA with 3-leaf cotton: 61,000 sd pl−1 (or 1.1×10⁹ sd ha−1 and 1.8 PA m−2)
° PA with peanut: 1.1×10⁹ sd ha−1 at 5.7 pl m−2
° PA with soybean: 32,300 sd m−2 at 8 pl m−1 row
° PA with corn: 514,000 sd m−2 (5.1×10⁹ sd ha−1 in corn)
° PA with 17-leaf cotton: 14,000 sd pl−1
° PA with 6- to 7-leaf corn: 83% reduction relative to emerging with corn
° PA with soybean: 34% fewer seeds at 19-cm soy spacing versus 91 cm
° PA density early season can exceed 50 pl m−2 (>500 pl m−2 in heavily infested), but <15 pl m−2 later in the season
Seed Production Parameters
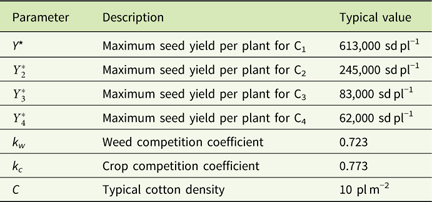
Norsworthy et al. (Reference Norsworthy, Neve, Smith, Foresman, Glasgow and Zelaya2008) assumed that typical cotton density is 10 pl m−2 and the ratio Y */Y m =0.723 is fixed and holds for other PA crop systems. For MacRae’s value Y *=613,000 sd/pl, we find that Y m =847,860 pl/m 2. Comparing the relationship used by many researchers to that of Massinga et al. (Reference Massinga, Currie, Horak and Boyer2001) yields
 $$Y\,{\equals}\,{{Y^{{\rm {\asterisk}}} M} \over {1{\plus}MY^{{\rm {\asterisk}}} /Y^{m} }}\,{\equals}\,{{Y^{{\rm {\asterisk}}} M} \over {1{\plus}k_{w} M}}{\rm },{\rm }$$
where the ratio Y */Y m (taken as 0.723) is k w . To incorporate the competition between PA and cotton, PA at 1.8 pl m−2 yields 1.1×10⁹ sd ha−1 (1.1×10⁵ sd m−2) (from MacRae et al. Reference MacRae, Culpepper, Webster, Sosnoskie and Kichler2008). Therefore
 $$Y\,{\equals}\,{{Y^{{\rm {\asterisk}}} M} \over {1{\plus}k_{c} C{\plus}{\rm }k_{w} M}}\,{\equals}\,{{\left( {613,000} \right)\left( {1.8} \right)} \over {1{\plus}(10)(0.773){\plus}\left( {1.8} \right)(0.723)}}\,{\equals}\,110,000.$$
The maximum amount of seed produced decreases for each subsequent cohort. From Keeley et al. (Reference Keeley, Carter and Thullen1987), Y * is 245,000, 83,000, and 62,000 for the second, third, and fourth cohorts, respectively. Table 7 summarizes the seed production parameters used in this analysis, while Table 8 tabulates the additional input parameters required to parameterize the weed resistance model.
Seed production parameters used in the analysis.

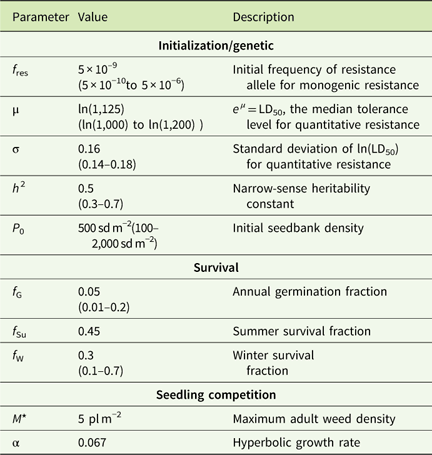
Summary of input parameters used in this analysis.

Initialization Parameters
Two parameters set the initial state of the seedbank for monogenic resistance: the initial resistant allele frequency and the seedbank density. These parameters are likely to vary from field to field and may depend on factors such as cross-contamination from farm equipment and soil runoff. Neve et al. (Reference Neve, Norsworthy, Smith and Zelaya2011a, Reference Neve, Norsworthy, Smith and Zelaya2011b) provide a range of values for initial resistant allele frequency of 5×10⁻¹⁰ to 5×10⁻⁷ and initial seedbank densities of 100 to 2,000. The average frequency and density used by Neve et al. (Reference Neve, Norsworthy, Smith and Zelaya2011a, Reference Neve, Norsworthy, Smith and Zelaya2011b) and this analysis are 5×10⁻⁹ and 500sd/m 2. For quantitative resistance, there are four initial parameters: initial LD50, the variance of ln(LD50), heritability, and the seedbank density. LD50 is in the range 1.0 to 1.2 kg ha−1. One can calculate the variance of ln(LD50) using a similar assumption from (Liu et al. Reference Liu, Bridges, Kaundun, Glasgow, Owen and Neve2017) that in a pristine population between 5×10⁻³and 5×10⁻⁵ of the A. palmeri weeds are resistant to a conventional application of herbicide. The heritability constant of 0.5 was made as an assumption.
The estimates provided by Neve et al. (Reference Neve, Norsworthy, Smith and Zelaya2011a, Reference Neve, Norsworthy, Smith and Zelaya2011b) are used for the fraction of PA seeds that germinate, f G, the natural mortality of seedlings, f M, and the fraction of seeds which survive predation, winter, and so on to reach next year’s seedbank, f W (also known as the winter survival fraction). The range of germination fraction is given to be 0.01≤f G,≤0.2, with a typical value of 0.05. In addition to surviving a herbicide application; a seedling must overcome natural mortality. We estimate f M=0.1. Neve et al. (Reference Neve, Norsworthy, Smith and Zelaya2011a, Reference Neve, Norsworthy, Smith and Zelaya2011b) presents a range of 0.05≤f M≤0.5, depending on when in the season the plant emerges (seedlings emerging later are more likely to succumb to natural mortality, with 50% of them dying in the latest part of the season).
Neve et al. (Reference Neve, Norsworthy, Smith and Zelaya2011a, Reference Neve, Norsworthy, Smith and Zelaya2011b) assumed that 90% of new seeds are viable and that 50% of new seeds fall to predation (e.g., for 100 seeds, 50 fall to predation and only 45 of those are viable). To estimate the number of seeds that are viable at the end of the growing season (f W), we define a summer fraction f Su=0.45. Neve et al. (Reference Neve, Norsworthy, Smith and Zelaya2011a, Reference Neve, Norsworthy, Smith and Zelaya2011b) estimates that 0.7 of the seeds are lost in the seedbank, with a range of 0.3≤f W≤0.9. All parameters used in the analysis are summarized in Table 8.
Herbicide Dose–Response Function (Monogenic Resistance)
The selection of a sigmoid function is based upon the ability to fit the function to data observed for susceptible weed species (SS), and is easily parameterized to qualitatively mimic a dose–response function for RS and RR species. Often, dose–response data do not exist for fully resistant or partially resistant weed species. However, several trends are commonly observed. As weed populations build up resistance, the dose–response function is typically shifted to the right of the x-axis (dose must increase to observe the same effect in resistant weeds as observed in susceptible weed populations). Resistant weeds can often be controlled by the herbicide, but now at much higher applications rates than what was necessary for the susceptible weeds. Also, the efficacy against resistant weed species has a very broad span at the higher efficacies (i.e., it requires a large change in dose to register small changes in efficacy).
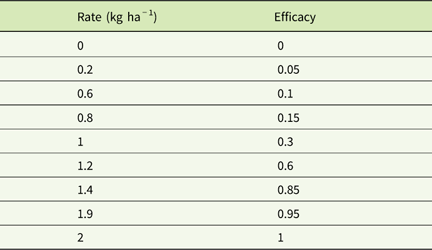
A sigmoid function was selected that could fit the observed data for susceptible species (SS) and through simple scaling of one or more parameters could mimic qualitative behavior for RS and RR weed species. The four-parameter logistic function (b, c, d, LD50) is one of the most routine sigmoid-type functions used to approximate dose–response functions from experimental observations (S Ray, Dow AgroSciences statistician, personal communication) (Equation 23). A representative synthetic dose–response (DR) data set (Table 9) was fit to Equation 23 for 2,4-D response
 $${\rm Efficacy}{\equals}c{\plus}{{d{\minus}c} \over {1{\plus}\left( {{{{\rm dose}} \over {{\rm LD}_{{{\rm 50}}} }}} \right)^{b} }}.$$
Dose–response data used to compare the fit associated with different sigmoid functions for 2,4-D against common weed species.

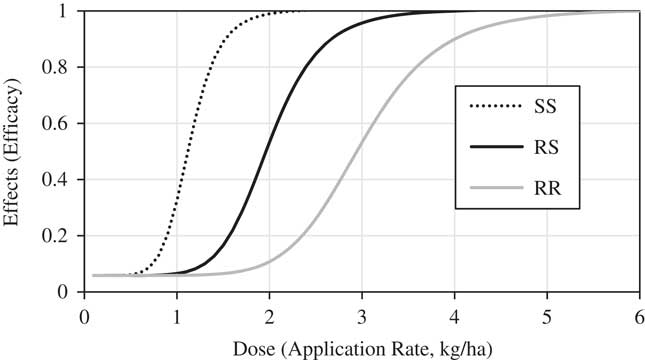
The DR data are dependent upon the pesticide used and the targeted weed species. An efficacy of 0 is indicative of no impact to the weed, whereas an efficacy of 1.0 indicated the dose was large enough to kill 100% of the weeds. Resistant weed populations can often be killed simply by increasing the application rate, since it takes a larger herbicide application rate to achieve similar control as a weed populations starts to build up resistance to a herbicide. Therefore, Equation 23 can be used to estimate the DR function for SS, RS, and RR weed species simply by changing the magnitude for LD50 (e.g., the dose at which 50% of the weeds are killed). As LD50 increases, the DR function is stretched and indicative of the increased amount of herbicide required for the different weed susceptibilities (SS, RS, RR) (Figure 4).
Quantitative dose–response functions for homozygous resistant (RR), heterozygous (RS), and homozygous susceptible (SS) weeds approximated by a four-parameter sigmoid function.

Weed Resistance Metrics
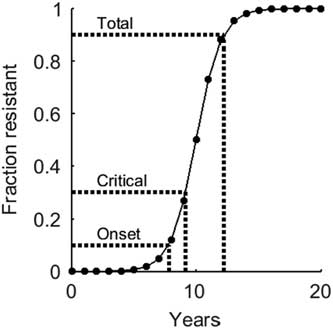
For an infinite field size, the resistance fraction can become extremely small but assumed real. However, for a finite field, the resistant seed has the capability of becoming extinct once there becomes only 1 resistant seed or plant left in the field. Three thresholds for the resistant fraction of the population must be specified: a resistance onset threshold (lowest level of resistance, when a grower might first notice the weeds not responding to herbicides), a critical resistance threshold (once exceeded, a grower would regard the current herbicide ineffective), and a total resistance threshold (highest threshold representing the level of resistance when a field is completely overrun with weeds) (Figure 5).
Three metrics used to characterize the weed resistant fraction over time.

Achieving total resistance in a field is unrealistic, as a grower would likely resort to other means of weed management. The values of the resistance thresholds are arbitrary and possibly vary among fields, crops, and growers. Henceforth, resistance onset (RO), critical resistance (CR), and total resistance (TR) are denoted by f RO=0.05, f CR=0.3, and f TR=0.95, respectively. The risk integral (RI), was developed for this model and is used as a metric to evaluate risk of resistance. It is defined as
 $${\rm RI}\,{\equals}\,{{\small \int _0^T f\left( t \right)dt} \over {\small\int _0^T dt}}\,{\equals}\,{1 \over T}\mathop \small\int \nolimits_0^T f\left( t \right){\rm }dt,$$
where T is the simulation interval (years) for fractional resistance.
In actuality, f is not a continuous function but has a discrete value for every cohort in every year. Therefore, the sum of the area is approximated using the trapezoid rule (Stewart Reference Stewart1995). Letting T=n cohorts*n years, the trapezoid rule states
 $${\rm RI}\,{\equals}\,{1 \over {2T}}\mathop \sum\limits_{j\,{\equals}\,0}^{T{\minus}1} (f_{{j{\plus}1}} {\plus}f_{j} ).$$
The prefactor (1/T) ensures the risk integral may take on values from 0 to 1. For noninfinite-field simulations, RI and the threshold time metrics will likely vary between simulations.
Results and Discussion
The application of various management strategies showcases their impact on delaying monogenic resistance. The efficacy for each herbicide at standard rates is assumed to be 0.95, 0.28, and 0.07 for RR, RS, and SS, respectively. The model was implemented and run in MATLAB.
Finite Field Size
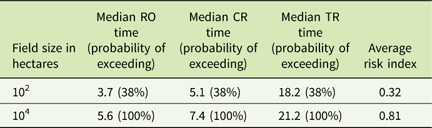
For this simulation, the default parameters are used with one cohort, one application of herbicide per year, and no additional management strategies. When the field size is finite, resistant seed has the capability of becoming extinct once there is only 1 resistant seed or plant left in the field. When and if this scenario is encountered, a random number is generated and used to assign if the seed becomes extinct or continues into the next year of simulation. Simulation results for resistance onset occurring in a finite size field are summarized in Table 10, with differences observed in this table due to smaller field size having a higher probability for extinction.
Simulation results for resistance onset occurring in a finite size field.

Infinite Field Size
In this section, we investigate the effect of various management strategies on delaying herbicide resistance. In each simulation, unless stated otherwise, we assume the default parameters are used with one cohort and one application of herbicide per year.
Multiple Herbicides
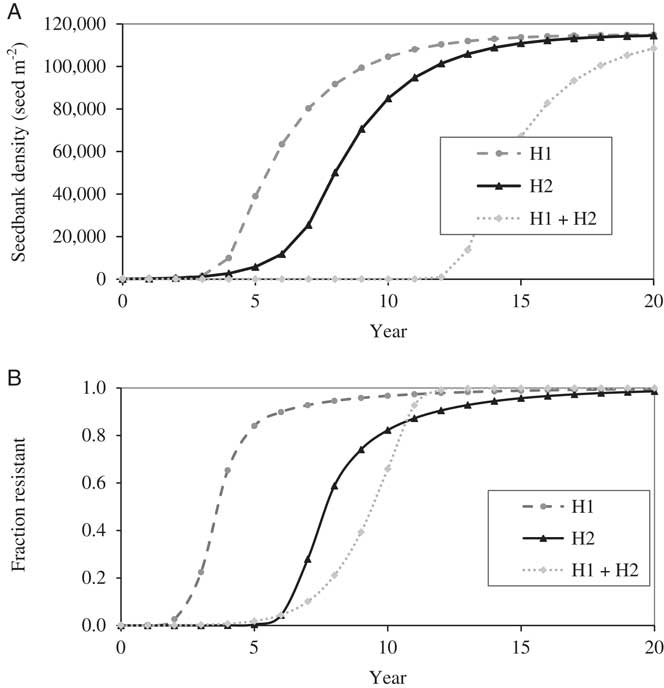
A plausible scenario today is that significant resistance to the first herbicide has developed (glyphosate), and a second herbicide (EnlistTM weed control system) is introduced. Suppose that the initial frequency for gene locus 1 is10−4 (some resistance) and for gene locus 2 is 10−8 (little to no resistance). The best results occur when both MOAs are used each year, even when the first mechanism has already shown signs of resistance pressure (Figure 6).
Simulation results for two herbicide mechanisms of action, but monogenic resistance has already been established for the first herbicide, H1, (initial resistant allele frequency:10−4) but not for the second herbicide, H2, (initial resistant allele frequency:10−8). (A) Seedbank density versus time and (B) fraction resistant versus time.

Cultivation
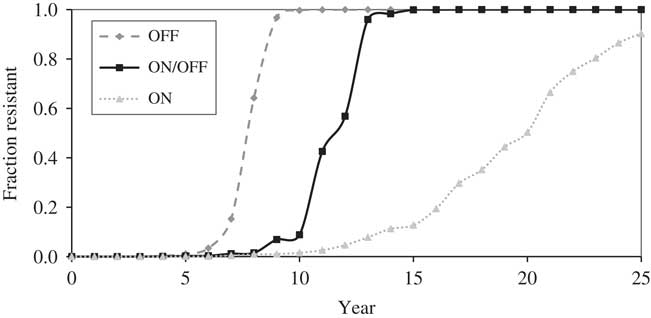
The default initial seed density and resistant allele frequencies for the herbicides set to 100sd/m2 and 10−8 for both the upper and lower seedbanks. Simulations for cultivation, are carried out for OFF (no management practice) every year, ON and OFF in alternating years, and ON in all years. The effect of cultivation is shown in Figure 7. Resistance was delayed the longest when using cultivation each year. Hence, the risk integral would also be reduced when cultivation is used every year. Similarly, the effects of hand weeding and cover crops show similar trends in delaying resistance, but the effect of each is less pronounced than cultivation (unpublished data).
Effect of cultivation for three cases: OFF all years, ON odd years+OFF even years, ON all years. Resistance is delayed the most by always using cultivation.

Deep Tillage
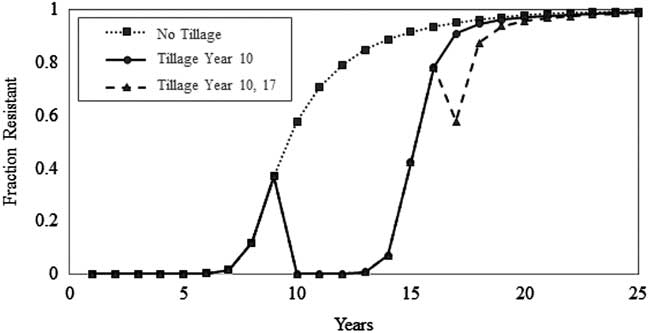
Three cases are considered to explore the effect of deep tilling. These cases include (1) no tilling, (2) tilling at year 10, and (3) tilling at year 10 and year 17. Although A. palmeri seeds have short longevity (see Table 8), in all cases seed degradation in the lower seedbank is set to zero to showcase the effectiveness of a deep-tilling event. All three cases track together until year 10, when the tilling event places the upper seedbank into the lower (and vice versa) (Figure 8). As the fraction of resistance for the no-till example continues to rise over time, both deep-tillage cases drop to nearly zero when deep tillage is assumed in year 10. Following the initial drop in resistance in the surface soil layer, the year 10 till case steadily increases, eventually reaching total resistance at around year 20. Deep tillage in the year 10 and year 17 till case has a smaller jump following year 17 deep tillage. This is because there is no seed degradation in the lower seedbank (and it is assumed seed cannot be transported from the upper seedbank via soil cracks). The highly resistant seeds that were buried in year 10 are reintroduced in year 17. Thus, depending on soil degradation conditions, more than one deep tillage may not decrease resistance, and deep tillage over the product life span (25 yr in this example) is the most sensitive management practice, and any further deep tillage in subsequent years provides a diminishing return.
Impact of deep-tillage events over product life span of 0, 1 (on year 10), and 2 (on year 10 and year 17).

This article describes the simulation of weed resistance to various herbicide MOAs, including multiple MOAs and cohorts (user specified) that may exist throughout a growing season. Both monogenic and polygenic weed resistance mechanisms can be considered. Multiple management practices include (1) cultivation, (2) hand weeding, (3) cover cropping, (4) herbicide application rates, and (5) deep tillage, and examples for monogenic resistance are provided. Deep tillage proved to be the most effective management practice for reducing the onset of weed resistance. However, deep-tillage effectiveness significantly diminishes after the first deep-tillage event. Multiple deep tillages could prove effective if the degradation effect of seed viability in the lower seedbank in soil is increased. All parameters for A. palmeri used in this analysis were taken from the literature.
We assumed that when seeds are produced they are only placed into the upper seedbank and that there were no cracks for seed to fall into the lower seedbank. We also assumed that when a deep-tillage event occurs, both the upper and lower seedbanks are completely swapped. Although these are not perfect assumptions, this model still provides insight on how different strategies can delay the onset of resistance and how critical it is incorporate nonchemical management strategies. From a resistance standpoint, deep tillage is advantageous, but one would also have to consider the cost associated from soil erosion.
One preferable approach is to manage a pesticide over the longevity of a product line (i.e., different herbicides with the same MOA) and to expand participation of growers. This work has shown an extension of herbicide MOA usefulness through appropriate choices of management practices. The use of a herbicide product line ends if weed resistance within a field is greater than what a farmer deems acceptable. This work allows one to consider the longevity of a product line under different management practices and using the simple practice of periodic deep-tillage practices to increase product longevity. In future work, we explore optimization procedures built around management practices such that the optimal selection of BMPs over the product life span are made that extend (maximize) product longevity for both monogenic and polygenic mechanisms of herbicide resistance.
Acknowledgments
The authors thank DowDuPont colleagues Siva Kumpatla and Dong Wang for critical review of this article, and Mark Peterson and David Simpson for exposure to and feedback on this topic. All funding was from DowDuPont. No conflicts of interest have been declared.