Introduction
Water is becoming the most limiting resource in semi-arid and arid lands (Zhang et al., Reference Zhang, Wang, Li, Inoue, Xiang, Qiu and Jin2014). In the North China Plain (NCP), the shortage of water (Hu et al., Reference Hu, Moiwo, Yang, Han and Yang2010) and the falling of the groundwater level are important factors limiting sustainable agricultural development. Irrigation is necessary for high yield, and groundwater is the main source of irrigation water (Chen et al., Reference Chen, Zhang and Pei2007). The two major crops in the NCP are winter wheat and maize. Liu et al. (Reference Liu, Zhang and Zhang2002) indicated that ineffective soil evaporation accounted for nearly one-quarter of evapotranspiration (ET). Reducing soil evaporation through simple and easy agricultural measures could greatly increase the water use efficiency (WUE) of farmland and achieve the goal of water saving and sustainable development in agriculture. Hence, improving the WUE of crops by some agricultural practices are highly important in the NCP.
To reduce soil evaporation and save water, the application of mulch is effective (Cadavid et al., Reference Cadavid, El-Sharkawy, Acosta and Sanchez1998; Li, Reference Li2003; Limon-Ortega et al., Reference Limon-Ortega, Sayre and Francis2000; Zhang et al., Reference Zhang, Chen and Liu2005). Plastic film mulch and straw mulch are two common methods of soil surface mulching, which reduces soil evaporation and increases rainwater detention to increase the amount of soil water storage (Chakraborty et al., Reference Chakraborty, Garg, Tomar, Singh, Sharma, Singh, Trivedi, Mittal, Sharma and Kamble2010; Li et al., Reference Li, Hou, Jia, Han and Yang2012; Zhou et al., Reference Zhou, Wang, Zhang, Dong, Zheng, Gale and Li2011). Considering environmental protection factors and the requirements of sustainable agricultural development, straw mulch should be advocated. After harvesting maize in the NCP, farmers generally burn the stalks, which has now been prohibited (Chen et al., Reference Chen, Zhang and Pei2007). Maize straw can be used as a mulching material to save water, which not only reduces air pollution but also improves WUE (Wang et al., Reference Wang, Zhang, Gong, Xu, Juan and Zhao2018).
Some studies have shown that mulch does not always enhance crop yields (Chen et al., Reference Chen, Zhang and Pei2007; Li et al., Reference Li, Chen and Liu2008; Tolk et al., Reference Tolk, Howell and Evett1999). The crop growth response to straw mulch is complex, and there are many factors impacting crop yields (Wang et al., Reference Wang, Zhang, Gong, Xu, Juan and Zhao2018). Soil temperature can also impact the growth rate and yield of winter wheat. The rates of leaf tip appearance and leaf expansion could be accelerated at higher soil temperatures (Stone et al., Reference Stone, Sorensen and Jamieson1999). The field experiments of Chen et al. (Reference Chen, Zhang and Pei2007) indicated that straw mulching hindered the recovery of soil temperature in the spring in the NCP. Plant density affects the growth of crop roots (Muoneke et al., Reference Muoneke, Ogwuche and Kalu2007). Increasing plant density could improve maize yield (Antonietta et al., Reference Antonietta, Fanello, Acciaresi and Guiamet2014; Tollenaar and Lee, Reference Tollenaar and Lee2002) and WUE (Liu et al., Reference Liu, Bu, Zhu, Luo, Chen and Li2014). To compensate for the adverse effects of simple straw mulch on the growth of winter wheat, this study adopted a higher crop density combined with maize-straw mulch. The primary objective of this study was to determine the combined effects of maize-straw mulching and crop density on soil evaporation, soil water content, ET, soil temperature, leaf area index (LAI), biomass, yield, and WUE of winter wheat. This research could be helpful to improve the WUE of winter wheat on the NCP.
Materials and Methods
Experimental site and design
The field experiment was carried out at Luancheng Experimental Station of the Chinese Academy of Sciences (37°50′ N, 114°40′ E). The elevation of Luancheng Station is 50.1 m. The average annual air temperature is 12.2 °C (Chen et al., Reference Chen, Zhang and Pei2007). The experimental field (Figure S1) was divided into 24 zones, and every zone had an area of 30 m2 (6 m × 5 m). The test crop was winter wheat (Triticum aestivum L.) that was sown on 5 October 2012. The row distance of seeding was 15 cm. Urea was applied at 262.5 kg ha−1 as a basic fertilizer. The experiment included two crop densities. One was the normal crop density (150 kg ha−1) on the left 12 zones and the other was the high crop density (225 kg ha−1) on the right 12 zones. Each crop density was divided into three different mulching levels (low mulch, high mulch, and no mulch). Maize stalks were cut into small pieces of 5 to 10 cm and placed in the winter wheat field. The amounts of straw mulch were 3000 kg ha−1 (low mulch) and 6000 kg ha−1 (high mulch). Therefore, there were six treatments in the field experiment: normal crop density combined with high mulch (NDHM); normal crop density with low mulch (NDLM); normal crop density with no mulch (NDNM); high crop density with high mulch (HDHM); high crop density with low mulch (HDLM); and high crop density with no mulch (HDNM). Each treatment had four replications. All the treatments received irrigation three times: 63.3 mm on November 18 (overwintering stage), 80.0 mm on April 16 (jointing stage), and 66.7 mm on May 6 (flowering stage). The growth stages of winter wheat were determined by field surveys.
Measurement and sampling
Micro-lysimeters (MLSs) were used to measure soil evaporation for all treatments. The MLS was made of PVC tubes with a wall thickness of 3 mm. The length of the PVC tube was 15 cm, and the internal diameter of the PVC tube was 10.4 cm. Each treatment had four MLSs. The frequency of soil replacement was 3 days, and soil was replaced immediately after every rain and irrigation event. Each time, the MLS was pressed into the soil, leaving 0.5 cm exposed to the ground, and then the MLS containing the undisturbed soil column was removed. The excess soil at the bottom was cut off, the bottom was sealed with polyethylene tape, and the MLS was weighed with an electronic balance with an accuracy of 0.1 g every day. Finally, the daily evaporation was obtained according to the weight difference between two successive days and the bottom area of the MLS.
The measurement of soil evaporation for different treatments began in late October. The soil evaporation data of 10, 18, and 5 days were measured in April, May, and June, respectively. A sunny day was selected from each growth stage (jointing stage, filling stage, and maturation stage) to measure daily variation of soil evaporation by weighing MLS every 2 h from 8:00 to 18:00. There was no fog on April 21, and there was a small amount of dew in the morning. There was a heavy fog on the morning of May 11, and there was a large amount of dew on the morning of May 30.
The soil water content (θ) was measured by the oven drying method. To determine the reduction of soil water (ΔW) in the profile between October and June, the soil water contents in the 0–210 cm soil layer were measured with 10 replications for every treatment. Total ET was calculated from the field moisture balance equation:
 $$ET = P + I + \Delta W$$
where ET (mm) is total water use (evapotranspiration) during the duration of crop growth; P (mm) and I (mm) represent precipitation and irrigation, respectively; and ΔW (mm) is the reduction of soil water storage during the calculation period.
The soil temperature at 0, 5, and 10 cm soil depths under the different mulching treatments was measured by an optical system every hour. Optic is an automatic soil temperature measurement system. Due to the small number of test instruments, the test only measured the soil temperature at 0, 5, and 10 cm soil depths for HDHM, HDLM, and the control (HDNM) treatments. A day was selected from each growth stage of winter wheat to analyse the daily variation in soil temperature: October 14 (seedling stage), November 22 (overwintering stage), March 3 (reviving stage), April 21 (jointing stage), and May 11 (filling stage). Soil temperature sum in the whole crop cycle for different high crop density treatments was also analyzed.
During the crop cycle of winter wheat, the leaf area of the sampled plants was measured. The length and width of each leaf were measured by a ruler. The leaf area was calculated by the following equation: leaf area = length × width × leaf area coefficient. In general, the leaf area coefficient of winter wheat is 0.83 (Lei et al., Reference Lei, Luo, Yang and Hu1999). The LAI was calculated by the following equation (Bu et al., Reference Bu, Liu, Zhu, Luo, Chen, Li, Hill and Zhao2013): LAI = leaf area (m2 plant−1) × plant density (plants ha−1)/10,000 (m2 ha−1). At the middle and late growth stages of winter wheat, the leaf area of 10 plants was measured every 10 days. For the dry biomass of winter wheat, we used the drying method to test the biomass of stems, leaves, and spikes at the stages of jointing, filling, and maturing. For each treatment, 10 representative wheat plants were selected. The aboveground parts of winter wheat were cut and weighed. Then, the samples were placed in a 105 °C oven to dehumidify for 0.5 h. Next, the samples were dried to a constant weight in an oven at 80 °C. Finally, they were cooled and weighed, and we obtained the weight of dry biomass.
In July, the winter wheat ripened. We made a real area-based yield determination. The actual area that was harvested per plot was 30 m2. All grains for every zone (corresponding to every replication of a treatment) were harvested for yield determination. The wheat ears were sun-dried and threshed, and the weight of the grain was measured.
WUE was calculated according to the literature (Chen et al., Reference Chen, Liu, Tian, Wang, Li, Wang and Wang2015; Li et al., Reference Li, Bian, Liu, Ma and Liu2015; Sadras and Lawson, Reference Sadras and Lawson2013):
 $$WUE = {Y \over {10ET}}$$
where WUE (kg m−3) is the water use efficiency of winter wheat; Y (kg ha−1) is the dry yield of winter wheat; and ET (mm) is evapotranspiration.
Statistical analysis
Except for precipitation and irrigation, analysis of variance (ANOVA) was performed to determine significant differences among different treatments using SPSS software. The Levene test at 5% level was used to test the homogeneity of the variance, which was an important prerequisite for ANOVA. The least significant difference (LSD) at the 5% level was used in the multiple comparisons.
Results and Discussion
Soil evaporation
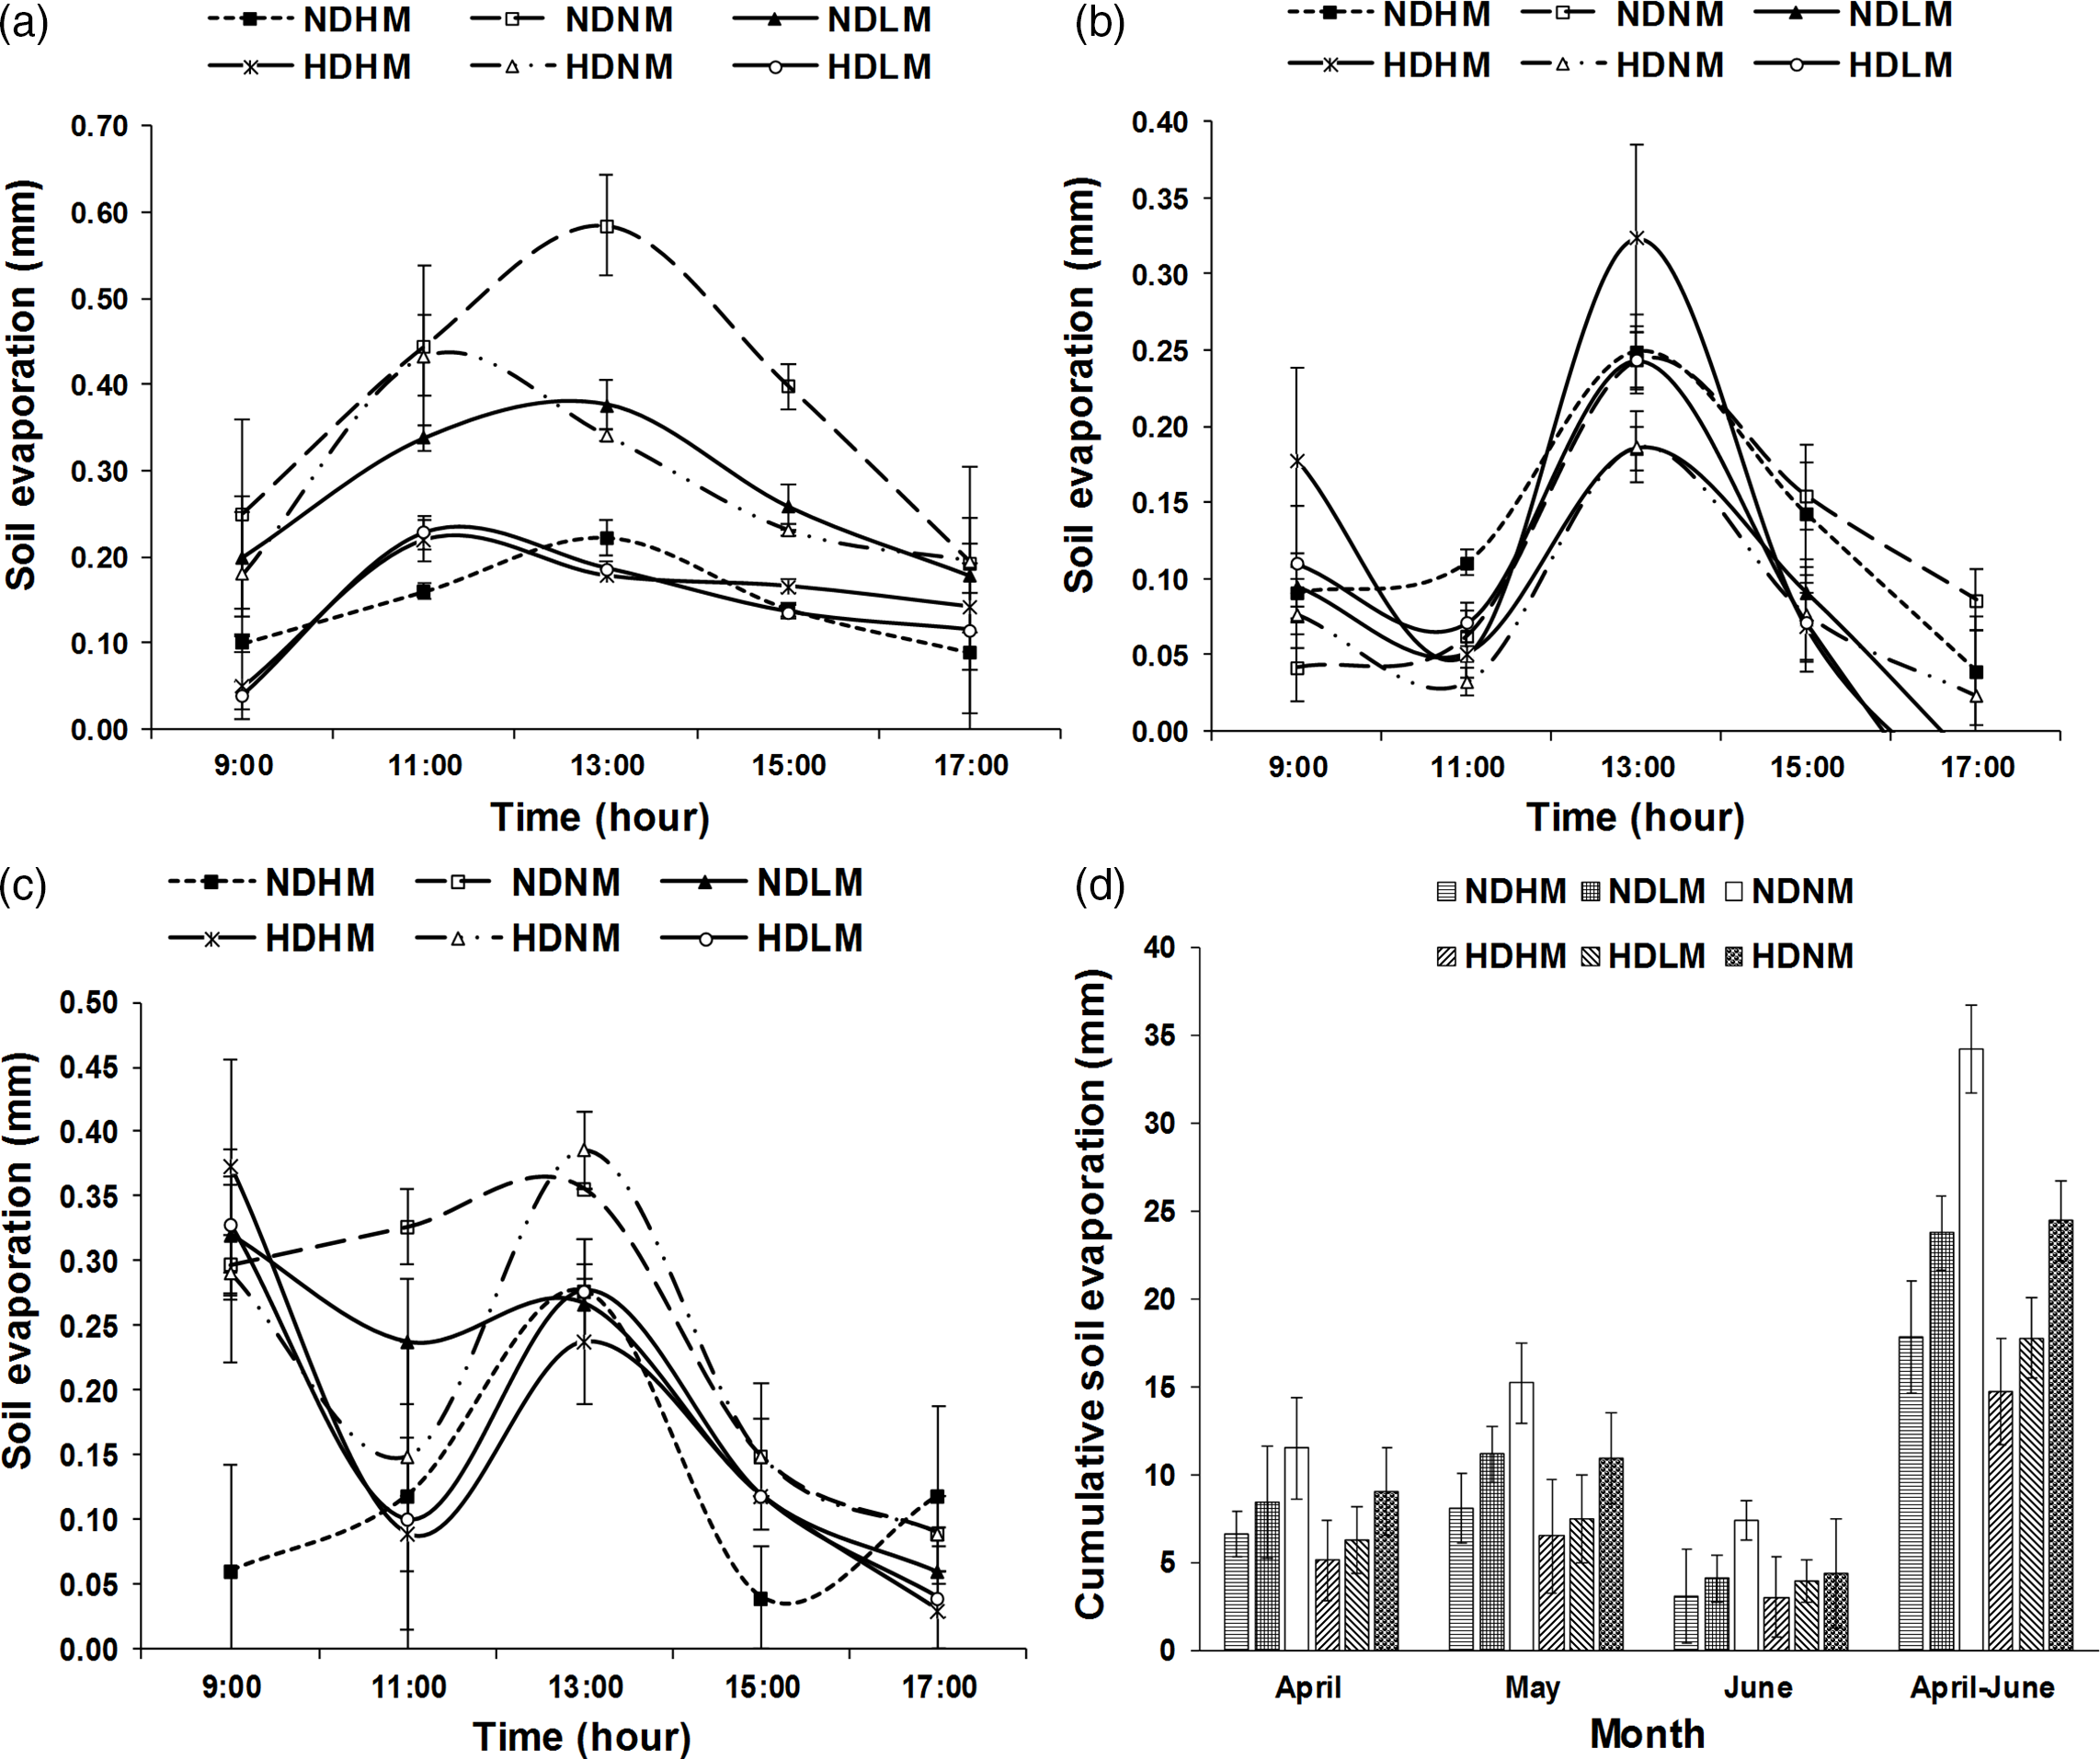
The peaks of soil evaporation appeared between 12:00 and 14:00 (Figure 1a, b), during which the highest temperature and the strongest solar radiation occurred. The results showed that soil evaporation was mainly affected by solar radiation and temperature. On the mornings of April 21 and May 30, we observed dew on the leaves and soil. On April 21, the peaks of soil evaporation for the high crop density treatments were 2 h ahead of normal crop density (Figure 1a). The primary reasons for this difference could be that in the morning, the high crop density treatments condensed more dew than normal crop density, which increased the water content of the soil surface. The dew evaporated before 11:00, resulting in the highest soil evaporation between 10:00 and 12:00. On May 11, the evaporation of condensed water from the soil surface at approximately 9:00 was higher than that at approximately 11:00 (Figure 1b) due to the influence of heavy fog, which was observed before 10:00 in the morning. On the evening of May 11, the soil evaporation of the three mulching treatments was negative (Figure 1b), which was mainly because there was high air humidity and some of the water condensed on straw mulch. On May 30, the soil evaporations at approximately 9:00 were close to those at approximately 13:00 except for the NDHM treatment and were much higher than those at 11:00 except for the NDHM and NDNM treatments (Figure 1c) because large amounts of dew on the soil surface evaporated before 9:00.
Daily variation of soil evaporation for winter wheat under different mulching and crop density methods on April 21 (a), May 11 (b), and May 30 (c), 2013, and effects of mulching and crop density on cumulative soil evaporation during the different months of winter wheat (d). Values are means ± SE (n = 4), and bars show one standard deviation on either side of the mean.

Mulching treatments decreased cumulative soil evaporation significantly compared with no mulch (Figure 1d), which could be related to the obvious effects of mulching on preventing soil evaporation. Zhang et al. (Reference Zhang, Chen and Liu2005) also showed that mulching could improve water permeability and water storage, causing evaporation reduction. High straw mulching was more effective in inhibiting soil evaporation than low mulching (Figure 1d). Straw mulching can reduce the radiation and wind speed reaching the soil surface, cut off the capillary contact between the evaporation surface and the low layer soil, and weaken the turbulent exchange intensity between the soil air and atmosphere (Wang et al., Reference Wang, Zhang, Dawes and Liu2001). The field experiments in the NCP also indicated that on the basis of daily measurements by MLSs, soil evaporation decreased by 21% for less mulching and 40% for more mulching compared with the control (Chen et al., Reference Chen, Zhang and Pei2007). The cumulative soil evaporation was similar for NDLM and HDNM (Figure 1d), indicating that high crop density and mulching had a similar effect of inhibiting evaporation. Differences in cumulative soil evaporation among different mulching treatments of high crop density were less than those of normal crop density (Figure 1d). The reason was that the canopy coverage or leaf area of winter wheat for the high crop density treatment was greater than that for the normal crop density treatment. The high LAI had a similar effect on inhibiting soil evaporation as mulching.
Soil water content and ET
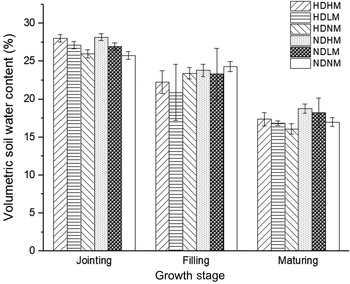
From the jointing stage to the maturation stage, θ in the 0 ˜ 10 cm soil layer decreased gradually for all treatments (Figure 2), because soil evaporation and plant transpiration depleted some of the soil moisture during the three growth stages. During the jointing and maturation stages, maize-straw mulching increased θ compared with no mulching (Figure 2), which could be attributed to the high water-holding capacity of straw mulching (Chen et al., Reference Chen, Zhang and Pei2007). The high water-holding capacity could be the combined effect of poor exchange with the atmosphere, low temperature, and shading of the mulch layer. Wang et al. (Reference Wang, Zhang, Gong, Xu, Juan and Zhao2018) also pointed out that straw mulching effectively conserved soil moisture. During the three stages, the θ values for the high crop density treatments were less than those for the corresponding normal crop density treatments (Figure 2). The reason was that from the jointing stage, ET was dominated by plant transpiration. The transpiration rates of the high crop density treatments were higher than those of the normal crop density treatments; therefore, crop density had obvious effects on ET (Tables 1 and 2). The combination of mulch and crop density produced different ETs (Table 2). Evaporation is often regarded as a nonproductive component of ET, while the water used for transpiration is the productive component of ET (Singh et al., Reference Singh, Eberbach, Humphreys and Kukal2011). The HDLM treatment gave a higher ET than the NDHM and NDLM treatments (Table 2), because the LAI of the high crop density was greater than that of the normal crop density.
Effects of mulching and crop density on average volumetric soil water content (0–10 cm) over time during the different growth stages of winter wheat. Bars show one standard deviation on either side of the mean.

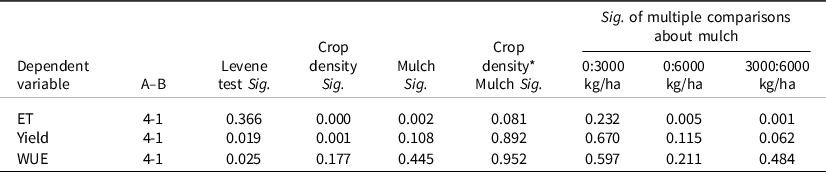
Two-factor analysis of variance in ET, Yield, and WUE

ET: evapotranspiration; WUE: water use efficiency; A: the number of replicates of a treatment; B: the number of measurements.
Effects of mulching and crop density on the total evapotranspiration, dry yield, and water use efficiency of winter wheat

ΔW, the reduction of soil water; P, precipitation; I, irrigation. The different lowercase letters indicate significant differences among treatments.
Soil temperature
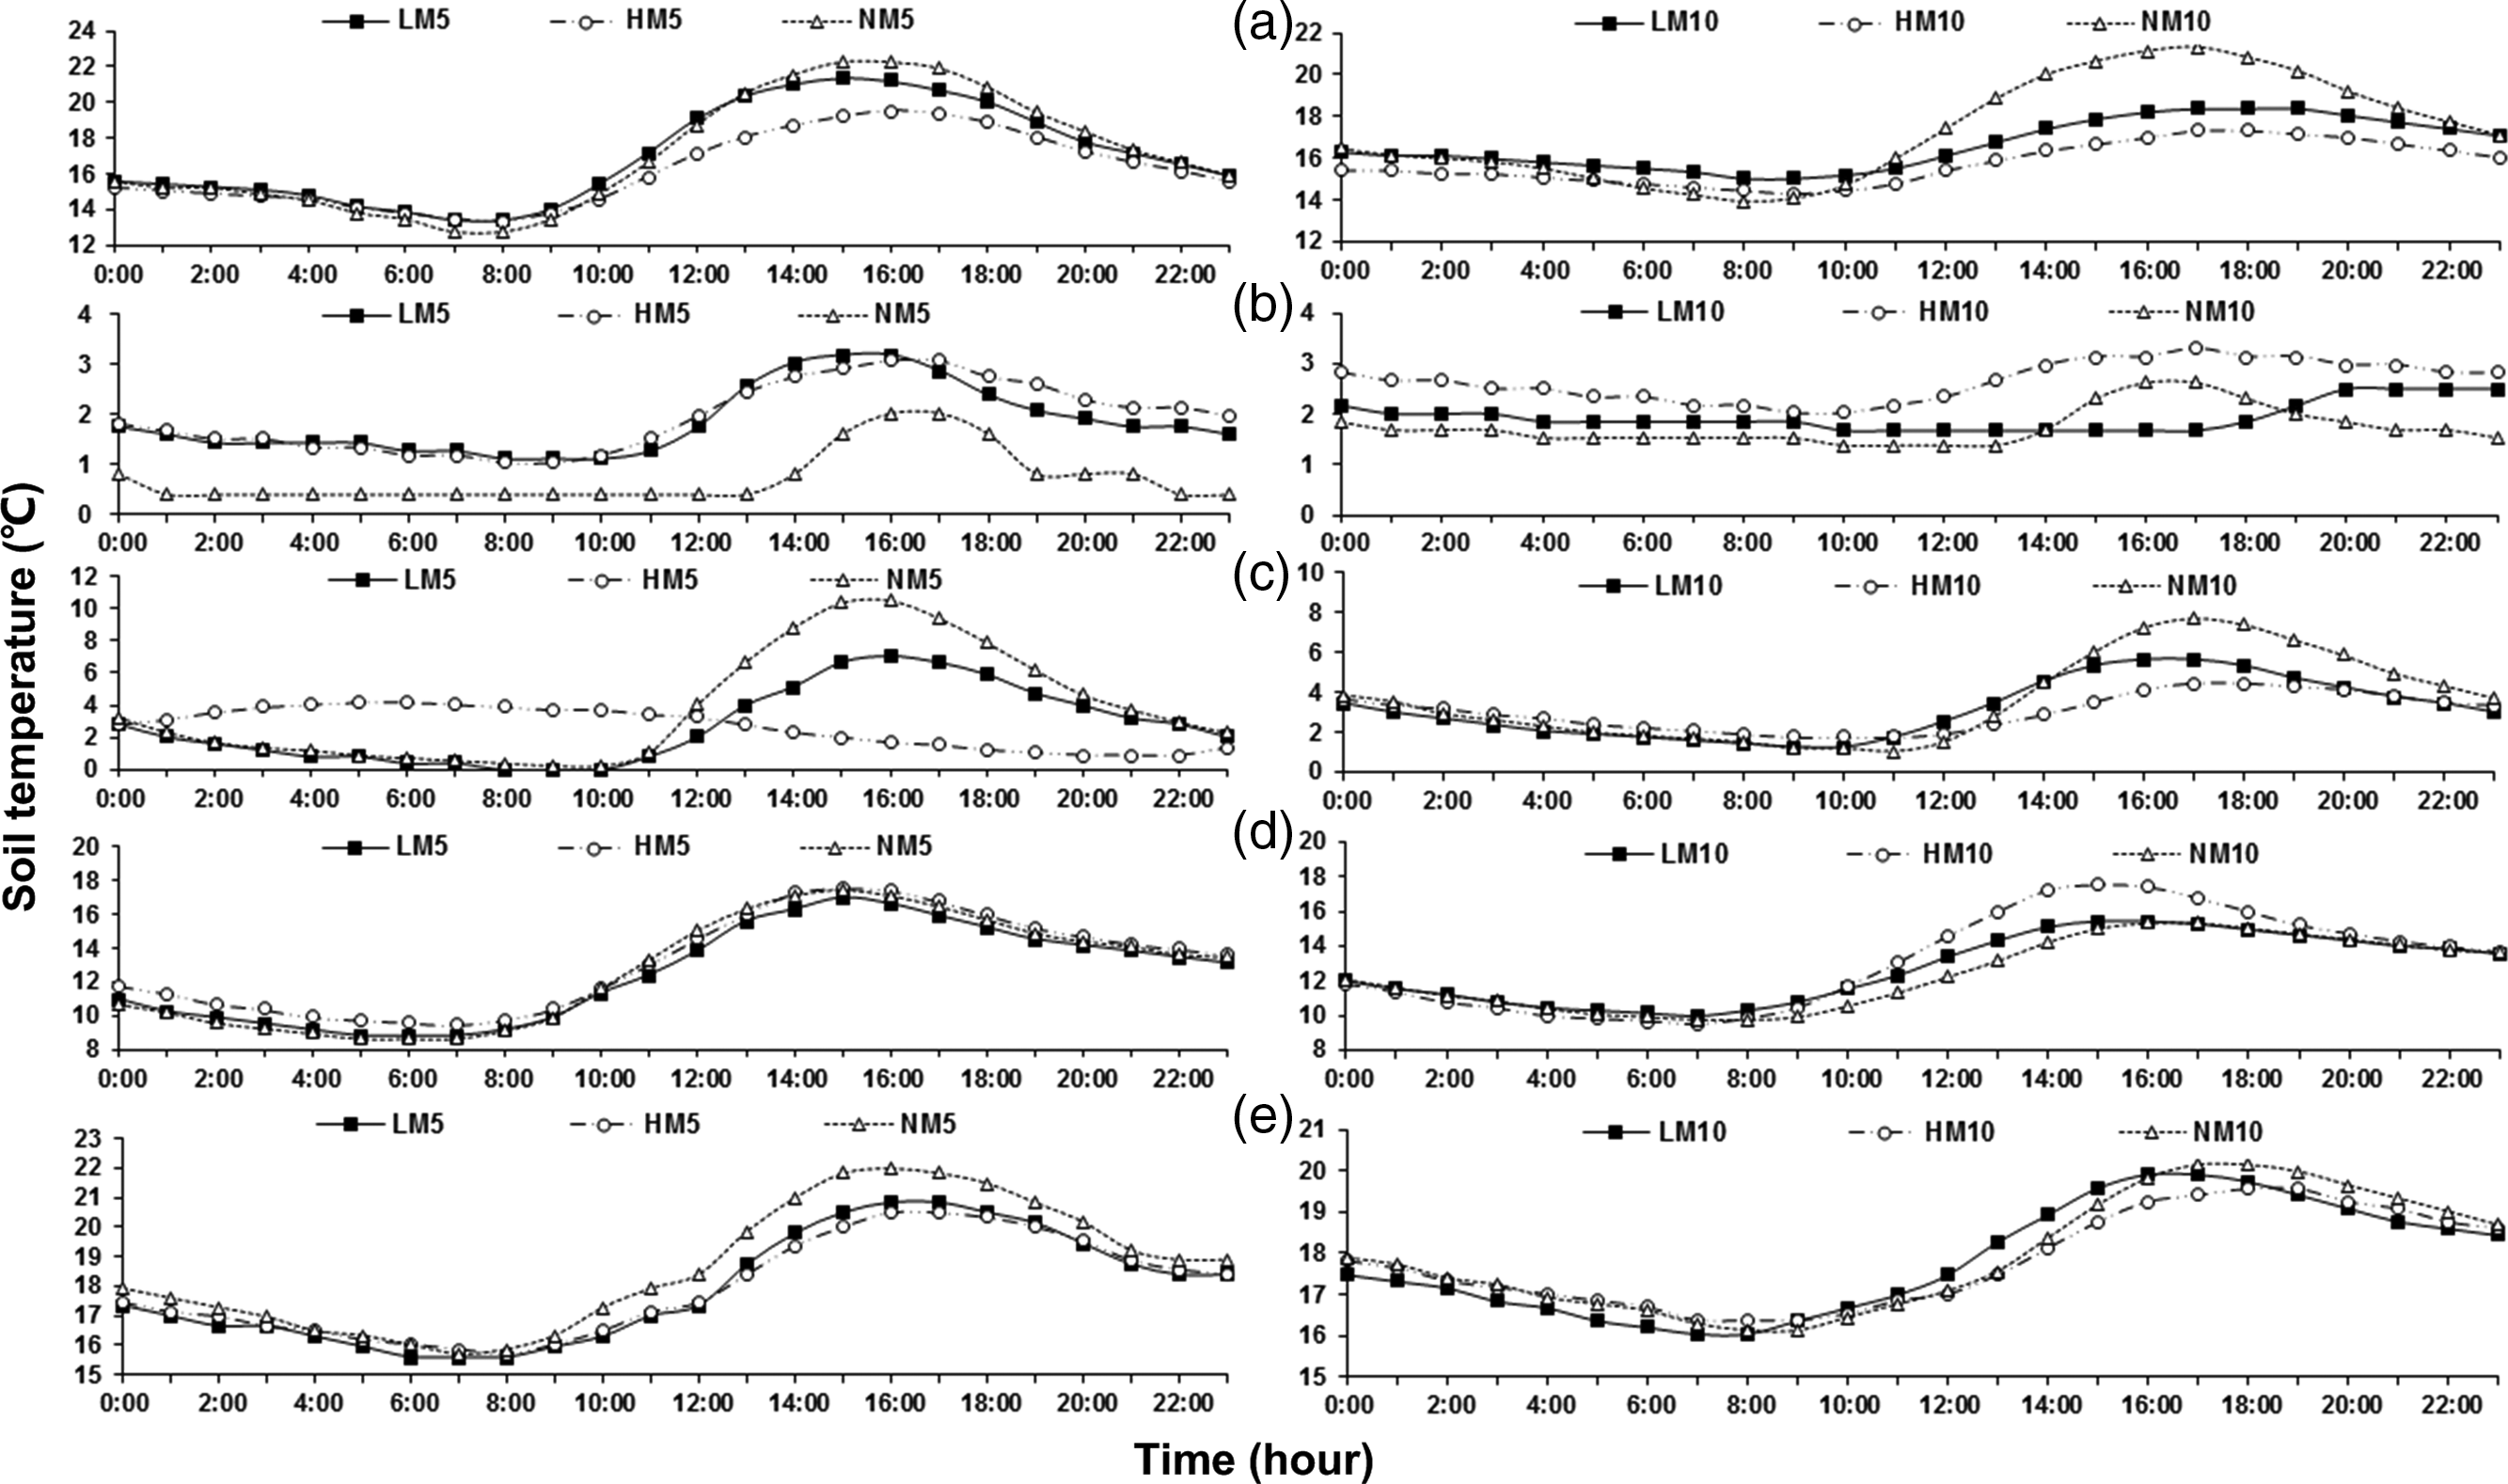
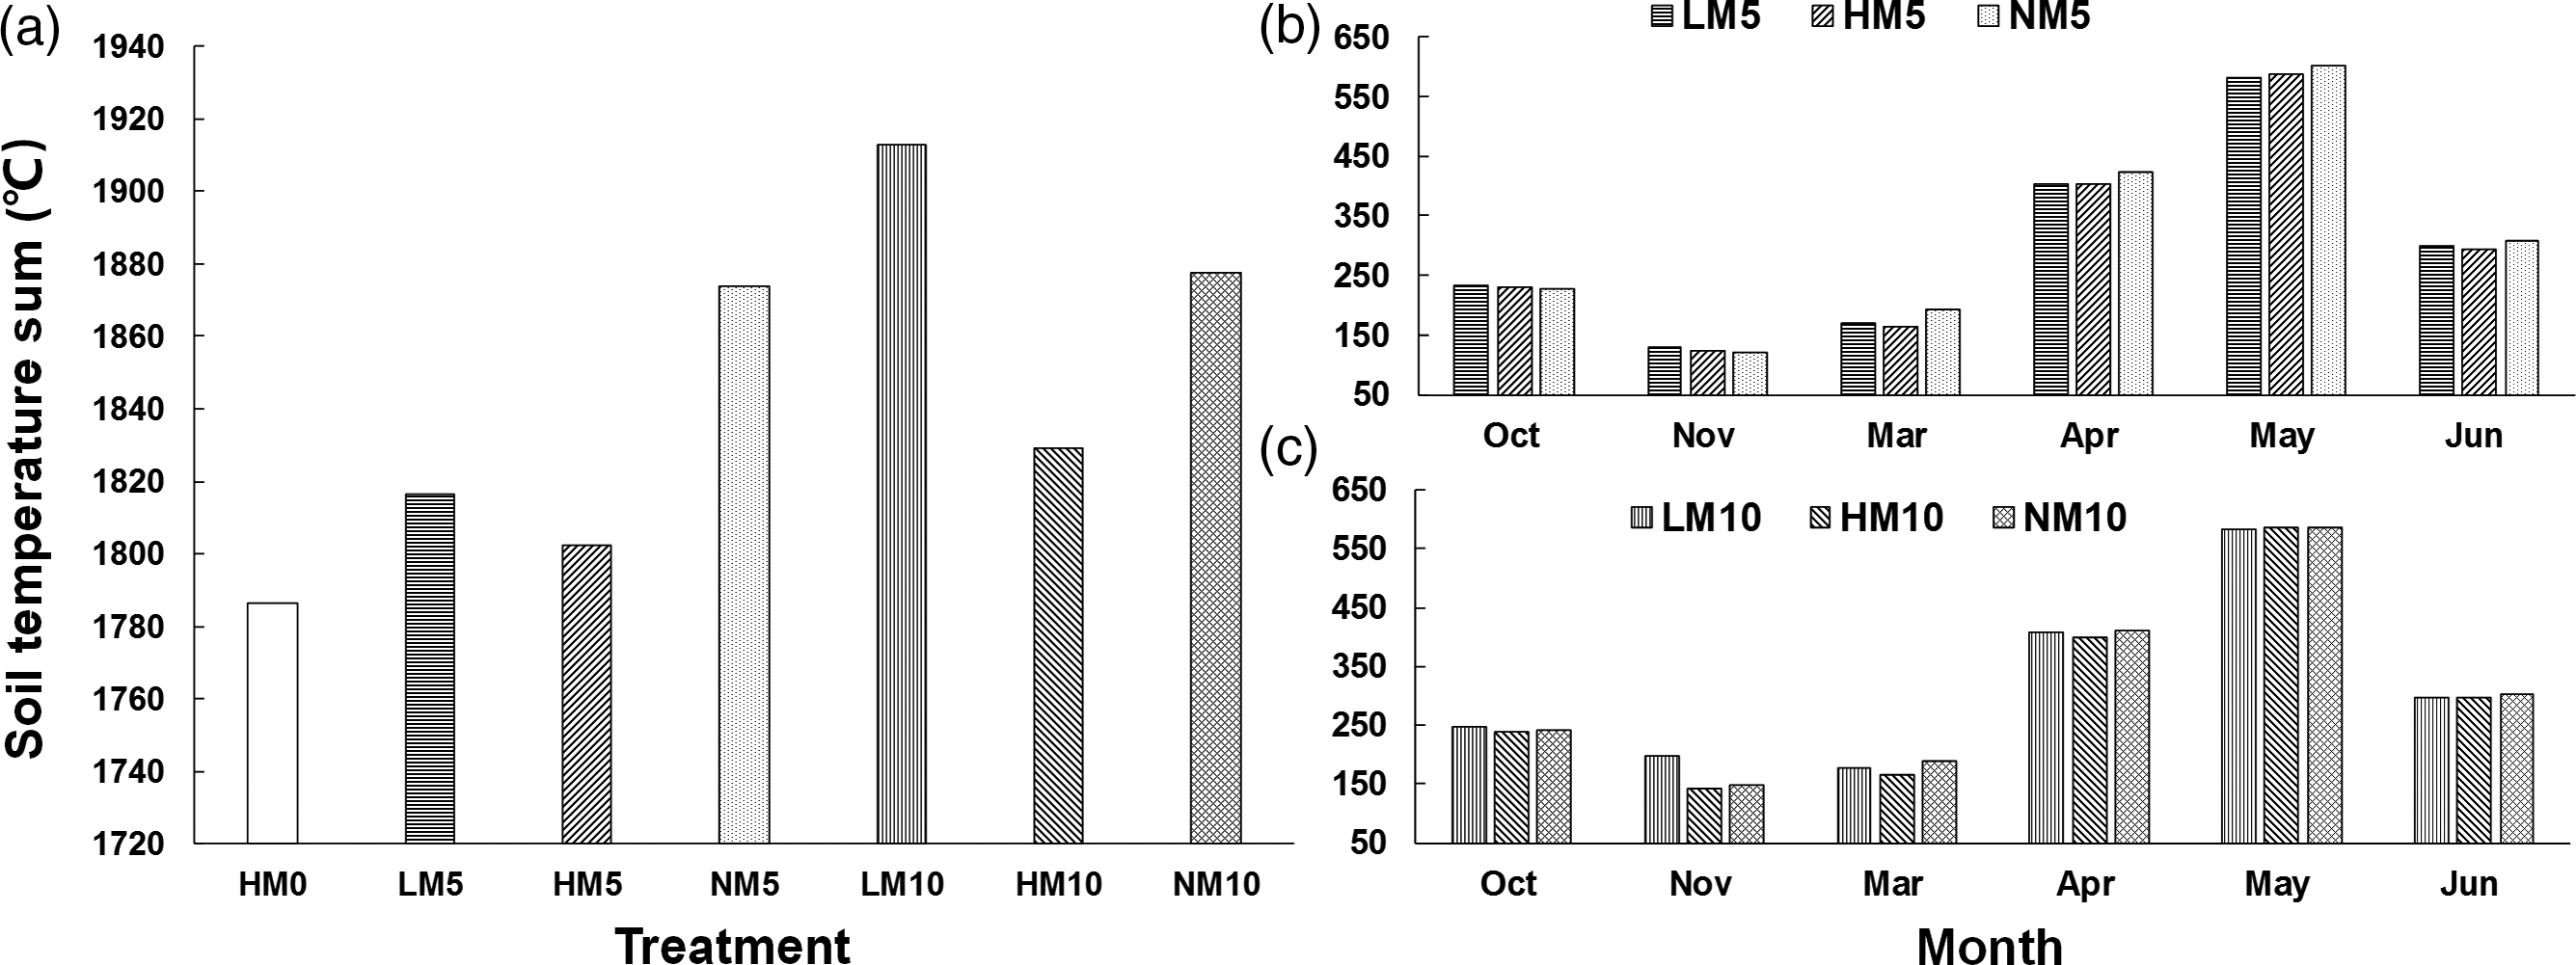
The effect of straw-mulch on soil temperature was most obvious during the stages of early overwintering and reviving (Figure 3b, c), but straw mulching had only a limited effect during later growth stages (Figure 3d, e). The highest soil temperature occurred for the high mulching treatment in the overwintering stage and jointing stage (Figure 3b, d). However, straw mulch reduced the soil temperature in autumn and early spring (Figures 3a, c and 4b, c), which led to a delay in the development of winter wheat in early spring. Hence, the decrease in soil temperature was harmful to the normal growth of winter wheat during the reviving stage. Badaruddin et al. (Reference Badaruddin, Reynolds and Ageeb1999) also indicated that soil temperatures decreased under mulch before full ground cover occurred, which resulted in the delay of the crop cycle. The effect of mulching on soil temperature at the 10-cm soil depth was smaller than that at the 5-cm soil depth, which indicated that the cooling effect of mulching mainly occurred in the 0–5 cm soil layer.
Daily variation in soil temperature at two soil depths (5 cm and 10 cm) for winter wheat under different mulching methods on October 14 (a), November 22 (b), 2012, March 3 (c), April 21 (d), and May 11 (e), 2013. Abbreviations: LM, low mulch; HM, high mulch; NM, no mulch; 5, at 5 cm soil depth; 10, at 10 cm soil depth.

Effects of different straw mulch treatments on soil temperature sum at 0, 5, and 10 cm soil depths from October to June (a) and effects of straw mulch on soil temperature sum at 5 cm (b) and 10 cm (c) soil depths during the different months of winter wheat. Abbreviations: LM, low mulch; HM, high mulch; NM, no mulch; 0, on the soil surface; 5, at 5 cm soil depth; 10, at 10 cm soil depth.

The soil temperature sum at the 10-cm soil depth from October to June (a total of 156 days) for low mulch was the highest among all treatments (Figure 4a), which was good for root growth of wheat and may be one of the reasons for the high yield produced with the low-mulch treatment. Whether at the 5-cm soil depth or the 10-cm soil depth, the soil temperature sum for the high-mulch treatment was the lowest (Figure 4a), which was not conducive to the normal growth and high yield of winter wheat. The variation in soil temperature with mulch treatment was gentler than that with no-mulch treatment (Figure 3), which could be attributed to the fact that in a winter wheat field, mulch enhanced soil temperature in winter and reduced soil temperature in spring compared with no mulch (Chen et al., Reference Chen, Zhang, Hu and Liu2004). On October 14, compared with the control, the times of maximum temperature at 5 cm and minimum soil temperature at 10 cm for the high-mulch treatment in 1 day were both delayed by 1 h (Figure 3a), which indicated that the high-mulch treatment had a delaying effect on the temperature variation. For every treatment, the time of maximum soil temperature at the 10-cm soil depth was approximately 17:00 in the afternoon, which was 2 h later than that at the 5-cm depth (Figure 3a). This illustrated that the deeper the soil depth, the greater the lag of the variation in soil temperature.
LAI, biomass, yield, and WUE
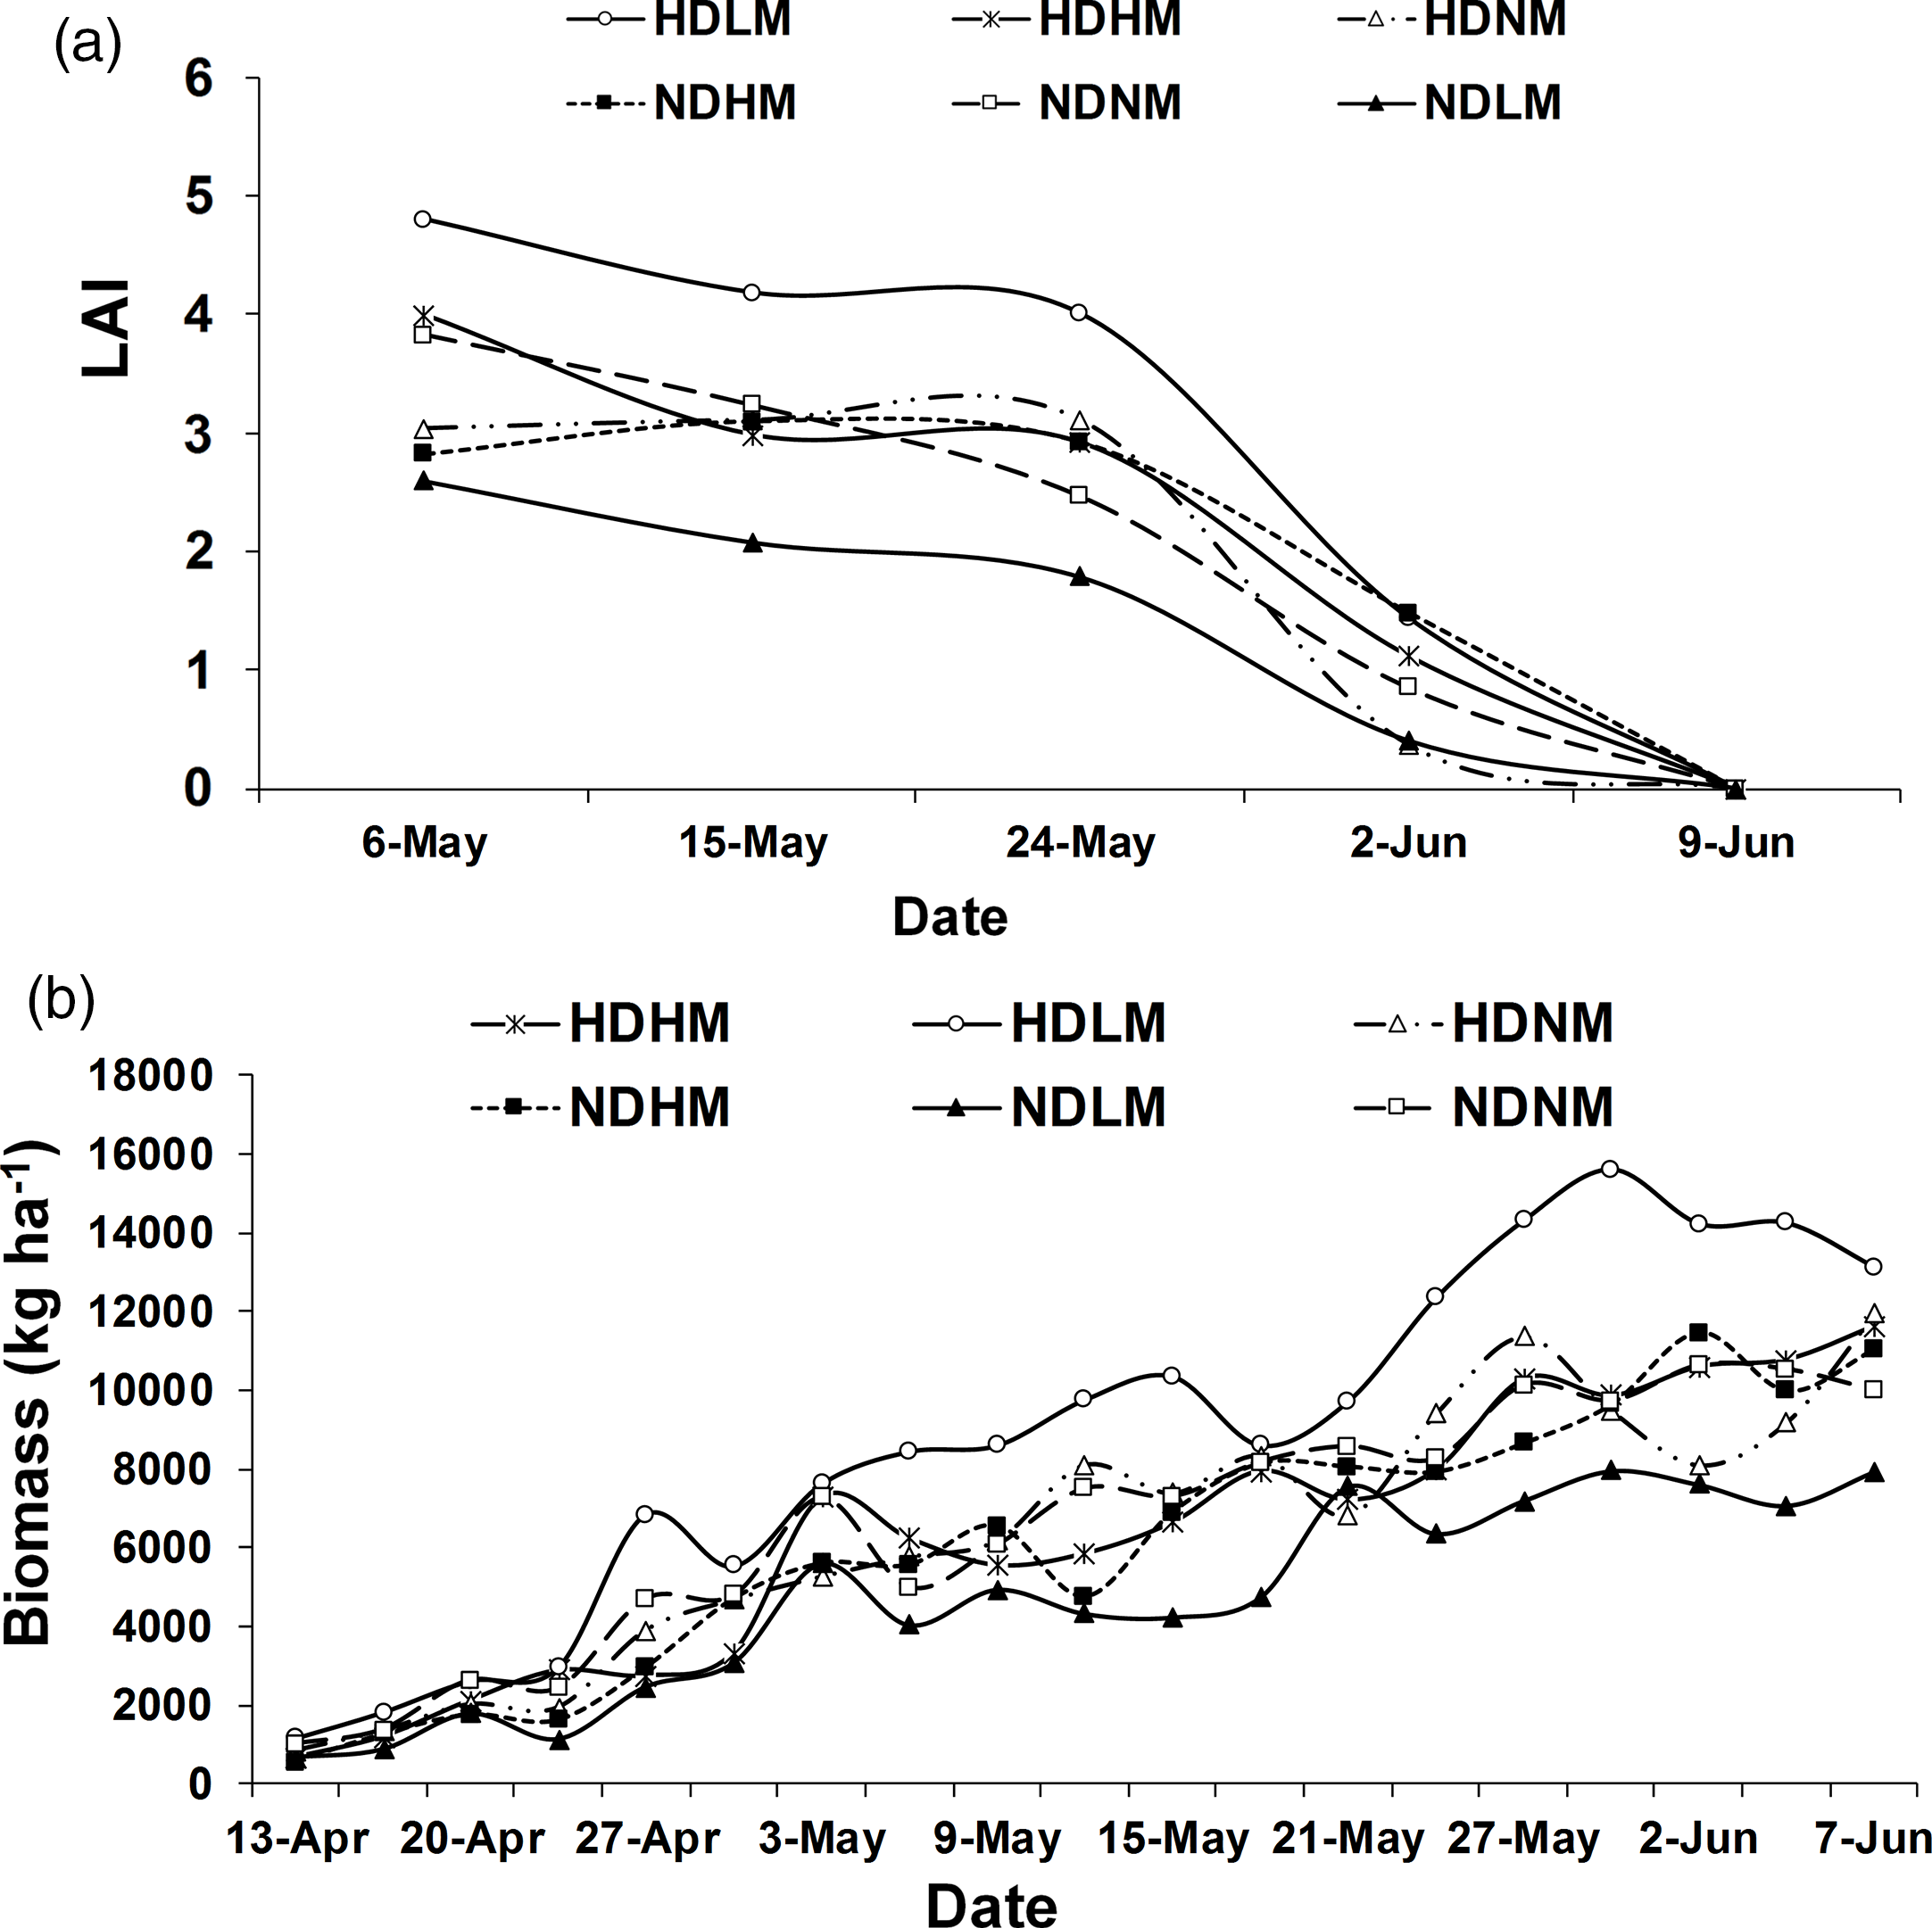
After May 24, the LAI dropped sharply (Figure 5a). This indicated that LAI began to decline from the flowering stage of winter wheat and rapidly decreased in the late grain filling and maturation stage. HDLM had the highest LAI (Figure 5a), which indicated that HDLM was most conducive to the growth of winter wheat. The higher the LAI was, the more favorable it was to inhibit soil evaporation. Taking May 24 as an example, the LAI values for HDLM, NDLM, and NDNM were 4.0, 1.8, and 2.5, respectively (Figure 5a). The LAI for HDLM was more than twice as high as that for NDLM and was 60% higher than that for NDNM. Zhao et al. (Reference Zhao, Shen, Lang, Liu and Li2013) showed that the vertical distribution of the LAI of winter wheat could be improved by changing the conventional cultivation pattern into a wide-precision planting pattern. In the winter wheat canopy, the photosynthetically active radiation penetration ratio could be reduced by a high LAI (Li et al., Reference Li, Bian, Liu, Ma and Liu2015), which would reduce soil evaporation.
Effects of mulching and crop density on the leaf area index (LAI) (a) and biomass (b) of winter wheat.

From April 13 to June 1, HDLM gave the highest biomass (Figure 5b), indicating that the growth of winter wheat for HDLM was the best. Under the same conditions of high crop density, the low-mulching treatment produced higher biomass compared with the no-mulching treatment (Figure 5b), because straw mulch could reduce soil evaporation and increase plant transpiration (Raeini-Sarjaz and Barthakur, Reference Raeini-Sarjaz and Barthakur1997). The biomasses for NDHM and HDHM were both less than those for NDNM and HDNM (Figure 5b), which indicated that the growth of winter wheat for high mulch was worse than that for no mulch. This could be related to the fact that high mulch reduced the soil temperature sum of winter wheat.
Compared with NDHM, HDNM increased yield by 1203.9 kg ha−1 (34.5%). Compared with NDNM, HDLM increased yield by 791.9 kg ha−1 (20.6%). Therefore, the effects of crop density on yield was significant (Table 1). The reason for the low yield of the high-mulch treatment was that the excessive mulching of maize straw seriously hindered the rebound of soil temperature in early spring, leading to the phenomenon of a lack of seedlings, postponing the reviving stage of wheat and hindering the normal growth of winter wheat. Chen et al. (Reference Chen, Zhang and Pei2007) also reported that although mulch significantly reduced soil evaporation, lower soil temperature for mulch was the main factor resulting in the reduction of yield in some cases. Compared with NDHM and NDNM, HDLM enhanced WUE by 25.4% and 21.9%, respectively. HDNM gave a higher yield than HDLM, whereas HDNM produced a lower WUE than HDLM (Table 2). Huang et al. (Reference Huang, Chen, Fu, Huang and Gong2005) reported that straw mulch could reduce ET and improve WUE.
Two-factor ANOVA
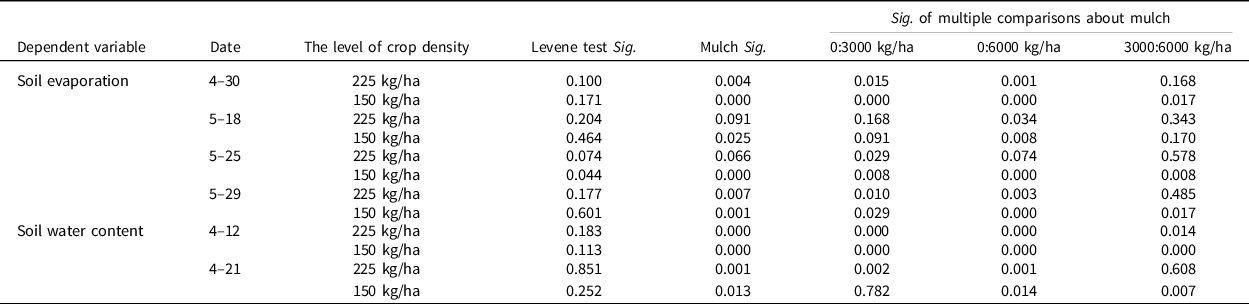
The significant levels of ET and yield for crop density were less than 0.05 (Table 1). Therefore, crop density had obvious effects on these parameters. Likewise, both crop density and mulching had obvious effects on soil evaporation at jointing and filling stage for most of the time, while the interactions were not significant (Table 3). There were distinct differences for soil moisture contents among the three levels of mulching only at jointing stage. When analyzing the effect of mulching on ET, the comparison of three levels of mulching showed that there was significant difference between no mulch and high mulch, and no apparent difference between no mulch and low mulch. When analyzing multiple comparisons about mulching on soil evaporation at jointing and filling stage, there were distinct differences between mulch and no mulch. Furthermore, we found that the interactions were just prominent on soil evaporation on April 30, May 18, May 25, and May 29 and soil moisture content on April 12 and April 21 (Table 4). Under a certain level of crop density (225/150 kg/ha), there was basically significant difference in mulching.
Two-factor analysis of variance in soil evaporation and soil water content

A–B of soil temperature, biomass, and LAI are 1–158, 1–19, and 1–4, respectively.
Analyze the significance level of mulch and multiple comparisons under certain level of crop density in the measurement of significant interaction

Conclusions
Straw mulching had a significant inhibitory effect on soil evaporation, and high mulch was more effective in inhibiting soil evaporation than low mulch. High crop density had a similar effect of inhibiting soil evaporation as straw mulching. Compared with no mulch, straw mulch reduced the soil temperature in the spring and increased the soil temperature in the autumn and winter. The low-mulch treatment gave the highest soil temperature sum at the 10-cm soil depth. High crop density treatments gave higher yields than normal crop density. Compared with NDNM, the yield and WUE of winter wheat for HDLM were enhanced by 20.6% and 21.9%, respectively. The reason why the high-mulch treatment had a low yield was that the excessive straw mulch seriously hindered the rebound of soil temperature in the early spring. Among all the experimental groups, the WUE of HDLM was the highest, which could also be attributed to its high LAI and biomass. From the perspective of improving WUE and the relatively high yield of winter wheat, high crop density combined with low mulch (HDLM) treatment should be advocated in the NCP.
When farmers apply mulching in their winter wheat fields, it is recommended to avoid excess mulch and keep the amount of mulching less than 3000 kg ha−1, and try to choose varieties insensitive to the low temperature, or avoid mulching on March. After entering the jointing stage, the amount of mulch may be increased properly to minimize soil evaporation. In addition, high crop density should be adopted at a sowing rate 225 kg ha−1.
In the future research, when to apply mulching should be studied to determine the best timing to reduce stress of low temperature. The combined effects of crop density and row spacing are also interesting. In the NCP, the straw was covered in the previous year and then returned to the field by ploughing in the following year. Then, what effect did the crop density combined with the straw return to the field? What about the long-term effect? What about other crops? Will the type of mulch affect the results? Therefore, the objectives of future research should focus on how to mulch timely and appropriately together with the economic crop density to promote crop growth and improve WUE.
Acknowledgements
This work was financially supported by the National Natural Science Foundation of China (31270748 and 31470707), Hubei Key Laboratory of Water System Science for Sponge City Construction (Wuhan University) (2020-05), and the Shenzhen Science and Technology Project (JCYJ20150331160617771 and JC201005280681A).
Supplementary Material
To view supplementary material for this article, please visit https://doi.org/10.1017/S0014479721000119