Introduction
Over the past 30 years, the neurodevelopmental model of schizophrenia has become a dominant theoretical framework for organizing findings and generating hypotheses related to psychosis pathogenesis. The premise of the model is that an individual's sensitivity to certain inputs (e.g. teratogens, perinatal complications, adverse childhood experiences) and the likelihood of expressing certain clinically significant outputs (e.g. disorganized behavior, hallucinations) are modulated by the individual's brain maturation, genetic makeup, changes in gene expression across development, and/or epigenetic influences, particularly during adolescence (Insel, Reference Insel2010; Murray & Lewis, Reference Murray and Lewis1987; Owen, O'Donovan, Thapar, & Craddock, Reference Owen, O'Donovan, Thapar and Craddock2011; Rapoport, Giedd, & Gogtay, Reference Rapoport, Giedd and Gogtay2012; Weinberger, Berman, & Zec, Reference Weinberger, Berman and Zec1986). Despite the prominence of this model, differences in symptom expression as a result of these maturational changes throughout adolescent and young-adult development have not been examined thoroughly.
Consistent with the proposed model, late adolescence and early adulthood is a time of increased vulnerability for the emergence of symptoms that are associated with schizophrenia-spectrum disorders (Amminger et al., Reference Amminger, Harris, Conus, Lambert, Elkins, Yuen and McGorry2006; Öngür, Lin, & Cohen, Reference Öngür, Lin and Cohen2009). However, there is no conclusive evidence of symptomatology changing over the course of development in psychosis. If brain maturation modulates the expression of psychosis (both prevalence and severity of symptoms), it is reasonable to expect, for example, that a 12-year old's symptom expression differs from a 26-year old. Symptom expression of other psychiatric disorders, including depression and anxiety, changes across development, particularly during adolescence. Multiple studies find that the severity and/or prevalence of depression and anxiety symptoms decline in early adolescence, but increase in severity and/or prevalence in mid-late adolescence (Garber, Keiley, & Martin, Reference Garber, Keiley and Martin2002; Ge, Conger, & Elder, Reference Ge, Conger and Elder2001; Van Oort, Greaves-Lord, Verhulst, Ormel, & Huizink, Reference Van Oort, Greaves-Lord, Verhulst, Ormel and Huizink2009). There is also evidence of changes in specific anxiety symptoms throughout adolescence, with the prevalence of generalized anxiety and social anxiety increasing throughout adolescence (Costello, Mustillo, Erkanli, Keeler, & Angold, Reference Costello, Mustillo, Erkanli, Keeler and Angold2003) and panic disorder and separation anxiety symptoms decreasing between early and mid-adolescence (Hale, Raaijmakers, Muris, van Hoof, & Meeus, Reference Hale, Raaijmakers, Muris, van Hoof and Meeus2008). Similarly, distinct psychotic symptoms could follow unique developmental patterns. Understanding whether and how age varies with psychotic symptom expression could have important implications for creating developmentally-informed assessment and treatment practices, and for understanding the mechanisms underlying specific symptoms.
Previous work suggests that age plays an important role in psychosis symptom development. When positive symptoms are divided into specific sub-groups, there is evidence that perceptual positive symptoms (i.e. illusory sensory experiences such as hallucinations) are present to a greater extent in younger individuals (Mueser, Bellack, & Brady, Reference Mueser, Bellack and Brady1990), while non-perceptual positive symptoms (e.g. delusions) have greater prevalence in older individuals with psychosis (Häfner, Maurer, Löffler, & Riecher-Rössler, Reference Häfner, Maurer, Löffler and Riecher-Rössler1993). Studies of childhood- or adolescent-onset psychosis find that these youth endorse higher rates of visual hallucinations than would be expected based on the adult-onset psychosis literature (David et al., Reference David, Greenstein, Clasen, Gochman, Miller, Tossell and Rapoport2011; Green, Padron-Gayol, Hardesty, & Bassiri, Reference Green, Padron-Gayol, Hardesty and Bassiri1992). Furthermore, multiple cross-sectional studies of general population cohorts and individuals at high risk for developing psychosis report that younger individuals are more likely to endorse perceptual psychotic experiences in comparison to older individuals (Brandizzi et al., Reference Brandizzi, Schultze-Lutter, Masillo, Lanna, Curto, Lindau and Fiori Nastro2014; Kelleher et al., Reference Kelleher, Keeley, Corcoran, Lynch, Fitzpatrick, Devlin and Cannon2012b; Schimmelmann, Michel, Martz-Irngartinger, Linder, & Schultze-Lutter, Reference Schimmelmann, Michel, Martz-Irngartinger, Linder and Schultze-Lutter2015; Schultze-Lutter, Hubl, Schimmelmann, & Michel, Reference Schultze-Lutter, Hubl, Schimmelmann and Michel2017). However, investigations of age effects on total positive symptoms in chronic and first-episode psychosis fail to find differences between age groups or find significant effects of age on symptom presentation (Ballageer, Malla, Manchanda, Takhar, & Haricharan, Reference Ballageer, Malla, Manchanda, Takhar and Haricharan2005; Haas & Sweeney, Reference Haas and Sweeney1992; Joa et al., Reference Joa, Johannessen, Langeveld, Friis, Melle, Opjordsmoen and Larsen2009; Sharma, Reference Sharma1999; White, Ho, Ward, O'Leary, & Andreasen, Reference White, Ho, Ward, O'Leary and Andreasen2006). Taken together, these results suggest positive symptoms of psychosis display significant age-related variability, but it is critical to examine developmental patterns within relevant sub-groups of positive symptoms. Age effects have not yet been systematically examined in a longitudinal first-episode psychosis sample, which is less likely to be influenced by disease chronicity and medication effects.
Some investigations of developmental influences on negative symptom severity find that younger people with schizophrenia spectrum disorders showed more prominent negative symptoms (Ballageer et al., Reference Ballageer, Malla, Manchanda, Takhar and Haricharan2005; Pencer, Addington, & Addington, Reference Pencer, Addington and Addington2005). However, the majority of studies of participants across the psychosis spectrum fail to find age-associated effects on total negative symptoms (DeVylder et al., Reference DeVylder, Ben-David, Schobel, Kimhy, Malaspina and Corcoran2013; Haas & Sweeney, Reference Haas and Sweeney1992; Joa et al., Reference Joa, Johannessen, Langeveld, Friis, Melle, Opjordsmoen and Larsen2009; White et al., Reference White, Ho, Ward, O'Leary and Andreasen2006). Late adolescence and early adulthood are times where transitioning to new roles are important (e.g. starting college, beginning full-time work); thus, developmentally-focused explorations of negative symptom severity may be particularly important, as negative symptoms are more closely related to functional impairments than positive symptoms (Ho, Psych, Nopoulos, & Arndt, Reference Ho, Psych, Nopoulos and Arndt1998; Milev, Ho, Arndt, & Andreasen, Reference Milev, Ho, Arndt and Andreasen2005).
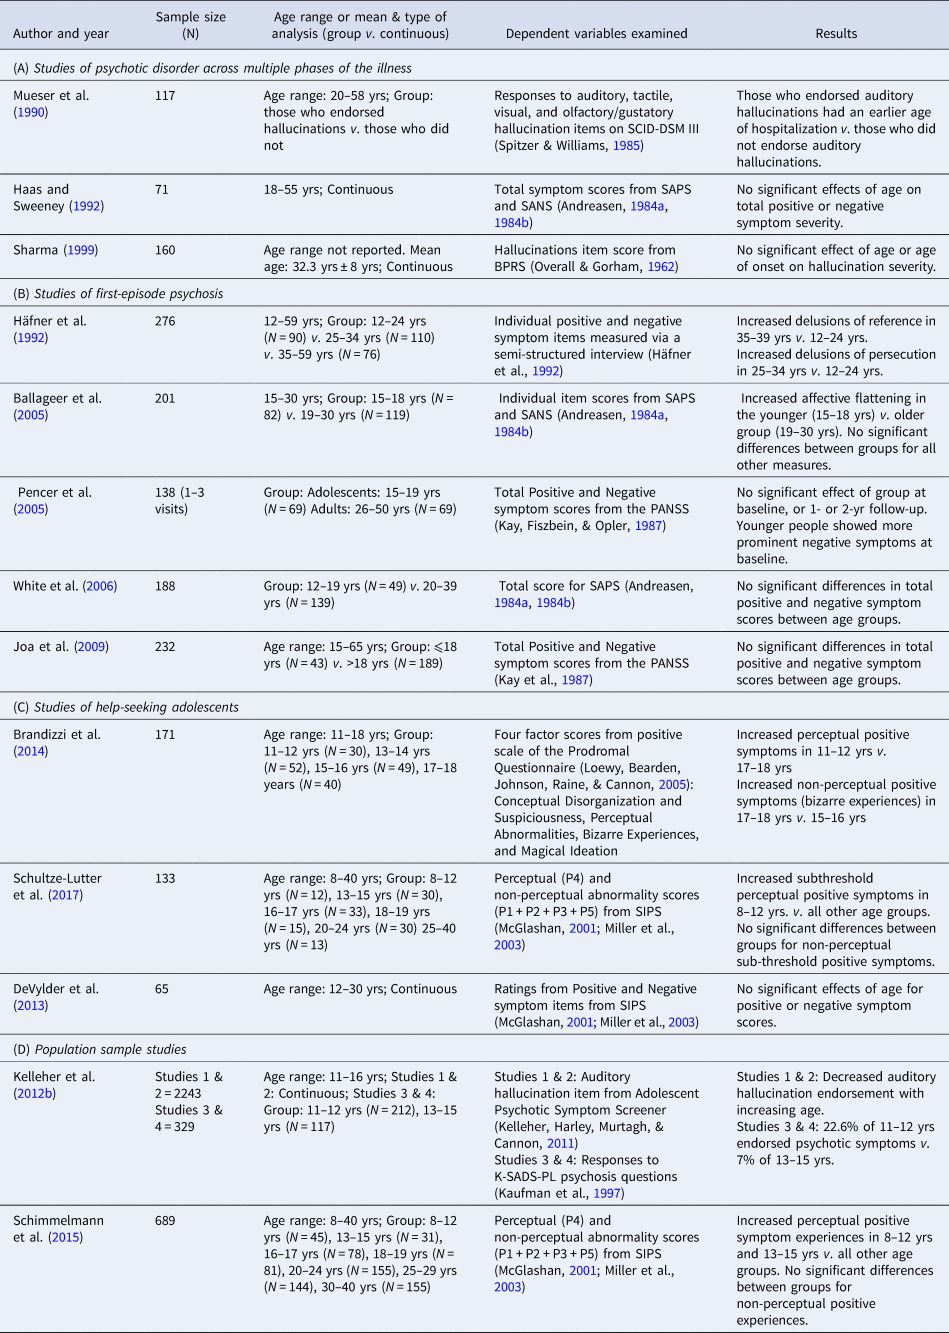
Table 1 summarizes previous investigations of age effects in symptom presentation across the psychosis spectrum. While some patterns are observed (as described above), there are also inconsistencies. Antipsychotic medication exposure may affect age-symptom associations in psychosis, as antipsychotic medications treat perceptual positive symptoms more quickly or effectively than non-perceptual positive symptoms and negative symptoms (Bjarke et al., Reference Bjarke, Sinkeviciute, Kroken, Løberg, Jørgensen, Johnsen and Gjestad2020; Fusar-Poli et al., Reference Fusar-Poli, Rocchetti, Sardella, Avila, Brandizzi, Caverzasi and McGuire2015; Gunduz-Bruce et al., Reference Gunduz-Bruce, McMeniman, Robinson, Woerner, Kane, Schooler and Lieberman2005; Lecrubier, Perry, Milligan, Leeuwenkamp, & Morlock, Reference Lecrubier, Perry, Milligan, Leeuwenkamp and Morlock2007; Schneider, Jelinek, Lincoln, & Moritz, Reference Schneider, Jelinek, Lincoln and Moritz2011). All previously published studies in those diagnosed with psychotic disorders include individuals who were currently or previously prescribed antipsychotic medications. Additionally, the majority of previous studies are cross-sectional, precluding the ability to assess within-subject change, and the statistical methods used only assessed linear relationships. Many developmental processes follow a non-linear trajectory and non-linear modeling approaches in developmental neurocognitive science have identified distinct periods of continued refinement of brain structure in typically-developing youth (Calabro, Murty, Jalbrzikowski, Tervo-Clemmens, & Luna, Reference Calabro, Murty, Jalbrzikowski, Tervo-Clemmens and Luna2020; Simmonds, Hallquist, Asato, & Luna, Reference Simmonds, Hallquist, Asato and Luna2014). Use of these approaches with longitudinal symptom data may identify distinct periods of change that are obscured in cross-sectional or linear models. Finally, given evidence that neurobiological factors exert differential influences on symptomatology at distinct points in development (Ellwood-Lowe et al., Reference Ellwood-Lowe, Humphreys, Ordaz, Camacho, Sacchet and Gotlib2018; Glaser et al., Reference Glaser, Gunnell, Timpson, Joinson, Zammit, Smith and Lewis2011; Jalbrzikowski et al., Reference Jalbrzikowski, Larsen, Hallquist, Foran, Calabro and Luna2017), use of time-varying approaches may prove to be informative.
Summary of previous studies that have examined the effects of age on psychotic symptom severity

yrs., years; SCID-DSM III, Structured Clinical Interview for the DSM-III; SAPS, Scale for the Assessment of Positive Symptoms; SANS, Scale for the Assessment of Negative Symptoms; BPRS, Brief Psychiatric Rating Scale; PANSS, Positive and Negative Syndrome Scale; SIPS, Structured Interview for Prodromal Syndromes; P1, unusual thoughts rating on SIPS; P2, suspiciousness rating on SIPS; P3, grandiosity rating on SIPS; P4, perceptual abnormality rating on SIPS; P5, disorganized communication rating on SIPS; KSADS-PL, Kiddie Schedule for Affective Disorders and Schizophrenia, Present and Lifetime version.
The table is broken down into (A) studies that examine participants across mulitple phases of illness, (B) studies that focus on first-episode psychosis, (C) studies of help-seeking adolescents, and (D) population sample studies. Other than Pencer et al. (Reference Pencer, Addington and Addington2005), all studies are cross-sectional in nature. All studies of participants diagnosed with a psychotic disorder include individuals who are currently or previously have been prescribed antipsychotic medication.
In this study, we leveraged a longitudinal sample of antipsychotic-naïve (at baseline) first-episode psychosis participants (FEP, N = 340, 1–12 visits, 12–40 years) to (1) examine developmental effects on severity of perceptual and non-perceptual positive symptoms, and negative symptoms, (2) investigate developmental effects on change in psychotic symptom severity following first-episode, and (3) explore age-varying relationships between perceptual and non-perceptual positive symptom severity. Based on previous work (Brandizzi et al., Reference Brandizzi, Schultze-Lutter, Masillo, Lanna, Curto, Lindau and Fiori Nastro2014; Häfner, Riecher-Rössler, Maurer, Fätkenheuer, & Löffler, Reference Häfner, Riecher-Rössler, Maurer, Fätkenheuer and Löffler1992; Kelleher et al., Reference Kelleher, Keeley, Corcoran, Lynch, Fitzpatrick, Devlin and Cannon2012b; Schimmelmann et al., Reference Schimmelmann, Michel, Martz-Irngartinger, Linder and Schultze-Lutter2015; Schultze-Lutter et al., Reference Schultze-Lutter, Hubl, Schimmelmann and Michel2017), we hypothesized that perceptual positive symptoms would decrease in severity with increasing age and non-perceptual positive symptoms would be stable across adolescent development. Consistent with others (DeVylder et al., Reference DeVylder, Ben-David, Schobel, Kimhy, Malaspina and Corcoran2013; Haas & Sweeney, Reference Haas and Sweeney1992; Joa et al., Reference Joa, Johannessen, Langeveld, Friis, Melle, Opjordsmoen and Larsen2009; White et al., Reference White, Ho, Ward, O'Leary and Andreasen2006), we hypothesized that negative symptoms would remain stable across adolescent development. All remaining analyses were exploratory.
Materials and methods
Participants
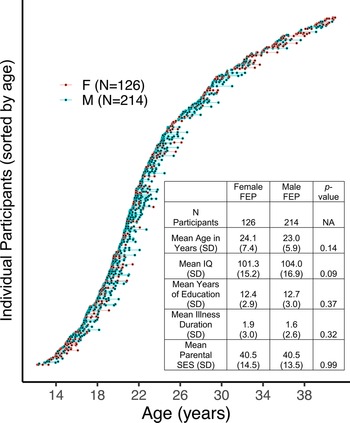
Participant data were taken from archival and ongoing studies at the University of Pittsburgh (1990–2017). The final sample consisted of 340 individuals with multiple visits (1–12 visits, n = 1068 total). See Figure 1 for demographic information and sample characterization. Study procedures were approved by the University of Pittsburgh Institutional Review Board and performed in accordance with the Declaration of Helsinki. All participants or their legal guardians provided written informed consent after study procedures were fully explained.
Waterfall plot of all participants and their respective visits. Each individual circle represents a participant at a particular visit. Lines connecting the circles refer to the time in-between visits. A demographic table is in the bottom right of the plot. A total of 290 individuals (85%) had two or more visits.

Exclusion criteria for all participants included: medical illness affecting central nervous system function or IQ lower than 75 (determined using the Wechsler Abbreviated Scale of Intelligence, Wechsler, Reference Wechsler1999). Inclusion criteria for FEP were as follows: experiencing a first psychotic episode, no prior specialized treatment for psychotic symptoms, and antipsychotic-naive. Psychosis diagnoses were determined using available clinical information and data gathered from a Structured Clinical Interview for DSM-IV (SCID, First, Spitzer, Gibbon, & Williams, Reference First, Spitzer, Gibbon and Williams2002) conducted by a trained clinician. Senior diagnostician/clinical researchers confirmed diagnoses and illness duration for each client at consensus meetings. See online Supplementary Figure S1 for a detailed description of participants removed from final analyses.
Clinical measures
We assessed positive symptom severity with the Scale for the Assessment of Positive Symptoms (SAPS; Andreasen, Reference Andreasen1984b). This scale includes 34 items addressing hallucinations, delusions, bizarre behavior, and formal thought disorder on a 0 (absent) to 5 (severe) scale. Consistent with Schimmelmann et al. (Reference Schimmelmann, Michel, Martz-Irngartinger, Linder and Schultze-Lutter2015), we summed individual items from the SAPS (omitting SAPS global rating items) to calculate perceptual (items 1–6, range: 0–30) and non-perceptual (items 8–33, range: 0–120) positive symptom scores.
We assessed negative symptom severity with the Scale for the Assessment of Negative Symptoms (SANS; Andreasen, Reference Andreasen1984a). The SANS includes 25 items addressing affective flattening, alogia, avolition, anhedonia, and attention on a 1 (absent/mild) to 5 (severe) scale (range: 25–125). All 25 items were initially scored for a total negative symptom score (omitting global rating items) and then scored by respective subgroups. A higher score on the SAPS or SANS indicates more severe symptomatology.
Statistical analyses
Aim 1: Developmental effects of symptomatology in FEP
To assess the developmental effects of symptomatology in FEP, data were modeled using penalized splines within a general additive model (GAM; Hastie & Tibshirani, Reference Hastie and Tibshirani1986, Reference Hastie and Tibshirani1990; Wood, Reference Wood2017). A GAM is an extension of the general linear model but does not assume a linear relationship between independent and dependent variables, allowing for a more flexible predictor. Smoothed predictor function(s) are automatically derived during model estimation with basis functions (here, thin-plate splines: MCGV default). Because incorporating more basis functions incurs greater penalties (using restricted maximum likelihood), GAM addresses many limitations of other non-linear models (e.g. over-fitting, variance/bias trade-offs). The dependent variable was the respective clinical measure being assessed. Fixed effects entered into the model were baseline chronological age (i.e. age at each visit), visit, and sex. To model and account for the non-independence of longitudinal data (multiple visits), the subject was included as a random effect (r). Because all clinical symptom data were skewed to the left, we performed a log transformation to normalize distributions.
Due to known sex differences in psychosis age of onset (Häfner et al., Reference Häfner, Riecher-Rössler, Maurer, Fätkenheuer and Löffler1992; Kirkbride et al., Reference Kirkbride, Fearon, Morgan, Dazzan, Morgan, Tarrant and Jones2006; Sharma, Reference Sharma1999), we first explored smoothed effects for age in sex separately (i.e. moderating effect of sex on age):

We also tested smoothed age effects for both sexes aggregated together:

To determine the best model fit, we used Bayesian information criterion (BIC), a commonly used measure for model selection (Vrieze, Reference Vrieze2012).
The broad age range and longitudinal data structure of the study (see Fig. 1) allowed us to explore (a) developmental effects of symptom expression at first episode and effects of (b) illness chronicity. To explore these potentially diverging developmental effects, we first included baseline age and visit as separate predictors in the GAM. However, despite having these entered as separate regressors, by including longitudinal data, we could hypothetically fail to truly measure symptoms at first expression. Thus, we re-ran all analyses using only cross-sectional data (i.e. visit 1). We also examined how socioeconomic status, IQ, length of time between visits, antipsychotic medication exposure, race and illness duration influenced our results. Because psychotic symptoms are temporally associated with cannabis use (Corcoran et al., Reference Corcoran, Kimhy, Stanford, Khan, Walsh, Thompson and Colibazzi2008; Degenhardt et al., Reference Degenhardt, Tennant, Gilmour, Schofield, Nash, Hall and McKay2007; Hides, Dawe, Kavanagh, & Young, Reference Hides, Dawe, Kavanagh and Young2006), we re-ran our analyses including cannabis use disorders as a covariate. Using SCID-IV diagnoses, we created three categorical variables: (1) lifetime cannabis use/dependence diagnosis, (2) lifetime cannabis use/dependence diagnosis, excluding those in full remission and (3) current cannabis use/dependence disorders only. We re-ran the analyses including each covariate in the model.
To identify specific developmental periods with a significant age-related change in symptom severity, we performed a posterior simulation on the first derivative of GAM fits. Following previous work (Calabro et al., Reference Calabro, Murty, Jalbrzikowski, Tervo-Clemmens and Luna2020) and established guidelines (Wood, Reference Wood2017), we used a multivariate normal distribution whose vector of means and covariance were defined by the fitted GAM parameters to simulate 10000 GAM fits and their first derivatives (generated at 0.1 year age intervals). Significant intervals of age-related change in symptom severity were defined as ages when the confidence intervals (95%) of simulated GAM fits did not include zero (p < 0.05).
Aim 2: Developmental effects of change in positive and negative symptom severity in FEP
To assess developmental effects of change in symptom severity, we created change scores between each visit for each symptom measure (e.g. Visit 3-Visit 2, Visit 2-Visit 1). We also calculated a change score with the baseline visit as the reference (Visit 3-Visit 1, Visit 4-Visit 1, etc.). We used GAM and modeled the smoothed effect of age as the predictor and the respective change score as the dependent variable. To account for regression to the mean and initial level of symptom severity, we covaried for symptom severity at first visit. We also used BIC to determine the best model fit with respect to sex and then assessed the smoothed effects of age:

We re-ran these analyses and included the number of days between visits as a covariate.
Aim 3: Interaction between non-perceptual positive symptoms and age on perceptual positive symptom severity
Given the evidence that neurobiological factors exert differential influences on symptomatology at distinct points in development (Ellwood-Lowe et al., Reference Ellwood-Lowe, Humphreys, Ordaz, Camacho, Sacchet and Gotlib2018; Glaser et al., Reference Glaser, Gunnell, Timpson, Joinson, Zammit, Smith and Lewis2011; Jalbrzikowski et al., Reference Jalbrzikowski, Larsen, Hallquist, Foran, Calabro and Luna2017), we hypothesized there may be developmentally-specific relationships between non-perceptual positive symptoms and perceptual positive symptoms. Thus, we tested how the smoothed effect of age at baseline visit on perceptual positive symptoms varies according to the degree of non-perceptual positive symptoms (i.e. the effect of a smoothed interaction between age and non-perceptual positive symptoms):

We used contour plots (mcgv package; Wood, Reference Wood2011) to visualize the result.
Within each set of analyses, false discovery rate (FDR) was used to correct for multiple comparisons (q < 0.05)
Results
Severity of distinct positive symptoms changes across adolescent development
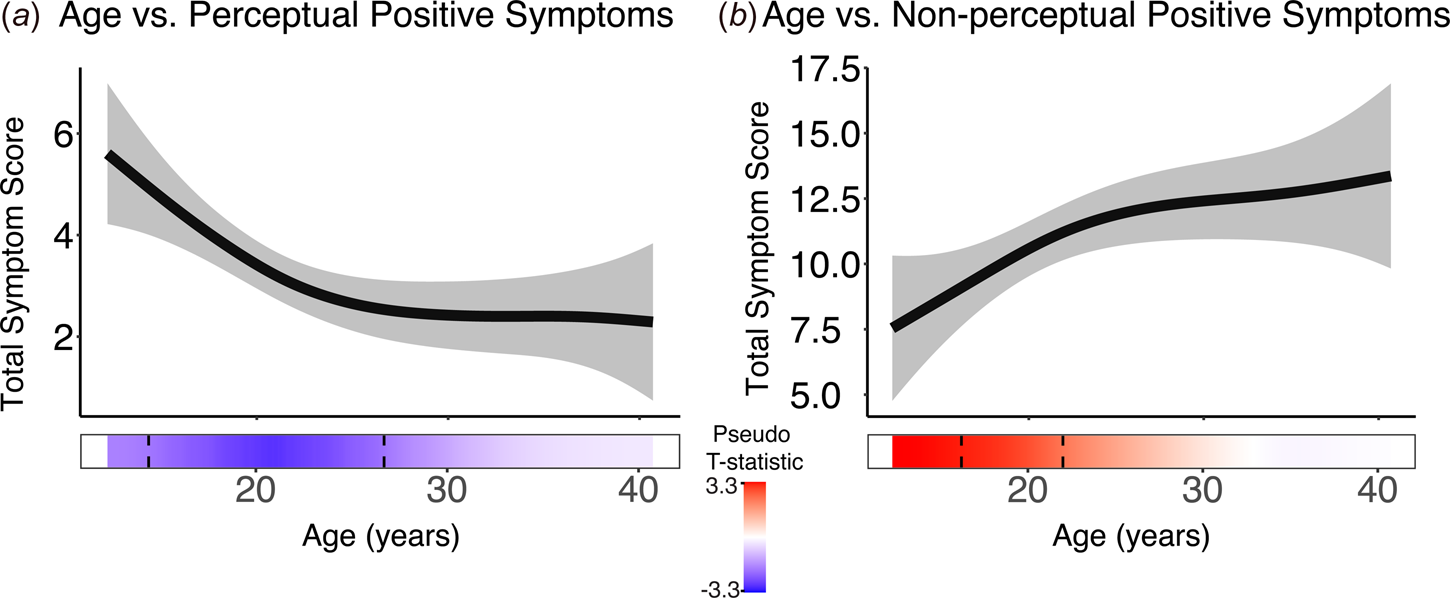
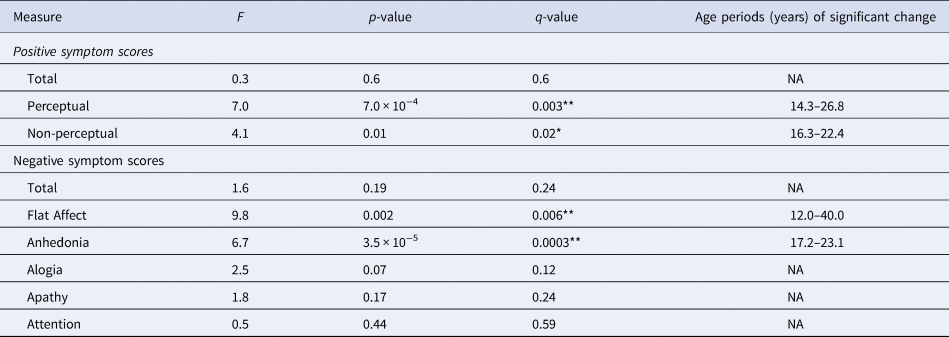
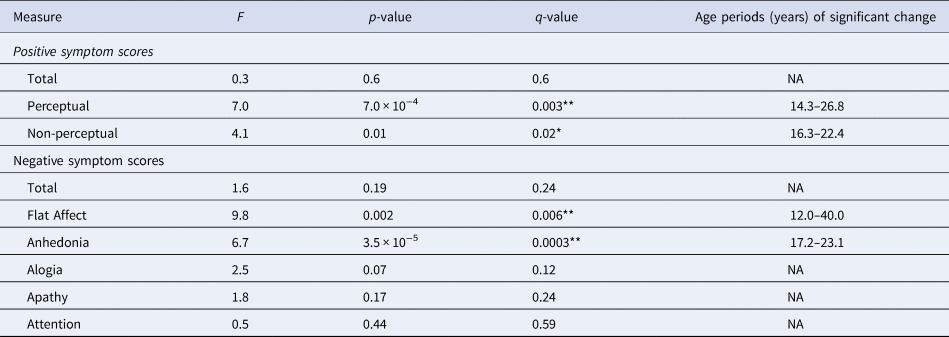
Table 2 reports the results of the smoothed effect of age on psychotic symptom severity. Perceptual positive symptoms declined in severity with increasing age, longitudinally (F = 7.0, p = 7.0 × 10⁻⁴; q = 0.003, Fig. 2a). Significant periods of age-related change occurred between 14.3 and 26.8 years old. Effects were driven by auditory and visual hallucinations, while developmental trajectories for somatic and olfactory hallucinations remained stable from 12 to 40 years (online Supplementary Fig. S2). Non-perceptual positive symptom severity significantly increased with increasing age (F = 4.1, p = 0.01, q = 0.02, Fig. 2b). Significant periods of age-related change occurred between 16.3 and 22.4 years old. Age-associated increases were driven by delusions and thought disorder (online Supplementary Fig. S3).
(a) Perceptual positive symptoms significantly decreased with increasing age longitudinally, while (b) non-perceptual positive symptoms increased with increasing age. The bar underneath the age plot reflects the derivative of the slope, i.e., the rates of change taking place at a particular age, scaled as a pseudo t-statistic, based on the posterior simulation. The dotted lines indicate when significant age-associated change is taking place. Darker shading in this bar indicates a greater absolute value of age-related change.

Developmental effects on positive and negative symptoms in first-episode psychosis
*pq< 0.05.
**q < 0.01.
There was no significant effect of age on total positive symptom severity longitudinally (F = 0.3, p = 0.6, q = 0.6). For all models tested, there were no significant main effects of sex (all p > 0.5). Furthermore, for all models, BIC estimates showed that including the effect of sex on smoothed age did not significantly improve model fit (online Supplementary Table S1).
Nearly all age-related changes remained statistically significant (p < 0.05) when IQ, parental socioeconomic status, illness duration, antipsychotic medication exposure, race, lifetime and current cannabis use disorders, and length of time between visits were included in the model as covariates (online Supplementary Tables S2–S10). When illness chronicity was included as a covariate, the relationship between age and non-perceptual positive symptoms fell to trend level (F = 2.3, p = 0.07, online Supplementary Table S4). Results remained consistent when only cross-sectional data (baseline) or when age at each visit (instead of age at first visit) were used in the analyses (online Supplementary Tables S11 and S12).
Exploratory developmental effects of negative symptoms
The severity of overall negative symptoms did not change across adolescent development (F = 1.6, p = 0.19, q = 0.24). When individual symptoms were examined, anhedonia severity increased with increasing age (F = 6.7, p = 3.5 × 10⁻⁵, q = 0.0003), while flat affect severity decreased with increasing age (F = 9.8, p = 0.002, q = 0.006). Symptom severity of alogia, attention and apathy remained stable from ages 12 to 40 years old. Results are presented in online Supplementary Table S13 and Figure S4.
No significant effects of development on symptom change following baseline assessment
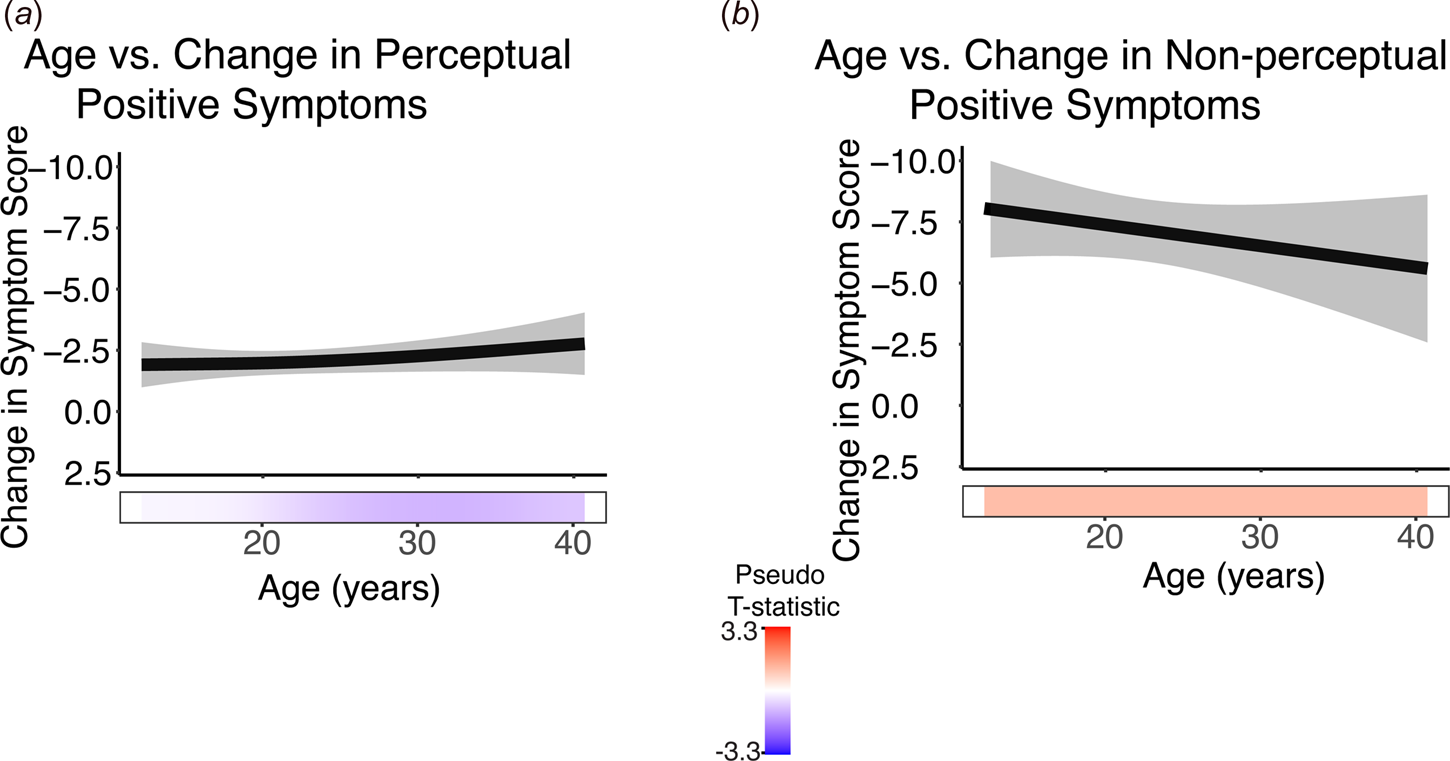
There were no significant developmental effects on change in symptom severity when we examined change between all visits (Visit 3-Visit 2, Visit 4-Visit 3, etc.) and change between each visit and the baseline visit (Visit 3-Visit 1, Visit 4-Visit 1, etc.; Figure 3, online Supplementary Tables S14 & S15). Mean length of time between visits was 73.3 days (s.d.: ±73.5 days, range: 6–700 days, online Supplementary Fig. S5). On average, symptom severity was lower in subsequent visits compared to the first visit, regardless of age (all p-values >0.20). When the number of days between visits was included as a covariate, results remained consistent.
Change in symptom severity remained stable across age for (a) perceptual positive symptoms and (b) non-perceptual positive symptoms. Darker shading in the bar underneath the age plot indicates the greater absolute value of age-related change.

Smoothed interaction between age and non-perceptual positive symptoms on perceptual positive symptoms
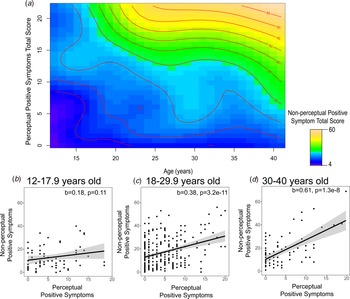
There was a statistically significant interaction between the smoothed effect of age and perceptual positive symptoms on non-perceptual positive symptoms (F = 13.1, p = 2 × 10⁻¹⁶, Fig. 4a). In youth (<18 years), there was no statistically significant relationship between perceptual symptoms and non-perceptual symptoms (<18 years, b = 0.18, p = 0.11, Fig. 4b). However, in adults (⩾18 years), there was a statistically significant relationship, as higher levels of perceptual positive symptoms were associated with greater levels of non-perceptual symptoms (18–29 years: b = 0.38, p = 3.2×10⁻¹¹, Fig. 4c; 30–40 years: b = 0.60, p = 1.2×10⁻⁸, Fig. 4d).
(a) A contour plot illustrating how the relationship between perceptual and non-perceptual positive symptoms changes across adolescent development. The color reflects the strength of the severity of non-perceptual positive symptoms, with yellows indicating a higher level of non-perceptual positive symptoms. The severity level of non-perceptual symptoms across different ages is also indicated with red lines and text. To understand this figure, it is helpful to pick a particular age and traverse the height of the graph. At age 15, individuals with greater levels of perceptual positive symptoms (e.g. a score >10) may have a limited range in the severity of non-perceptual positive symptoms (15–20) and the variables are not strongly associated with one another. At age 35, as individuals’ levels of perceptual positive symptoms increase, their non-perceptual positive symptoms also increase (the change from blue to yellow, and the successive increase in non-perceptual positive symptom severity, observed by the multiple red lines on the right-hand side of the graph). For visualization purposes, we also plot the linear fit between perceptual and non-perceptual positive symptoms in three separate age ranges: (b) 12–17.9 years old, (c) 18–29.9 years old, and (d) 30–40 years old.

Discussion
In a large, antipsychotic-naïve sample of individuals experiencing their first episode of psychosis (12–40 years old), we found distinct patterns of association between development and particular psychotic symptoms. Neither medication exposure at follow-up, IQ, race, cannabis disorder diagnosis, nor socioeconomic status accounted for these associations. We consider these results evidence of selective age-related developmental influences on emerging psychosis. Additionally, the nature of the age-symptom associations may inform our understanding of the pathophysiological processes underlying first-episode psychosis, highlighting the importance of developmentally-informed approaches for both research and treatment in this population.
Distinct developmental trajectories of specific positive symptom severity
We used nonlinear modeling strategies to determine distinct periods of change in positive symptom expression. Between 14 and 26 years old, perceptual symptom severity decreased significantly, particularly for auditory and visual hallucinations. Somatic and olfactory hallucinations remained stable across adolescent development. Given their low prevalence rate in comparison to visual and auditory hallucinations (Lewandowski, DePaola, Camsari, Cohen, & Öngür, Reference Lewandowski, DePaola, Camsari, Cohen and Öngür2009; Mueser et al., Reference Mueser, Bellack and Brady1990), it would be difficult to detect significant effects of age on these specific symptoms. Our findings are consistent with reports that hallucinations are more prevalent in cases of childhood and adolescent-onset psychosis than in adult-onset psychosis (David et al., Reference David, Greenstein, Clasen, Gochman, Miller, Tossell and Rapoport2011; Green et al., Reference Green, Padron-Gayol, Hardesty and Bassiri1992). These findings dovetail nicely with clinically-ascertained high-risk and population sample findings that younger adolescents are more likely to report perceptual abnormalities than older adolescents and young adults (Brandizzi et al., Reference Brandizzi, Schultze-Lutter, Masillo, Lanna, Curto, Lindau and Fiori Nastro2014; Kelleher et al., Reference Kelleher, Connor, Clarke, Devlin, Harley and Cannon2012a, Reference Kelleher, Keeley, Corcoran, Lynch, Fitzpatrick, Devlin and Cannon2012b; Schimmelmann et al., Reference Schimmelmann, Michel, Martz-Irngartinger, Linder and Schultze-Lutter2015; Schultze-Lutter et al., Reference Schultze-Lutter, Hubl, Schimmelmann and Michel2017). Taken together, these findings suggest that across the continuum of psychosis-spectrum severity, perceptual positive experiences decrease with increasing age, possibly reflecting the period of specialization that is indicative of adolescent development.
In contrast, non-perceptual positive symptom severity significantly increased with increasing age from 16 to 22 years old, an effect driven by delusions and thought disorder. These findings align with those of Häfner et al. (Reference Häfner, Riecher-Rössler, Maurer, Fätkenheuer and Löffler1992), who showed in a chronic schizophrenia-spectrum sample that older participants (>25 years) were more likely to endorse delusions than younger participants (ages 12–24 years). Together, these findings suggest that delusions may be less severe or likely to form in early adolescence, or that they are less impairing or distressing (and therefore less likely to be reported to clinicians).
These developmental differences in perceptual and non-perceptual symptom severity point to potentially distinct treatment needs for individuals diagnosed with psychosis-spectrum disorders in childhood or adolescence v. adulthood. For example, clients in early adolescence may benefit from learning strategies that target effective ways to respond to hallucinations, whereas it may be more effective for older clients to focus on cognitive reappraisal to cope with delusional thoughts. The observed developmental variations could also reflect the fact that symptom expression has different clinical implications at different ages. Types of stressors change across adolescent development (Compas, Reference Compas1987; Eccles, Midgley, Wigfield, Buchanan, & Reuman, Reference Eccles, Midgley, Wigfield, Buchanan and Reuman1993; Simmons, Burgeson, Carlton-Ford, & Blyth, Reference Simmons, Burgeson, Carlton-Ford and Blyth1987; Stroud et al., Reference Stroud, Foster, Papandonatos, Handwerger, Granger, Kivlighan and Niaura2009); perhaps perceptual symptoms are likely to present themselves with stressors that are typical of late childhood/early adolescence, while non-perceptual symptoms are a response to adult stressors. Additionally, the developmental timing of a particular risk factor (e.g. substance use, social adversity) may bring about different types of symptom responses, a phenomenon observed in other psychiatric disorders (see Thapar and Riglin, Reference Thapar and Riglin2020 for a more thorough discussion).
Distinct developmental trajectories of specific negative symptom severity
Among negative symptoms, affective flattening severity exhibited consistent linear decreases with increasing age. Anhedonia severity increased with increasing age between 17 and 23 years. There were no significant age-related changes in severity of alogia, attention or apathy symptoms. Our findings of decreased affective flattening with increasing age are consistent with previous work (Ballageer et al., Reference Ballageer, Malla, Manchanda, Takhar and Haricharan2005; Häfner et al., Reference Häfner, Riecher-Rössler, Maurer, Fätkenheuer and Löffler1992). Worsening anhedonia with increased age may be related to increased feelings of stigma and hopelessness as the psychotic disorder progresses, given that higher levels of internalized stigma and increased feelings of hopelessness are associated with increased negative symptom severity (Hill & Startup, Reference Hill and Startup2013; Lysaker, Vohs, & Tsai, Reference Lysaker, Vohs and Tsai2009; White, McCleery, Gumley, & Mulholland, Reference White, McCleery, Gumley and Mulholland2007). Individuals with psychotic disorders are more likely to endorse feelings of stigma as the disease progresses (Firmin et al., Reference Firmin, Lysaker, Luther, Yanos, Leonhardt, Breier and Vohs2019), and, in turn, stigma has been found to predict feelings of hopelessness in individuals with schizophrenia-spectrum disorders (Wood, Byrne, Burke, Enache, & Morrison, Reference Wood, Byrne, Burke, Enache and Morrison2017). Future work should explore how the relationships between anhedonia, stigma, and hopelessness change across development.
Most previous publications examined overall negative symptom severity rather than changes in individual negative symptoms; and these studies reported no significant differences in overall negative symptom severity by age of onset (DeVylder et al., Reference DeVylder, Ben-David, Schobel, Kimhy, Malaspina and Corcoran2013; Haas & Sweeney, Reference Haas and Sweeney1992; Joa et al., Reference Joa, Johannessen, Langeveld, Friis, Melle, Opjordsmoen and Larsen2009; White et al., Reference White, Ho, Ward, O'Leary and Andreasen2006) – we replicate these findings. Further work examining age effects on individual negative symptoms should be done. While increased severity of negative symptoms is associated with greater functional impairment and lower quality of life (Fulford et al., Reference Fulford, Niendam, Floyd, Carter, Mathalon, Vinogradov and Loewy2013; Herbener & Harrow, Reference Herbener and Harrow2004; Ho et al., Reference Ho, Psych, Nopoulos and Arndt1998; Mäkinen, Miettunen, Isohanni, & Koponen, Reference Mäkinen, Miettunen, Isohanni and Koponen2008; Santesteban-Echarri et al., Reference Santesteban-Echarri, Paino, Rice, González-Blanch, McGorry, Gleeson and Alvarez-Jimenez2017; Ventura, Hellemann, Thames, Koellner, & Nuechterlein, Reference Ventura, Hellemann, Thames, Koellner and Nuechterlein2009), it is unknown if this relationship is stable across adolescent development, and to what extent specific negative symptoms contribute to this association.
No evidence of developmental effects of change in positive and negative symptom severity
There were no significant developmental effects on change in symptom severity across study visits. Across our age range, symptom severity was significantly lower at subsequent visits. Earlier onset of psychosis (<18 years) is often associated with worse long-term outcome (Clemmensen, Vernal, & Steinhausen, Reference Clemmensen, Vernal and Steinhausen2012; Immonen, Jääskeläinen, Korpela, & Miettunen, Reference Immonen, Jääskeläinen, Korpela and Miettunen2017) and increased time to symptom remission in first-episode samples (Malla et al., Reference Malla, Norman, Schmitz, Manchanda, Béchard-Evans, Takhar and Haricharan2006; Veru, Jordan, Joober, Malla, & Iyer, Reference Veru, Jordan, Joober, Malla and Iyer2016). However, our results suggest that change in symptom severity is similar across development. Unlike our study, these studies did not quantitatively assess change in symptom presentation (regardless of direction). Furthermore, these studies did not focus on antipsychotic-naïve cases; thus, symptom severity may have been associated, in part, with the duration of exposure to medication prior to baseline assessment.
Significant interaction between effect of age and perceptual positive symptoms on non-perceptual positive symptoms
We found that, with increasing age, the relationship between perceptual positive symptom severity and non-perceptual positive symptoms grows significantly stronger. These findings are consistent with the cognitive models of psychosis (Garety, Kuipers, Fowler, Freeman, & Bebbington, Reference Garety, Kuipers, Fowler, Freeman and Bebbington2001; Maher, Reference Maher1974, Reference Maher2006) that propose abnormal perceptual experiences lead to the formation of delusions. Individuals who experience meaningful and emotionally charged hallucinations will then seek explanations for these experiences, leading to the development of delusions (Garety et al., Reference Garety, Kuipers, Fowler, Freeman and Bebbington2001). Thus, hallucinations may precede the development of or worsening of delusions as individuals search for a way to explain their unusual perceptions. With increasing age, these explanations (delusions) become more crystallized and/or severe, even if the perceptions lessen. Alternatively, the underlying factor structure of the set of positive symptoms differs between relatively younger adolescents, older adolescents and adults. For example, among younger individuals, perceptual abnormalities load more strongly on a general psychopathology factor (Kelleher et al., Reference Kelleher, Keeley, Corcoran, Lynch, Fitzpatrick, Devlin and Cannon2012b; Lancefield, Raudino, Downs, & Laurens, Reference Lancefield, Raudino, Downs and Laurens2016), while among relatively older individuals, the emergence of perceptual abnormalities may reflect a more specific pathology (i.e. psychosis-spectrum disorders).
Possible mechanisms underlying developmental changes in symptom severity
It is important to consider the physiological underpinnings of developmental influences on symptoms. Aberrant developmental changes in the balance of excitatory and inhibitory neurotransmitters may alter distinct brain circuits, leading to the onset of psychosis (e.g. Mikanmaa et al., Reference Mikanmaa, Grent-’t-Jong, Hua, Recasens, Thune and Uhlhaas2019). Dysregulated development of dopamine may contribute to this excitatory-inhibitory imbalance, potentially leading to the development of psychotic symptoms (Kapur, Reference Kapur2003; Larsen & Luna, Reference Larsen and Luna2018; van Nimwegen, Haan, Beveren, Brink, & Linszen, Reference van Nimwegen, Haan, Beveren, Brink and Linszen2005). Given that perceptual and non-perceptual symptoms are associated with alterations in particular brain networks (e.g. abnormal perceptual experiences may reflect abnormalities in sensory and temporal regions, while delusions may be due to disrupted connections between frontolimbic areas, Corlett, Taylor, Wang, Fletcher, & Krystal, Reference Corlett, Taylor, Wang, Fletcher and Krystal2010; Corlett et al., Reference Corlett, Horga, Fletcher, Alderson-Day, Schmack and Powers2019; Jardri, Thomas, Delmaire, Delion, & Pins, Reference Jardri, Thomas, Delmaire, Delion and Pins2013), it is possible that age-associated differences in symptom severity reflect changes in the excitatory-inhibitory balance of distinct areas of the brain. In future work, particular circuits associated with these symptoms should be studied within a developmental framework.
Limitations
This study is not without limitations. As data were retrospectively collected from multiple studies, there was variation in the time between visits (range 6–700 days). Replication in a longitudinal study with uniform follow-up visits is necessary. Furthermore, though all participants were antipsychotic-naïve at baseline, the type of treatment participants engaged in post-baseline varied and was not controlled for in this study. Nonetheless, estimation of age-related developmental effects on the nature and severity of initial presenting symptoms of young people in their first episode of psychosis is an important step in investigating developmental underpinnings of early symptom presentation. Additionally, the age range used in this study (12–40 years) limits the generalizability of these results to individuals >40 years experiencing their first episode of psychosis. Furthermore, while we report our results within the context of the neurodevelopmental model of psychosis, we did not associate symptom severity with earlier, pre- and postnatal risk factors (Ellman et al., Reference Ellman, Murphy, Maxwell, Calvo, Cooper, Schaefer and Brown2019; Fusar-Poli et al., Reference Fusar-Poli, Tantardini, De Simone, Ramella-Cravaro, Oliver, Kingdon and McGuire2017; Radua et al., Reference Radua, Ramella-Cravaro, Ioannidis, Reichenberg, Phiphopthatsanee, Amir and Fusar-Poli2018). Linking earlier risk factors of psychosis to changes occurring during adolescence is an important next step to further inform the neurodevelopmental model of psychosis. Finally, pubertal development and hormonal changes have been implicated as factors that impact the risk for and sex-related variation in age at onset of psychosis (e.g. Corcoran et al. Reference Corcoran, Walker, Huot, Mittal, Tessner, Kestler and Malaspina2003; Markham, Reference Markham2012; Walker, Mittal, & Tessner, Reference Walker, Mittal and Tessner2008; Walker & Bollini, Reference Walker and Bollini2002); thus, future work should assess how measures of pubertal development relate to positive and negative symptomatology.
Conclusion and future directions
We observed distinct age-related developmental effects on psychotic symptoms in an antipsychotic naïve sample with first-episode psychosis. These findings point to the importance of age as an index of developmental effects on specific symptom domains rather than overall symptom severity. Future investigation of specific age-related symptom trajectories may be informative for improving the identification of risk factors for psychosis. Furthermore, in the future, approaching psychosis risk characterization and prediction from a developmental perspective may improve identification and prevention efforts. Studies of clinical-high risk cohorts report that higher levels of non-perceptual positive symptoms (e.g. unusual thought content and suspiciousness; Cannon et al. Reference Cannon, Cadenhead, Cornblatt, Woods, Addington, Walker and Heinssen2008, Reference Cannon, Yu, Addington, Bearden, Cadenhead, Cornblatt and Kattan2016) significantly predict conversion to psychosis, not perceptual positive symptoms, highlighting the important potential for development in future studies of psychosis-risk. Finally, to better understand brain mechanisms underlying developmental effects on symptom severity, it will be useful to conduct a longitudinal neuroimaging study examining the relationship of these developmentally-divergent symptoms and distinct neural regions involved in perceptual and non-perceptual positive symptoms.
Supplementary material
The supplementary material for this article can be found at https://doi.org/10.1017/S0033291720003463
Acknowledgements
The project described was supported by the National Institutes of Health through grants K01 MH112774 (Maria Jalbrzikowski, PI); R01 MH094328, R01 MH108568P50 (Dean F. Salisbury, PI); MH103204, P50 MH084053, P50 MH045146 (David A. Lewis, MD, Director); UL1 TR001857, UL1 RR024153 (Steven E. Reis, MD, PI); and M01 RR00056 (Arthur Levine, MD, PI). We thank the faculty and staff of the WPH Psychosis Recruitment and Assessment Core for their assistance in diagnostic and psychopathological assessments. We also thank Leah Vines and Sabrina Catalano for providing feedback to drafts of the manuscript. The authors of this work have no financial disclosures or potential conflicts of interest to report.