

1. Introduction
Spanish, as notably indicated by Michael Clyne in 1992, is among the polycentric languages of the world. Polycentric languages, as introduced by Clyne and following Heinz Kloss (Reference Kloss1978), are defined as those offering several centers of normativity where, for instance, a national variety turns for at least some of its own codified norms. In Clyne’s edited volume Pluricentric Languages (Reference Clyne1992), there is, in fact, a chapter dedicated to Spanish, wherein Robert W. Thompson affirms that “the unity of Spanish standard dialects is beyond dispute, although the language is clearly pluricentric” (Reference Thompson and Clyne1992:66). Indeed, beyond having a large portion of features shared in common, phonological, grammatical, and lexical norms for Spanish varieties allow ample normative space for differentiated uses. It is, thus, interesting when sociolinguistics enters into the analysis of variable uses of an educated norm since it is the nature of those kinds of features, as well as the direction that language change might possibly take in the future, that determines the norm’s prestige and acceptance in education and teaching.
Normativized variation already recognized in Spanish includes, for instance, the use of past perfect as opposed to the simple past. As foreseen and described in the Nueva Gramática de la Lengua Española in 2011, the temporal and aspectual characteristics of these forms demonstrate regular variations among different Spanish-speaking communities (RAE-ASALE, 2009–2011). Other variable and normativized forms in the Nueva Gramática include voseo, phonological seseo and, as exemplified in the common academic dictionary, geographic lexical variation. However, of considerable interest for the analyst are so-called “marginal” linguistic variants, that is, those uses where frequency, evolutionary phase in the language and social valuation would seemingly not yet permit their inclusion alongside other variable uses that have become part of the norms of general Spanish. For sociolinguists, it is such cases of real-time variation and change in progress that are of particular interest, especially when these have not yet received normative attention and particularly when they are produced below the level of speakers’ consciousness.
In this way, alongside several socially and geographically variable uses, which have, nonetheless, been recognized as part of the standard, there exist many other variable phenomena that are neither recognized nor accepted, but which are very much alive. In some cases, these uses have been in evidence for a very long time and can be found in areas of the Spanish-speaking world that are quite distant from one another. Several such features of the grammar, for instance, were gathered some time ago by Charles Kany in his 1945 book American-Spanish Syntax. Among them, Kany included one feature whose analysis serves as the focal point for our present reflections, namely, the omission of the pronoun lo when functioning as a direct object. In our discussion, we’ll refer to this phenomenon as “the null direct object,” as it has also been called (Camacho, Paredes & Sánchez, Reference Camacho, Paredes, Sánchez, Hughes, Hughes and Greenhill1997; Clements, Reference Clements, Clements and Yoon2006; Schwenter, Reference Schwenter, Face and Klee2006, Reference Schwenter and Díaz-Campos2011; Reig-Alamillo, Reference Reig-Alamillo2009).
2. Null objects in Spanish
The Nueva Gramatica de la Lengua Española, published by the Association of Spanish Language Academies (RAE-ASALE, 2009–2011), explains that, in general Spanish, the direct object is typically expressed using a noun, a noun phrase, or an unstressed pronoun. In reality, a noun or noun phrase that serves as a direct object can be substituted with an unstressed accusative pronoun that has the same gender and number as the noun phrase. Unstressed accusative pronouns in Spanish include “lo,” “la,” “los,” or “las”. Example 1 shows this process, where the substituted pronouns are “lo” and “la”.
1 No pienso leer este libro > No pienso leerlo
‘I’m not planning on reading this book[ACC, SING, MASC]. >I’m not planning on reading it[ACC, SING, MASC].’
Dame la mano > Dámela
‘Give me your hand[ACC, SING, FEM]. > Give me it[ACC, SING, FEM].’
Of course, for the moment, I am clearly sidestepping cases where “le” and “les” also function as the direct object of a verb, as in Quiero verle ‘I want to see him/her’ or Intentó comerle entero ‘She tried to eat it whole.’ The direct object “le” in these sentences manifests a distinct morphosyntactic function.
The substitution of a lexical noun phrase with an unstressed accusative pronoun represents a textual or discursive syntactic phenomenon that occurs in different sentence positions. This can be seen in the examples in number 2.
2
No encontraba sus acuarelas. Seguramente las perdió en la escuela
‘She couldn’t find her watercolors[ACC, PLURAL, FEM]. She most likely lost them [ACC, PLURAL, FEM] at school.’
Fui a comprarte el libro, pero no lo encontré
‘I went to buy the book[ACC, SING, MASCV] for you, but I couldn’t find it [ACC, SING, MASC].’
The direct object pronoun and its noun phrase antecedent do not always occur in the same clause or sentence. This was seen in example 2, where the antecedent of the direct object pronoun was in the previous sentence. In such cases, as well as in cases of dislocation like in number 4, the presence of the unstressed direct object pronoun is obligatory and is typically expressed in general Spanish.
As it turns out, it is also possible in Spanish for a “lo, la, los” or “las,” functioning as a direct object, to be omitted. That is, a “null” direct object can also occur. This was also observed in 1945 by Charles Kany when he stated: “lo with cognition and communication verbs is frequently omitted in American Spanish” (14). Let’s look at example 3, where “las” is omitted:
3
A: ¿Entendiste sus explicaciones? B: Sí, Ø entendí
‘A: Did you understand the explanations[ACC, PLURAL, MASC]? B: Yeah, I understood Ø.’
Cases of omission like this were also discussed by grammarians of the 1980s. Hector Campos said in Reference Campos1986, for example, that the loss of the pronoun is a grammatical phenomenon that can occur when the referent is indefinite or lacks specificity. Example 4 is the optional context, where the noun phrase antecedent has an indefinite and/or nonspecific referent.
4
A. ¿Compraste café? B. Sí, Ø compré
‘A. Did you buy coffee[ACC, SING, MASC]? B: Yes, I bought Ø.’
A. ¿Compraste regalos? B. Sí, Ø compré
‘A. Did you buy gifts[ACC, PLURAL, MASC]? B: Yes, I bought Ø’
At this point, although the nonexpression of the pronominal direct object is not necessarily “recognized” as a standard feature of Spanish syntax, our current interest is that it is a variable phenomenon. It varies in accord with linguistic, discourse and geographic factors. Charles Kany again observed this in 1945 in connection with various dialects of South American Spanish. He noted that it occurred not only when the referent was indefinite, but also when the referent is specific or definite: “lo […] is very frequently omitted in American Spanish, particularly in conversation” (Kany, Reference Kany1945:14).
And this leads us to the causes for the omission of pronominal direct objects and, particularly, the discursive and dialectal factors that condition its occurrence. The questions to be explored include: In what Spanish-speaking regions is the null direct object found? What are the semantic, syntactic, and discursive factors that favor the null direct object? These questions will be explored in the hope of answering a broader one: Are we in the midst of a linguistic change from below? Are we witnessing the loss of unstressed direct object pronouns from general Spanish? In addition to methodological issues, all of those questions are related to the main goals of the paper.
Before presenting the analysis, it’ll be helpful to make two further observations about null objects. The first is that null objects also occur in other languages (Luraghi, Reference Luraghi and Ramat1998; Goldberg, Reference Goldberg2001; Cummins & Roberge, Reference Cummins, Roberge, Auger, Clements and Vance2004), very especially in Romance languages, like French, Romanian, and Portuguese (Lambrecht & Lemoine Reference Lambrecht, Lemoine, Chuquet and Frid1996; Larjavaara, Reference Larjavaara2000; Costa, Lobo, Carmona & Silva, Reference Costa, Lobo, Carmona, Silva, Gavarró and Freitas2008), and specifically, in the Portuguese of Brazil (Raposo, Reference Raposo1984, Reference Raposo, Jaeggli and Silva-Corvalán1986). Null objects have been studied from different perspectives, including L1 acquisition (Mateu, Reference Mateu2015), offering complementary interpretations to more sociological, geographical, and lingusitic hypotheses. The null direct object has also been studied in Latin, where omission was favored by coordinated sentences, indefinite objects, and whole sentences as its antecedent (Luraghi, Reference Luraghi1997).
The literature on Brazilian Portuguese proves especially helpful to our investigation (Schwenter & Silva, Reference Schwenter and Silva2002). There it has been shown that the acceptability of the null object represents more of a continuum, one that responds principally to two factors: animacy and specificity. Animacy is an inherent property of the referent. Specificity is determined by the discourse and depends on whether the speaker has a particular referent in mind. In Brazilian Portuguese, a null direct object would be more likely when its referent is nonspecific, inanimate, and/or non-definite. Observe the examples in 5 (Lima Baretto, Reference Lima Baretto2010).
5
A vida é um mar de rosas quando sabemos aproveitar Ø
‘Life[ACC, SING, FEM] is a sea of roses when we know how to enjoy Ø’
O João comprou um livro novo. Ontem ele trouxe Ø à aula
‘João bought a new book[ACC, SING, MASC]. Yesterday he brought Ø to class’
Although the null object in Brazilian Portuguese has long been a feature of interest, the frequency of its occurrence, especially in popular language, emerged as a topic of investigation mostly in the 20th century (Cyrino, Reference Cyrino1997). Preliminary questions to pose then would be whether its use in Spanish, like in Brazilian Portuguese, has been advancing in scope and whether the intensity of its diffusion in social and linguistic contexts parallels that of Brazilian Portuguese.
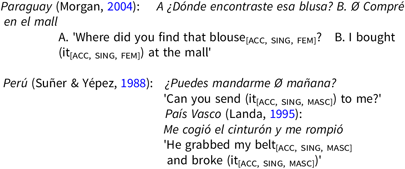
The second observation concerns the sociogeographic contexts in which null objects in Spanish have been observed. They seem to be more prevalent in varieties of Spanish which are in contact with other languages, such as Guarani in Paraguay, Basque in the Iberian Peninsula, and Quechua in Peru and in other regions of the Andes (Paredes, Reference Paredes1996; Palacios, Reference Palacios1998, Reference Palacios and Calvo2000; Urrutia Cárdenas & Fernández Ulloa, Reference Urrutia Cárdenas and Ulloa1997; Sánchez, Reference Sánchez, Authier, Reed and Bullock1999; Choi, Reference Choi2000). This observation is particularly important since it points to factors that condition its use that do not have to do with “language internal tendencies” in Spanish nor with those factors that have been identified as influential in null object use in Brazilian Portuguese. Let’s look at the examples in 6.
6

3. Research questions and hypotheses
One thing that piques the interest with respect to null objects is that, in addition to being prevalent in situations of language contact, they have also been observed in areas that have no contact with other languages (Reig-Alamillo & Schwenter, Reference Reig Alamillo, Schwenter, Holmquist, Lorenzino and Sayahi2007; Sainzmaza-Lecanda & Schwenter, Reference Sainzmaza-Lecanda, Schwenter, Bellamy, Child, González, Muntendam and Parafita Couto2017). For example, null objects occur in Mexico (Reig Alamillo, Reference Reig-Alamillo2009; Schwenter, Reference Schwenter, Face and Klee2006). If it were the case that they were used widely, both socially and geographically, then their occurrence would seem to represent not so much a change due to contact, but rather a language-internal tendency in Spanish, parallel to the situation of Brazilian Portuguese. In instantiating a phenomenon in which “locutions, formerly considered limited to one or two regions, enjoy a greater geographical range,” null direct objects may even be “part of a general heritage” (Kany, Reference Kany1945:xii), part of an educated norm in Spanish. The fact that the literature on null direct objects in Spanish does, in fact, include varied social and geographic contexts suggests that the phenomenon is one of functional or syntactic variation. According to the typology of Martín Butragueño (Reference Martín-Butragueño1994), this kind of variation typically implicates linguistic factors as principal drivers of the change. Social factors can often play a role too, but not always. Whatever the primary motivators, however, our task would be to show their relationship to the phenomenon being examined, as advised by variationist sociolinguistics (Silva-Corvalán & Enrique-Arias, Reference Silva-Corvalán and Enrique-Arias2017).
To know if a particular phenomenon is language-internal, it is necessary to gather data from numerous locations, using a methodology that allows different varieties of Spanish to be compared. If the null object is not used exclusively in places like Asunción, Quito, or Basque Country, if it is found even in monolingual settings far from these places, and if its use in those distant locations is sufficiently diffused socially, this would make for strong preliminary evidence that what is indeed at hand in Spanish is a language-internal change in progress. This is the principal goal of this investigation: to examine the frequency and diffusion of the null object for evidence that points to the nature of pronoun variation in Spanish. This is accomplished using a comparative multilectal sociolinguistic technique: international surveys. The research questions for this analysis are the following:
a. Where are null objects used most and with what frequency?
b. What geographic differentiations emerge from the quantitative analysis?
c. Who uses null objects most?
d. What semantic and syntactic contexts condition the appearance of null objects?
e. To what extent does linguistic use coincide with the linguistic opinion about null objects with verbs of communication?
Answers to these questions, in combination with the use of comparative sociolinguistic techniques, will allow a better understanding of how syntactic change over expansive areas works. But here are some initial hypotheses:
1. Language change occurs at different paces in diverse regions of a large area, so that, as Italian neolinguistics established, central areas are more innovative than peripheral areas (Bartoli & Bertoldi, Reference Bartoli and Bertoldi1925).
2. Variation in null direct objects in Spanish responds principally to semantic factors, such as animacy and specificity, similar to the situation of Brazilian Portuguese (Schwenter & Silva, Reference Schwenter and Silva2002).
3. Variation in null direct objects in Spanish can also respond to discourse and contextual conditions (Cameron, Reference Cameron1992).
4. Null objects will not show significant variation with respect to social factors such as age or sex (Reig-Alamillo, Reference Reig-Alamillo2008).
5. Speaker’s positive perceptions of a phenomenon accelerate its rate of diffusion, and thus also linguistic change (Moreno-Fernández, Reference Moreno-Fernández2017). So, we expect that the null objects will be more frequent in regions where respondents have more favorable opinions of it.
Regarding Hypothesis 1, innovative areas would allow more easily the advanced development of language variations, at different levels. This is due to crossed linguistic influences, as the Caribbean history shows, at the same time that a lesser pressure from the standard language is perceived. That perception is frequently found also in areas of language contact. On the other hand, Hypothesis 2 would assume that there is no syntactic rule applying to direct object omission, and that there is no “null element” present because of the proximity of an antecedent and referent. In this case, it would be possible to accept that null objects are included in the lexical entry of the verbs, which would allow the nonexpression of direct objects. Nevertheless, the absence of a specific syntactic rule does not mean the irrelevance of syntax. In fact, some formal conditions may clearly favor the omission of direct objects.Footnote 1
4. Methodology for macroregional sociolinguistics
Sociolinguistics continues to require a methodology that is able to disentangle the multiple and often competing influences that shape linguistic facts and that can explain variation in linguistic behavior. This is still often accomplished today by holding up for comparison the ways that some particular linguistic phenomenon works in related linguistic varieties (Labov Reference Labov, Lehmann and Malkiel1982; Cameron, Reference Cameron1992; Tagliamonte, Reference Tagliamonte, Chambers, Trudgill and Schilling-Estes2002:729; Astorgano Abajo, Reference Astorgano Abajo2010; Claes, Reference Claes2014, Reference Claes2016; Carvalho, Orozco & Shin, Reference Carvalho, Orozco and Shin2015). Comparative methodology, then, has been and continues to be integral, not only to historical linguistics but also to quantitative sociolinguistics.
The present analysis, too, falls squarely into the realm of comparative sociolinguistics. It contrasts uses and grammaticality judgments of the null direct object in different Spanish-speaking communities (Birdsong, Reference Birdsong1989; Schütze, Reference Schütze1996). The study described here is multidialectal, sociolinguistic, and comparative, and information from various Spanish-speaking regions has been gathered. In fact, careful attention has been given to represent the range of Spanish-speaking territories. In order to arrive to a macroregional sociolinguistics, it cannot be sufficient to only examine sets of equivalent data in each of the varieties. It is also necessary for the data to characterize truly comparable linguistic behavior from a quantitative and qualitative perspective. This is so for two reasons: first, because studies of different varieties, in distinct communities, can be influenced by the external and internal circumstances of the investigation, which are also occasionally unpredictable; second, because the feature under study can vary greatly with respect to its frequency, even when it occurs in linguistic contexts that are essentially identical. To assure sufficient comparability and to circumvent the most serious methodological limitations, triangulation is used. That is, data obtained through diverse techniques is compared and contrasted.
4.1. Data
In analyzing the social and linguistic aspects of null direct object use in Spanish, two types of data, aside from data in bibliographic sources, has been obtained. The first type is usage data, obtained from speakers in a semidirected interview, a type of data that is quite common in sociolinguistics. A particular limitation of this data is that opportunities for the use of the null object can vary dramatically from speaker to speaker and place to place. The other type of data is opinion data, obtained from surveys completed by Spanish speakers in 21 countries. For this, respondents provided their judgment regarding the use of the null object in a series of sentences that were constructed from actual examples of null object use in speech. The use of this spoken language data plants us firmly in the realm of variationist sociolinguistics. Furthermore, by giving space to speakers’ perceptions, we also find ourselves in the realm of cognitive sociolinguistics (Moreno-Fernández, Reference Moreno-Fernández2017). Let us turn now to a more detailed look at the methodological issues surrounding the collection of both types of data.
a) PRESEEA
The spoken language data for this study come from the international project called PRESEEA, that is, the Project for the Sociolinguistic Study of Spanish from Spain and America (Moreno-Fernández, Reference Moreno-Fernández, Takagaki, Zaima, Tsuruga, Moreno-Fernandez and Kawaguchi2005). This project represents the largest sociolinguistic corpus of spoken Spanish to date. In its final state, it will contain more than 20 million words from 40 different speech communities that represent every Spanish-speaking country. The implementation of this project is based on the work of 40 teams of researchers that have applied the same criteria for obtaining speech samples, from informant selection to the transcription of materials. Currently, PRESEEA’s webpage (preseea.linguas.net) provides searchable access, as well as sound files, for 10 communities in Colombia, Cuba, Spain, Mexico, Peru, Uruguay, and Venezuela. This methodology makes replication of analysis possible. The majority of PRESEEA’s spoken language materials were gathered between 2000 and 2012. Using this data, as well as previous literature, linguistic contexts that might encourage the use of the null direct object were identified, documented, and coded. These contexts became the basis for creating and selecting items for the opinion survey.
The spoken language PRESEEA interviews in which the occurrence of null direct object has been analyzed come from seven Spanish-speaking communities: Medellin (Colombia), Monterrey (México), La Habana (Cuba), Caracas (Venezuela), Lima (Peru), Montevideo (Uruguay) and Alcalá de Henares (Madrid, Spain). The total number of speakers considered for this analysis was 594: Medellin (108), Monterrey (108), La Habana (108), Caracas (108), Lima (54), Montevideo (54), Alcalá de Henares (54).
b) Opinion Survey
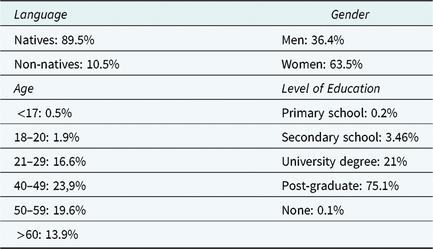
The opinion data for this study were obtained with an online survey using the platform Survey Monkey. The survey sought informants from the places in the world where Spanish is a vehicular language or else has a significant presence, including the United States, Andorra, and the Philippines. To maximize the reach of the survey, several techniques were used: it was sent via email to a mailing list (n = 950), a link to the survey was provided on the investigator’s personal webpage as well as other websites, and it was also spread on Facebook. The survey was accessible from 30 June 2015 to 13 September 2015. A total of 753 responses were received.Footnote 2 Respondents were both native and nonnative speakers of Spanish and residents and nonresidents in their country of origin. Their sociodemographic profile can be seen in Table 1.
Percent of survey responses according to gender, age, level of education and native language. N = 753

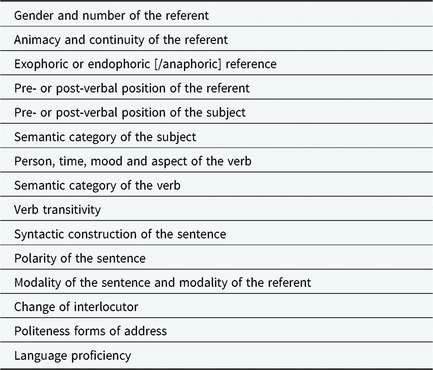
The survey was administered in two steps: a first and exploratory survey contained 120 items; the second and final step presented 70 items, which were finally analyzed (see the Appendix). The final survey could appear to be time-consuming but was not a difficult task. These items, either located in the literature or constructed, were selected to instantiate key conditioning linguistic and discursive variables, those considered most likely to probabilistically constrain the use of the null object. These 15 variables were identified via an examination of the literature as well as speaker utterances from the sociolinguistic interviews from PRESEEA. They appear in Table 2.
Variables that condition the appearance of the null object

For each survey item, respondents were asked: “Could you use this sentence naturally in some situation?” Possible responses were “Yes, I could use it” (coded as ‘1’) or “No, I’d never use it” (coded as ‘0’). In total, the 70-item survey thus produced a total of 14,000 responses for quantitative analysis. Responses showed there to be sufficient discursive and semantic diversity to trace variation in null object use across different speech communities. For instance, it was found that in 61% of survey responses, the null object was not acceptable. But on the other hand, this meant that respondents did consider its use acceptable about 39% of the time. Even this broad statistical figure suggests that for a phenomenon previously considered “marginal,” there remain many fascinating questions to be answered regarding its distribution and use in Spanish.
The use of internet surveys presents two principal limitations:
1. The first limitation is the inability to control for the sociodemographic traits of respondents. Particularly, and as pertains to this study, rates of return from country to country were unbalanced: 60% of the respondents were from Spain. This was probably to be expected, given that a great many individuals in the investigator’s mailing list were from Spain, more than from any other individual place. To compensate for this imbalance, just 50 surveys from Spanish informants were randomly selected for inclusion in the study. This was the number of surveys from the country with the second-highest rate of return, Mexico. Other imbalances in the sociodemographic composition of the informants were compensated for or neutralized in statistical analysis. Regarding the higher proportion of educated informants, due to the procedure for spreading surveys, it is assumed that up to now there are not resources enough to gather internet survey data from all the Spanish-speaking countries with the regular sociolinguistic guarantees, while those resources already exist for the United States (for instance, “Audience” service, linked to Survey Monkey). If I finally decided to assume a high proportion of educated informants, it was due to their acceptance of a phenomenon theoretically recognized as nonstandard. That fact can reinforce one of the main hypotheses of this work.
2. Second, incomplete surveys represent a noteworthy limitation. For this study, 20% of returned surveys were incomplete, leaving a total of 599 completed surveys. It may be that other survey platforms, such as Amazon Mechanical Turk, better reduce the number of incomplete surveys since respondents there are economically compensated for their participation. Nonetheless, the 20% attrition rate did not seriously hinder the representativeness of the data. After reducing the number of surveys from Spain, discarding incomplete surveys and, in the end, also eliminating those from places where Spanish is not the de facto language (to allow for comparability across contexts), opinion data included 200 surveys from native Spanish speakers residing either within or outside of their country of origin.
The survey items themselves also posed some methodological challenges. In particular, studying a nonexplicit phenomenon, a phenomenon associated with absence presents challenges both in locating relevant examples and also in data interpretation. Neither the interpretive challenge nor interest in null phenomena, however, is novel. In fact, sociolinguistics employs the Principle of Accountability, which requires implicit or nonuttered elements to be explicitly acknowledged in defining the phenomenon of interest. That is, understanding linguistic behavior requires analyzing both the contexts in which the phenomenon occurs, as well as where it does not.
4.2. Analysis
Survey data were subjected to increasingly detailed statistical analysis, only the most significant of which will be presented here. Firstly, survey items were examined in order to isolate those with variable rates of acceptance (rather than categorical responses, for example). Those items with null objects that showed variable acceptance or majority use (nitems = 17) were retained and became the basis of the core sample, which consisted of 200 responses per item: a set of 3,400 individual data. A logistic regression analysis (via Goldvarb Yosemite 2015) was performed on the core sample by geographic area and linguistic characteristics. The aim was to determine the variables that most conditioned their acceptability (Sankoff, Tagliamonte & Smith, Reference Sankoff, Tagliamonte and Smith2015). To discover which variables accounted most for the acceptability (dependent variable), a logistic regression analysis was performed, including responses for these 17 items (nresponses = 3,400), each of which was considered one factor of a single independent variable. Nonlinguistic independent variables included country of origin, level of education, and the sex of informants.
With respect to the data from the PRESEEA corpus, analysis considered null object use only in sentences that contained a verb of a specific type.Footnote 3 Specifically, the analysis focused on verbs of communication and language like agradecer ‘to thank’, contar ‘to count’, decir ‘to say’, explicar ‘to say’, pedir ‘to ask for’ / ‘to request’ and preguntar ‘to ask about’. Selection of these types was based on previous accounts by scholars, like Assela Reig Alamillo (Reference Reig-Alamillo2008, Reference Reig-Alamillo2009), who found that the null object was more likely to occur with verbs of communication and cognition. Limiting the contexts for analysis in this way allowed for a greater degree of comparability between different communities, since, individually, such verbs also show a high likelihood of use across all speakers and contexts.Footnote 4 Otherwise, it would be impossible to manage such a huge amount of data with origin in all kinds of verbs, contexts, countries, and speakers. I assume the limitation of my data, only compensated by a more detailed analysis. Ultimately, the number of tokens registered per community was as follows: Medellin (89), Monterrey (193), La Habana (119), Caracas (81), Lima (119), Montevideo (177), Alcalá de Henares (116). These tokens included null direct objects and potential null direct objects.
As a final step, data was triangulated by comparing survey responses to items involving verbs of communication and the PRESEEA data involving this same verb type. That is, actual use by speakers was compared with speakers’ perceptions. The degree of overlap between the two provides an indication of the direction and pace of a possible syntactic change involving null direct objects in Spanish. The survey and PRESEEA provided sufficient data to explore both a comparative sociolinguistic approach to Spanish as well as the use of the internet surveys as a data collection technique. It now remains to be seen how and when null objects in Spanish are in fact employed.
5. Null Direct Object in Spanish: Macroregional results
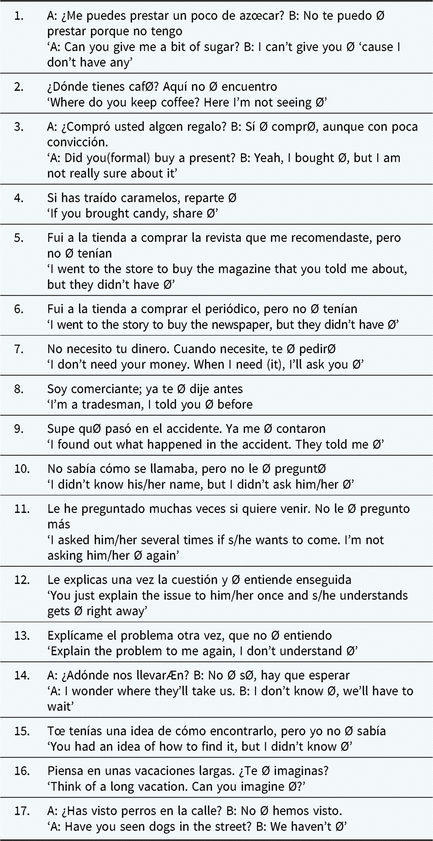
General statistics from the survey data suggest that the null object is not as marginal a phenomenon as might typically be thought. In fact, there were several survey items where the null object showed particularly high degrees of acceptance. Table 3 presents items with the highest rates of acceptance. These items come from studies already published about null direct objects in Spanish.
Survey items with greater null object acceptability.

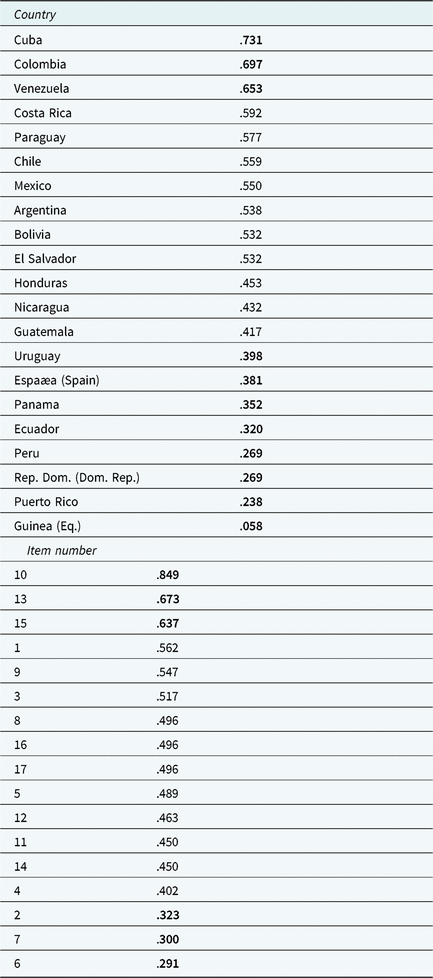
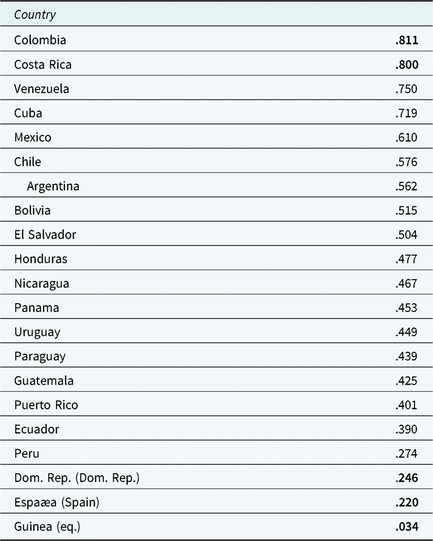
From these items, hypotheses about the linguistic factors that encourage null objects can begin to be generated. Note that the referents of null objects in these items are both specific (#7) and nonspecific (#17); verbs appear generally to be in the indicative and sentences themselves tend to be declarative (#8, 11). On the other hand, there seems to be no uniformity or general trends related to verbal time and aspect, nor verb type. Likewise, it does not appear at this point that the number of interlocutors, or the construction of the predicate, are important factors in null object use. However, these impressions must still be corroborated with statistical analysis that calibrates the weight of variables in conditioning speaker use acceptability. Results revealed that sex, age, and level of education do not condition the perception of null object use acceptability. The impact of linguistic variables like time and aspect of the verb is considered later. A respondent’s country of origin and the survey item, on the other hand, are predictors for null object acceptability. The factor weights for these variables can be seen in Table 4. Bolded values represent weights that were relevant as preferred or dispreferred. Weights closer to .5 indicate a lack of preference.
Probability of null object occurrence by country and item (survey data) (Logistic regression analysis, p = .000.). Input: .758. Tokens per item: 200. In “Item number” column, numbers refer to items in Table 3. Number of tokens per country (NDO): Cuba: 75/85; Colombia: 147/170; Venezuela: 100/119; Costa Rica: 82/102; Paraguay: 27/34; Chile: 306/391; Mexico: 594/765; Argentina: 379/493; Bolivia: 26/34; El Salvador: 13/17; Honduras: 36/51; Guatemala: 23/34; Uruguay: 101/153; Spain: 482/748; Panama: 21/34; Peru: 45/85; Dom. Rep.: 9/17; Puerto Rico: 25/51; Eq. Guinea: 3/17. Total number of tokens: 3400

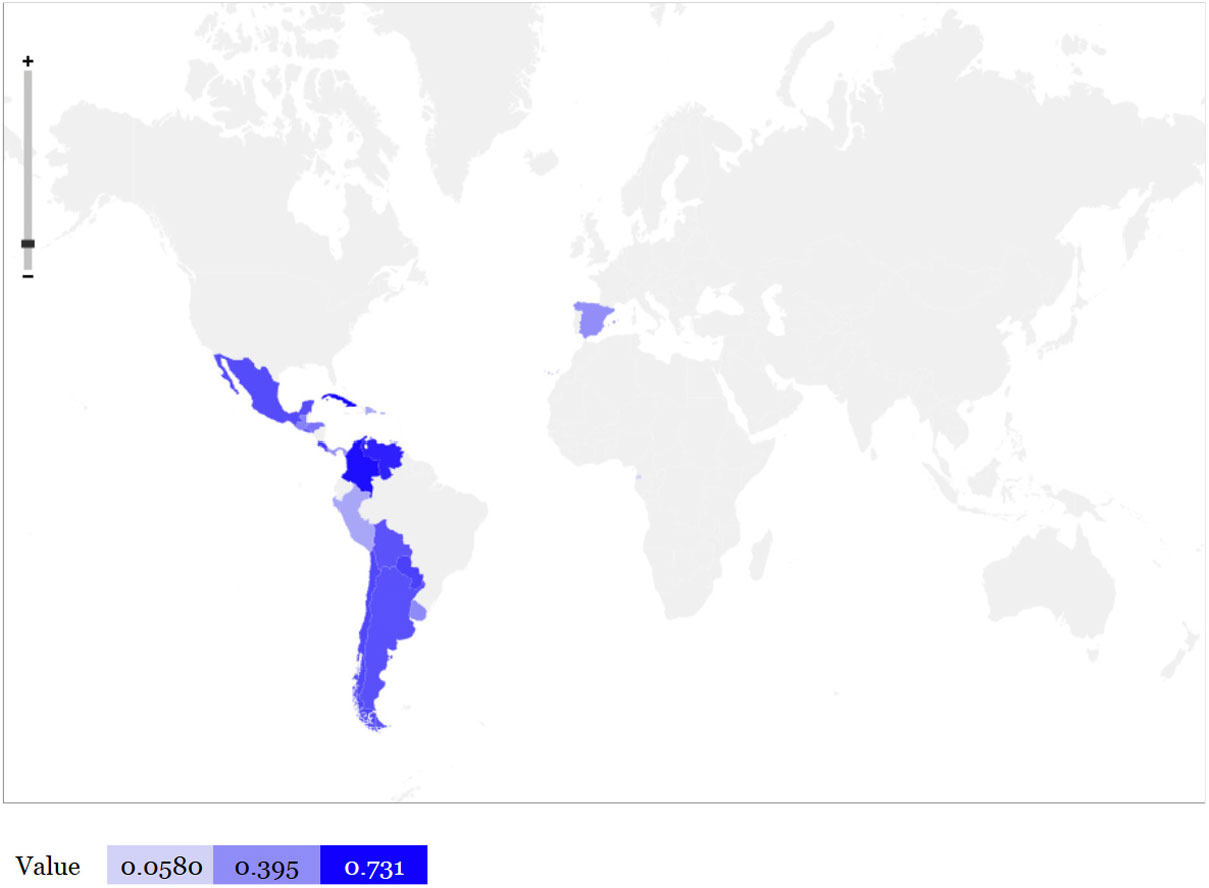
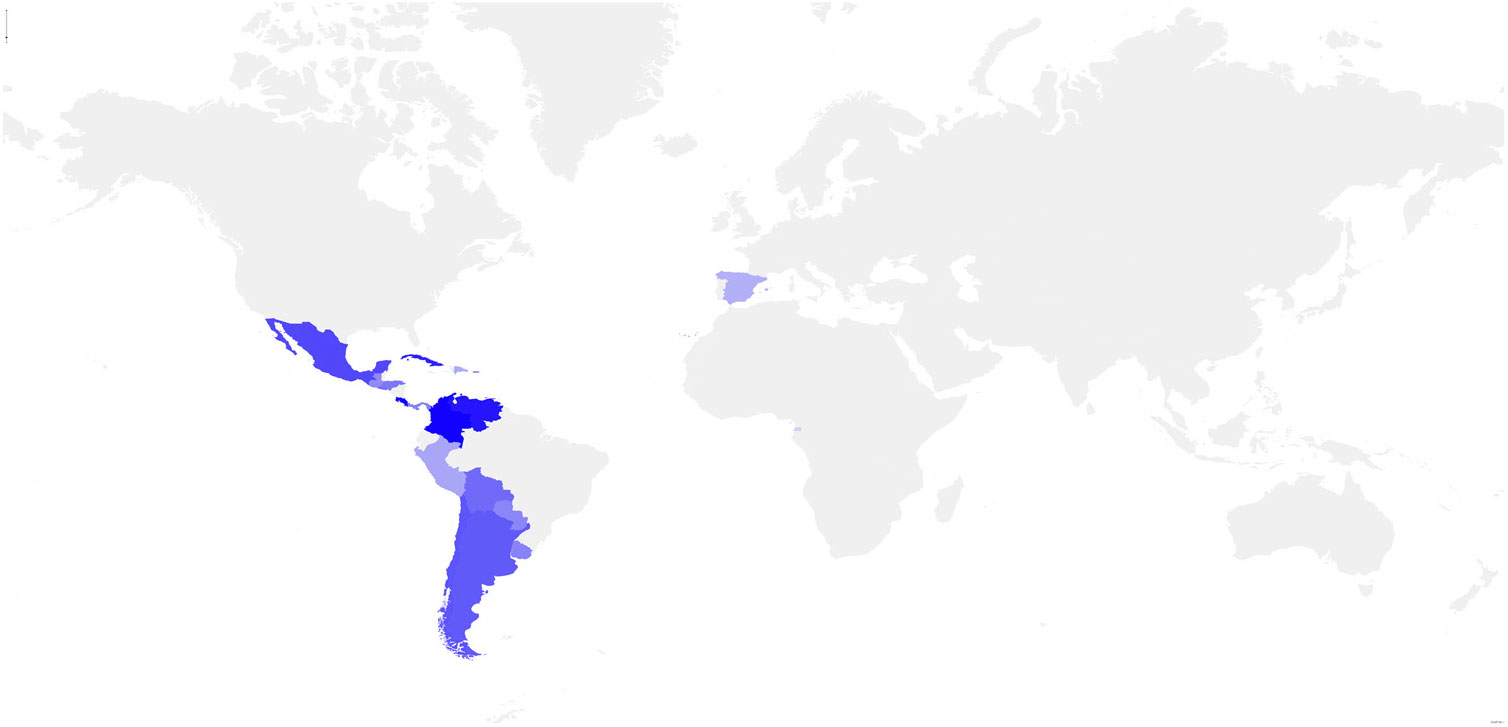
With respect to geography, we find that null objects are clearly preferred to a greater extent in countries like Cuba, Colombia, and Venezuela. They are dispreferred in areas like Guinea, Spain and a large part of the Caribbean, especially in the islands. In many areas, like Argentina, Bolivia, and Chile, the null object is neither favored nor disfavored. These data allow us to create a preliminary map showing relative preference (Map 1). Leaving aside the case of Equatorial Guinea, which would require a specific analysis due to its particular sociolinguistic situation, there are two geographic data points that ask for immediate attention. One is the probability of acceptability of the null object in Cuba. Null objects appear to be strongly favored in Cuba, yet the Caribbean islands generally, similarly to Spain, seem to be conservative in this respect; null objects in these regions are generally strongly dispreferred. The other data point of interest is the very low proportion of null object acceptability in Peru, where we are expecting to find that data from PRESEEA will actually show higher frequencies of null objects. It may have been the case, however, that respondents were monolingual Spanish speakers, rather than Quechua-Spanish bilinguals.
Probability of null direct object preference (survey data).Legend: Dark circle: .6-.7. Double circle: .4-.5. Split circle: .2-.3. White circle: .0-.1.http://www.openheatmap.com/view.html?map=PeriphytonsBrinjalsSalmi

On the other hand, an examination of the items themselves shows that some contexts prefer null objects to a greater than average extent, while in others its use tends to be dispreferred. Example 7 is a survey item where a null object was considered acceptable.
7
No sabía cómo se llamaba, pero no le Ø pregunté (.849) (Item 10 in Table 3)
‘I didn’t know his/her name[ACC, SING, MASC], but I didn’t ask him/her Ø’
Explícame el problema otra vez, que no Ø entiendo (.673) (Item 13 in Table 3)
Explain the problem[ACC, SING, MASC] to me again, I don’t understand Ø
Tú tenías una idea de cómo encontrarlo, pero yo no Ø sabía (.637) (Item 15 in Table 3)
‘You had an idea of [how to find him] but I didn’t know Ø’
Note, first, that in 7 the null object occurs with a verb of communication and cognition. The referent of the null object in two cases is a propositional phrase (introduced by cómo), and the anaphoric pronoun expected, if it were explicitly uttered, would be “lo.” In addition, the null object is clearly more probable when there is a dative pronoun (Reig-Alamillo, Reference Reig-Alamillo2009:391). Conversely, items where the null object was least favored, can be found in 8.
8
Fui a la tienda a comprar el periódico, pero no Ø tenían (.291) (Item 6 in Table 3)
‘I went to the store to buy the newspaper[ACC, SING, MASC], but they didn’t have Ø’
No necesito tu dinero. Cuando necesite, te Ø pediré (.300) (Item 7 in Table 3)
‘I don’t need your money[ACC, SING, MASC]. When I need (it), I’ll ask you Ø’
¿Dónde tienes café? Aquí no Ø encuentro (.323) (Item 2 in Table 3)
‘Where do you keep coffee[ACC, SING, MASC]? Here I’m not seeing Ø’
From these items, it can be observed that the referents of the null objects are inanimate but mostly specific in the speaker’s mind, although not always definite (Schwenter, Reference Schwenter, Face and Klee2006:27). Observe, too, that in these cases, the verbs are neither communicative nor are they verbs of cognition necessarily.
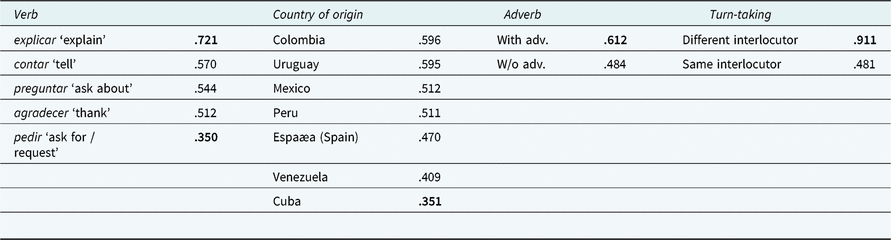
It now remains to examine the spoken language data. These data covered only contexts with verbs of communication, including agradecer ‘to thank,’ contar ‘to count,’ explicar ‘to explain,’ and preguntar ‘to ask about.’ The statistical analysis of this data included linguistic variables such as the person of the verb, the presence of an adverb, turn-taking, and verb polarity. It also took into account social variables like the community of origin, age, sex, and education. Of all of these, statistical analysis showed that social variables, where they operated, played only a secondary role in predicting the occurrence of null objects. Rather, what most influenced null object use was geography, the verb itself, the presence of an adverb and turn-taking (Sánchez-Ayala & Rivas, Reference Sánchez-Ayala and Rivas2015). These intriguing results are in Table 5. Again, significant factor weights are bolded.
Probability of null direct object by geography, turn-taking and verbs of communication (PRESEEA data) (Logistic regression analysis, p = 0.045). Input: .189. Total percentage of null objects: 21.1%. Tokens per-factor (NDO): explicar: 32/79; contar: 70/288; preguntar: 48/203; agradecer: 4/14; pedir: 35/310; Colombia: 24/89; Uruguay: 53/177; Mexico: 34/193; Peru: 24/119; Spain: 25/116; Venezuela: 13/81; Cuba: 16/119. With adv.: 38/107; W/o adv.: 151/787; different interloc.: 21/28; same interloc.: 168/866. Total of tokens: 894

Looking first at turn-taking, where there has been a change in interlocutor, Table 5 shows that the null object is far likelier to occur in those contexts (.911). There is no overlapping factor between this factor and countries of origin. Massullo (Reference Masullo2003) has pointed out that the change in turn itself might provide an opportunity to recuperate the referent of the null object. It could be a consequence of a close or cooperative involvement of interlocutors in the interaction, where the referents are clearly established and the antecedent easily accessible.
Looking now to the results for adverbs, the table shows that utterances that contain a predicate adverb also encourage the use of a null object (.612), although utterances without predicate adverbs do not significantly condition their presence either way. With respect to verbs themselves, two stand out. Explicar ‘explain’ clearly favors the null object (.721), while pedir ‘ask for / request’ clearly disfavors it (.350). Finally, it will be noticed that the verb decir ‘say’ is not present in the data. This verb was excluded for the present due to the high number of grammaticalized expressions in which it occurs, which would have skewed the analysis (see note 4). As regards country of origin, the table shows that the weights are not statistically significant, even for Peru. Regarding this particular factor, Cubans show the greatest dispreference (.351), presenting a leaning closer to Spain in this case, which could mean that the null object in Cuba is fluctuating between opposite tendencies, represented by Mexico and Spain, probably because of the particular sociopolitical history of Cuba in the last decades (Map 3). These results are commented further on in the discussion.
Map 3 embed code:
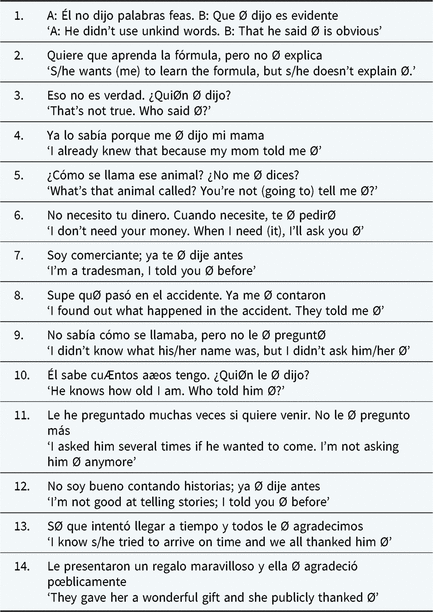
In order to procure greater clarity regarding conclusions of this study, as well as to overcome limitations of particular types of data, recall that triangulation of results was employed. Thus, the discussion turns now to a comparison of these PRESEEA results of use with those of opinion about acceptability, i.e., the survey data. To this end, only items with a verb of communication (decir among them) were analyzed. Considered items appear in Table 6.
Survey items with verbs of communication or language.

In order to compare use and acceptability data, another regression analysis was done on the survey data. This second analysis included both the social variables, which were earlier found not to affect null object preference, as well as all linguistic variables. The significant results of this logistic regression analysis are provided in Table 7. As before, the only two variables with any explanatory power for these survey items were country of origin and the survey item itself. No single linguistic or social variable significantly conditioned null object use, probably due to the very different geographic origin of data.
Probability of the null object preference with verbs of communication by geography and survey item (Logistic regression analysis, p = .001). Input: .567. Tokens per item: 200. In “Item number” column, numbers refer to items in Table 6. Tokens per country (NDO): Colombia: 113/140; Costa Rica: 66/84; Venezuela: 74/98; Cuba: 49/70; Mexico: 411/630; Chile: 201/322; Argentina: 241/406; Bolivia: 15/28; El Salvador: 7/14; Honduras: 24/42; Panama: 15/28; Uruguay: 63/126; Paraguay: 14/28; Guatemala: 14/28; Puerto Rico: 20/42; Peru: 25/70; Dom. Rep.: 4/14; Spain: 200/616; Eq. Guinea: 1/14. Total percentage of preference: 55.6%. Total number of tokens: 2800

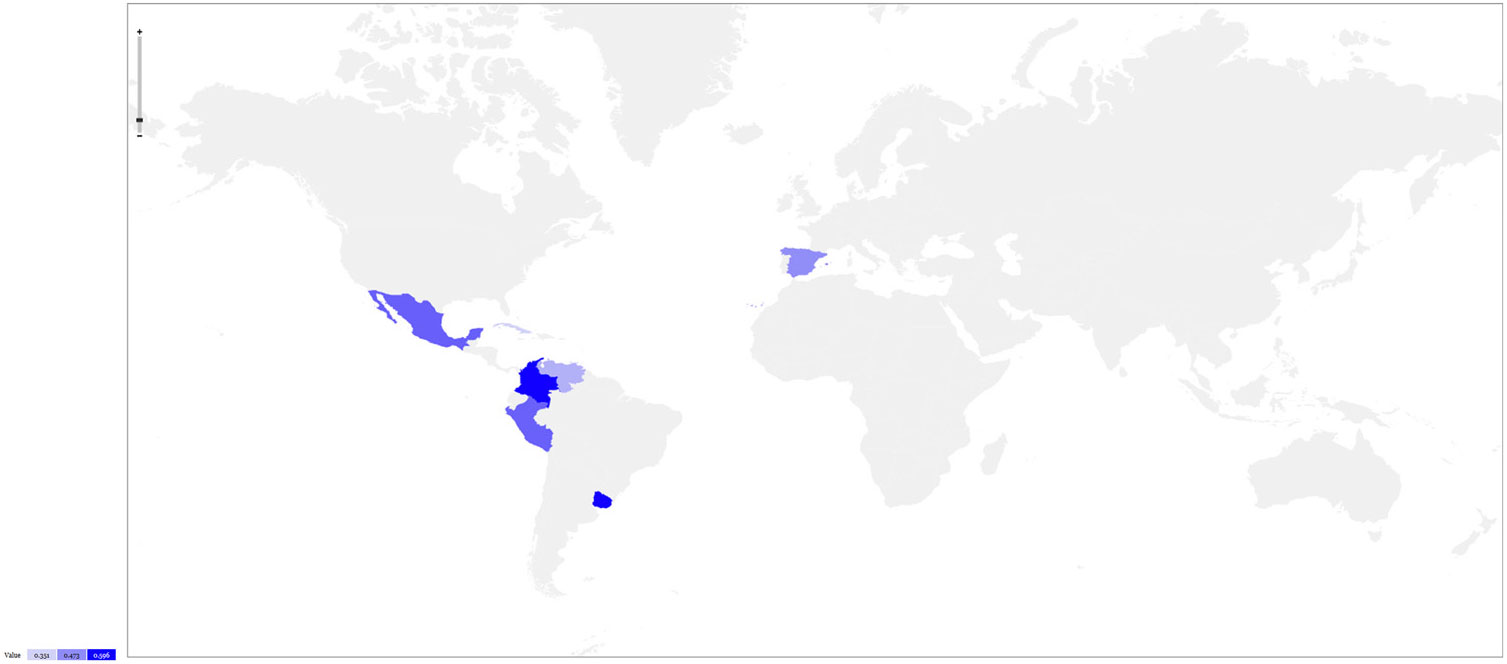
In examining the probability weights for each country, it can be seen that opinions about null object acceptability with verbs of communication are not much different from those seen when all kinds of verbs were included in the analysis. There is, nonetheless, a slight increase in preference for null objects, especially in Colombia and Costa Rica. These trends have been represented in Map 2, which depicts the strength of respondents’ preference for null objects in each country. Compare this with use data by country from the PRESEEA corpus in Map 3.
Probability of null object preference in survey items with verbs of communication (survey data).Legend: Black circle .6-.8; Double circle: .4-.5. Split circle .2-.3; White circle: .0-.1.http://www.openheatmap.com/embed.html?map=IntrasententialFozyBoot

Probability of direct object pronoun omission in spoken language with verbs of communication (PRESEEA data).Legend: Double circle: .5. Split circle: .4. White circle: .3.http://www.openheatmap.com/embed.html?map=DissemilativeNuzzersEmptiest

Most noticeable from a cursory comparison of these images is that the probabilities of actual use in the PRESEEA corpus, as depicted in Map 3 (data also in Table 5), are slightly less than what survey respondents indicated they considered to be an acceptable use of the null pronoun (Map 2). Overall, however, what can be observed across these data sets is great parity in the general shape of the data. That is, when countries are ranked by both the degree to which null objects are deemed acceptable and the probability of their actual use, an almost identical pattern can be seen: Spain has the lowest use and acceptability indexes compared to those in the Americas, especially compared to Colombia and Mexico, which all show higher use and acceptability tendencies.
Closer examination of the survey items suggests explanations that merit further exploration. For instance, in arranging the analyzed items according to the probability that a null object will be used, we find on one extreme, lower probability utterances, such as in 9, and on the other extreme, utterances of very high probability such as those in example 10.
9
A: Él no dijo palabras feas. B: Que Ø dijo es evidente (.061) (Item 1 in Table 6)
‘He did not use unkind words[ACC, PLURAL, FEM]. B: That he said Ø is obvious.’
No soy bueno contando historias; ya Ø dije antes (.234) (Item 12 n Table 6)
‘[I’m not good at telling stories]; I told you Ø before’
10 No sabía cómo se llamaba, pero no le Ø pregunté (.853) (Item 9 in Table 6)
‘I didn’t know [what his/her name was], but I didn’t ask him/her Ø’
Le he preguntado muchas veces si quiere venir. No le Ø pregunto más (.836) (Item1 in Table 6)
‘I asked him several times [if he wanted to come]. I’m not asking him Ø anymore’
In 10, probabilities exceed .8. That is, they showed high tendencies to be considered acceptable. Notice that those examples show a dative pronoun which, as previously mentioned, creates conditions conducive to the omission of a pronominal object. In turn, in the examples with lower probabilities of acceptance, those of 9, with rates less than .25, the referent can be considered as specific (9: unkind words). Such tendencies have, of course, been noted in previous studies (Schwenter, Reference Schwenter, Face and Klee2006). The remarkable thing here is the ample empirical basis on which these patterns are grounded. The examples here presented, although necessarily brief, are representative of a big data set and reflect tendencies in Spanish from a wide and diverse range of geographic origins.
6. Discussion: The Dialectal Complexity of Spanish
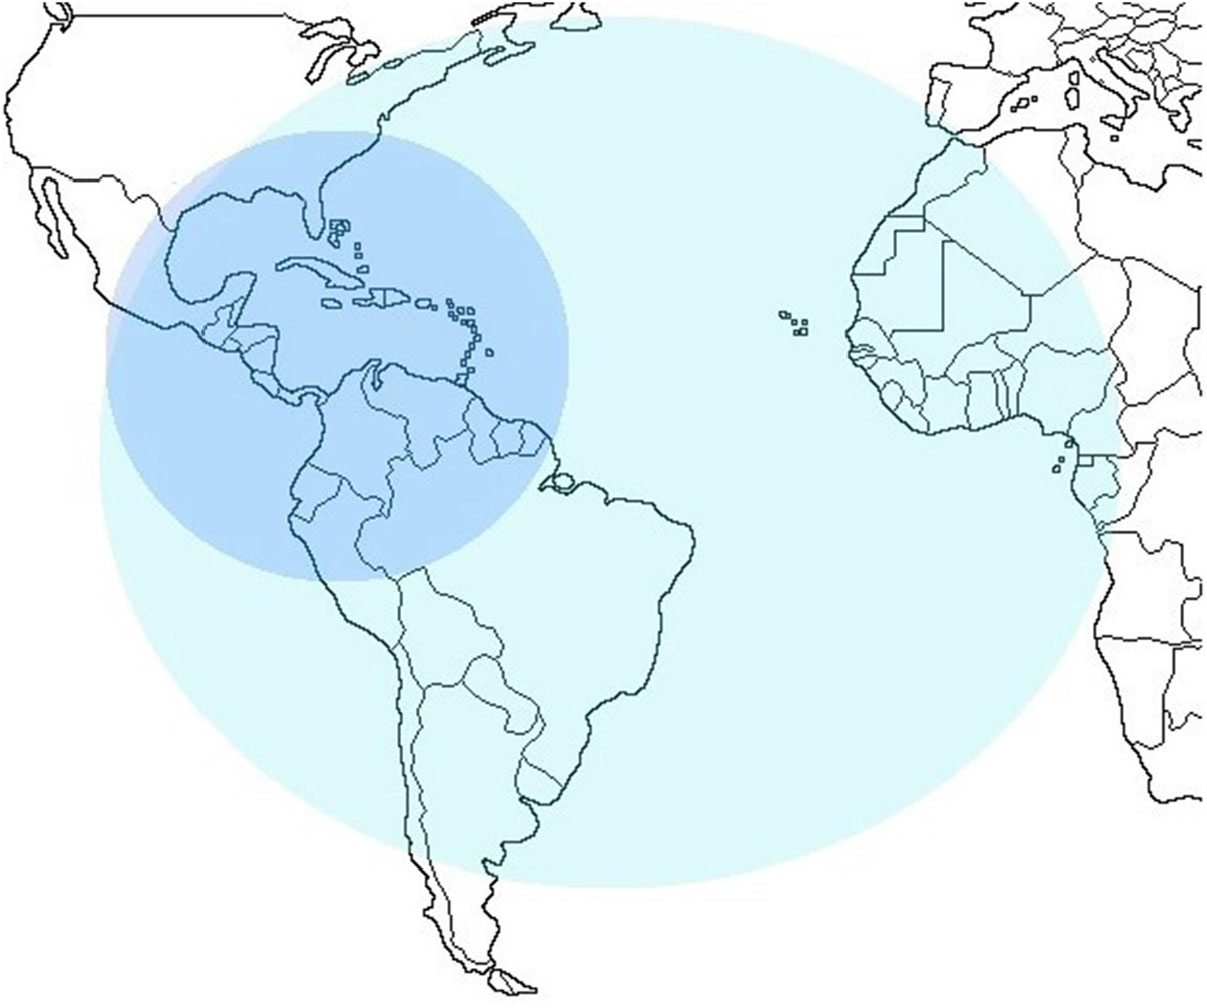
The social, geographic, and linguistic information considered in this multilectal analysis of the null object in Spanish offers a considerable foundation for proposing some noteworthy conclusions, several of which were in line with the hypotheses put forth earlier in this paper. We have seen that, as regards pronominal direct objects in Spanish, we may be witnessing a syntactic change, which itself manifests as synchronic variation across expansive areas of the Spanish-speaking world. The most innovative areas are located around Mexico and the continental Caribbean and close to the Andean region. If this area were taken to be central to Spanish geography, it could be said that the peripheral areas (Spain, Chile) show more conservative tendencies in null object use. That is, peripheral areas opt more frequently to use an explicit, not null, direct object pronoun, especially in Spain, Equatorial Guinea, and the eastern Caribbean (Map 4). In general terms, central areas used to be linguistically more dynamic, because they receive various and cross-linguistic influences, as the Caribbean and Andalusian history shows (Moreno-Fernández, Reference Moreno-Fernández2016). At the same time, these dynamic environments use to perceive a lesser pressure from the standard paradigm, as occurs in the areas of language contact. From this perspective, it should be taken into account that the null direct object is not necessarily recognized as a standard feature of Spanish syntax. A more detailed analysis would be needed in order to explain particular circumstances, like those of Cuba or Uruguay.
Innovation focus in Spanish-speaking countries.

In addition, it has been shown that variation in null object use is most strongly conditioned by semantic and discursive factors. The null object is avoided when the referent is animate, but it is more likely to occur when its referent is nonanimate and singularly nonspecific, and when it is propositional. At the same time, the presence of a dative complement, the presence of an adverb, and turn-taking also favor the direct object omission. No concrete syntactic rule seems to operate on the process. We have found, further, that null object use appears not to be conditioned by external factors: speaker traits such as sex, age or education. With these results in hand, we are able to support the observation made by both Wolfram and Fasold (Reference Wolfram and Fasold1974) and Bresnan and Ford (Reference Bresnan and Ford2010) that macroregional varieties differ not with respect to the syntactic constraints that operate in them, but rather in the probability that a particular syntactic structure would appear. In other words, what unites these varieties of Spanish is the fact that in all of them the appearance of null objects is conditioned by a similar set of constraining factors (i.e. semantic, contextual and discourse), although they differ in the extent to which the constraining factors are applied.
From a methodological point of view, the comparison of both opinion data and use data has suggested that, in surveys, speakers’ opinions about behavior are more permissive or tolerant of the analyzed linguistic change than what their actual behavior manifests. Together this creates a dynamic tension between the null and explicit object that seems to be at the core of variation and change. It is precisely the presence of this tension, the coexistence of countervailing forces that allows for the possibility that in one area or variety we find a feature to manifest a high degree of diffusion and an accelerated pace of change, while in other areas we find that same feature to be not only less diffused but also that change, in fact, appears to have been arrested.
Just ten years ago, it was believed that the null direct object in Spanish was limited to contact settings, where speakers of other languages, like Guarani, Basque, and Quechua, for instance, would be found. Through possibilities afforded by the use of international surveys, though, we have been able to confirm that the null object is present in practically every Spanish-speaking territory of the world, albeit with different degrees of social diffusion, use, and intensity. In fact, Mexico, Central America, the Andean region and the continental Caribbean, where individuals are not necessarily bilingual, show an advanced use of the null object. Nevertheless, it could be those contact situations, in Spain or in different American countries, act as a catalyst for the change and therefore accelerates it in those varieties.
Given that null objects are used not only in contact varieties of Spanish but also in geographically distant varieties and in other Romance languages, their occurrence in Spanish could be interpretable as a general tendency toward the simplification of predicates in central Romance territories, as compared, say, to central Romanic spaces where we might find Catalan, French and Italian. This interpretation would be supported by what Du Bois (Reference Du Bois1987) called ‘preferred argument structure’. According to that, most utterances consist of a verb with one full argument. Other arguments are either reduced to clitic or affix status or omitted entirely (Newmeyer, Reference Newmeyer2003:5). The contributions that Spanish makes with respect to the null direct object does not reach the same intensity as in Brazilian Portuguese, nor does it offer options like substituting stressed pronouns for unstressed ones.Footnote 4 Despite what, in Spanish, appears to be a much more circumscribed tendency toward the omission of pronouns (Fernández de Castro Reference Fernández de Castro and Santamaría2015:298), it seems to be a phenomenon that is nonetheless progressing with time, especially in the case of “lo”.Footnote 5
Considering that null objects appear not only in contact areas but in monolingual areas as well, we might then elaborate a constellation of factors that apply to all Spanish-speaking areas and that explain relative differences in its use across those spaces. That this would be possible is suggested by the conspicuous fact that the geographic oscillations in the use of the null object coincide either partially or totally with the geographic variation that attends other observed changes and variations in Spanish. We need only to think of the associations between Caribbean speech or Canary Island speech and particular linguistic features, like syllable-final /s/-lenition or intonational patterns (Medina López, Reference Medina López2000), or the measured speech of South America in general, or the many shared features of Central American and Mexican speech (Moreno-Fernández, Reference Moreno-Fernández2016). Even where we accomplish this considerable task of identifying in Spanish the principal factors that would illuminate the relationship between several linguistic features in the process of change, both within a variety and across varieties, it must be reiterated that our phenomenon, the simplification of predicate arguments, is of a polycentric character (Soares da Silva Reference Soares da Silva2014). It appears to be a polycentrism that, rather than presenting a centrifugal movement, rather than producing a “center of centers”, it instead appears to be of a general character. It seems to be a “multivalent” polycentrism, which reveals Spanish to be a dialect complex or network.
7. Conclusion
While in pursuit of the nature of a particular syntactic phenomenon in Spanish, the null direct object, this paper has touched on the role of comparison in sociolinguistics. Comparison, a foundation of the sociolinguistic enterprise, allows us to understand the dynamics of widely spoken languages, even in contexts such as the present one, where what are properly considered to be social factors have not been decisive in explaining the distribution of the phenomenon under investigation. The comparative principle also undergirds use of new techniques that advance and facilitate data collection across wide linguistic areas.
Regarding the null direct objects in Spanish, the analysis of international data shows that omission is present in all the Spanish-speaking territories. That phenomenon does not seem conditioned by either social variables or specific syntax conditions, but by semantic, discourse, and contextual variables. Some of the most determinant factors for direct object omission are the nonspecific nature of the object, the type of verb (e.g. explicar), the presence of a dative pronoun in the sentence, the presence of an adverb, a propositional phrase as antecedent, and the change of speaker. All these variables act in different ways depending on geography. Null direct object areas spread to a certain extent throughout the Spanish-speaking world but unevenly so. That omission is present in monolingual and bilingual areas, as Reig Alamillo and Schwenter (Reference Reig Alamillo, Schwenter, Holmquist, Lorenzino and Sayahi2007) have suggested. Nevertheless, it could be that contact situations, in Spain or in various Latin American countries, act as a catalyst for the change and therefore accelerate it in those varieties.
The macroregional methodology presented here also facilitated an examination of the performance of surveys as a data collection tool, both as regards its efficacy for transnational investigations and for the collection of grammatical data. The use of international survey data can complicate analysis due to the presence of factors that are difficult to control and due to the sheer number of variables that could be considered. In such cases, it is not only convenient but necessary to limit the quantity of data in a way consistent with the details of the investigation being carried out.
Besides, it has been shown that data gathered with opinion surveys, which are close to grammaticality judgments, seem to reflect more clear tendencies. While this method of data collection has its limitations like any other, it appears nonetheless to lend a sufficient degree of accuracy to the conclusions that can be reached, and it offers a means for triangulation with other methods of investigation. International surveys, which information technology allows us to take advantage of with relative ease, will likely continue to bring new and useful data to bear on sociolinguistic work.
Supplementary material
To view supplementary material for this article, please visit https://doi.org/10.1017/jlg.2019.5. Data included in Tables 4, 5 and 7 could easily be transferred to an Excel spreadsheet in order to create dynamic maps through the website www.openheatmap.com. A dynamic map is an interactive map where the user can freely pan and zoom, as well as select different outputs and skins.
Appendix
Items Included In A Macro-regional Survey On Null Direct Objects In Spanish
1. A: ¿Me puedes prestar un poco de azúcar? B: No te puedo prestar porque no tengo
Sí, podría usarla
No, nunca la usaría
2. La sala tenemos que barrer todos los días
Sí, podría usarla
No, nunca la usaría
3. Tengo las fotos, pero no te quiero mandar. Salieron feas
Sí, podría usarla
No, nunca la usaría
4. Si me compro una moto, pienso usar todos los días
Sí, podría usarla
No, nunca la usaría
5. A mi mamá se le quedó un poco mal cerrado el armario y logré abrir
Sí, podría usarla
No, nunca la usaría
6. A la chica he visto en misa
Sí, podría usarla
No, nunca la usaría
7. No conozco a la novia de José. ¿Usted conoce?
Sí, podría usarla
No, nunca la usaría
8. A: ¿Llevaste la compra a tu mamá? B: Sí, llevé
Sí, podría usarla
No, nunca la usaría
9. A: ¿Traes la comida? B: Traigo
Sí, podría usarla
No, nunca la usaría
10. A: ¿Hubo cerveza en la fiesta? B: Sí, además conozco al muchacho que trajo
Sí, podría usarla
No, nunca la usaría
11. Las instrucciones yo nunca entendí
Sí, podría usarla
No, nunca la usaría
12. A: Él no dijo palabras feas. B: Que dijo es evidente.
Sí, podría usarla
No, nunca la usaría
13. Las cosas de niños nadie entiende
Sí, podría usarla
No, nunca la usaría
14. Compramos las frutas en el mercado y pusimos encima de la mesa
Sí, podría usarla
No, nunca la usaría
15. Si le tenías que besar la mano, tú le besabas
Sí, podría usarla
No, nunca la usaría
16. A: ¿Quién ha puesto esa música? B: Juan puso
Sí, podría usarla
No, nunca la usaría
17. Pudimos comprar entradas porque encontramos baratas
Sí, podría usarla
No, nunca la usaría
18. A: ¿Compraste aquella cerveza? B: Sí, compré para que bebiera tu hermano
Sí, podría usarla
No, nunca la usaría
19. Fui a la tienda a comprar la revista que me recomendaste, pero no tenían
Sí, podría usarla
No, nunca la usaría
20. Quiere que aprenda la fórmula, pero no explica
Sí, podría usarla
No, nunca la usaría
21. Le explicas una vez la cuestión y entiende enseguida
Sí, podría usarla
No, nunca la usaría
22. Yo siempre cuido a mis niños y he llevado al hospital si estaban enfermos
Sí, podría usarla
No, nunca la usaría
23. Ayer me saludó José; no sé si viste
Sí, podría usarla
No, nunca la usaría
24. A: ¿Conoce usted a mi primo? B: No, no conozco
Sí, podría usarla
No, nunca la usaría
25. Eso no es verdad. ¿Quién dijo?
Sí, podría usarla
No, nunca la usaría
26. Y eso, ¿por qué hacen?
Sí, podría usarla
No, nunca la usaría
27. ¿Dónde tienes café? Aquí no encuentro
Sí, podría usarla
No, nunca la usaría
28. ¿Le retiro, señor?
Sí, podría usarla
No, nunca la usaría
29. Ya lo sabía porque me dijo mi mamá
Sí, podría usarla
No, nunca la usaría
30. ¿Cómo se llama ese animal? ¿No me dices?
Sí, podría usarla
No, nunca la usaría
31. Yo lo supe ayer, ¿pero él cómo supo?
Sí, podría usarla
No, nunca la usaría
32. No necesito tu dinero. Cuando necesite, te pediré
Sí, podría usarla
No, nunca la usaría
33. El libro ¿cuándo leyó usted?
Sí, podría usarla
No, nunca la usaría
34. Me agarró el collar y me rompió
Sí, podría usarla
No, nunca la usaría
35. A: ¿Has visto perros en la calle? B: No hemos visto.
Sí, podría usarla
No, nunca la usaría
36. A: ¿Compró usted algún regalo? B: Sí compré, aunque con poca convicción.
Sí, podría usarla
No, nunca la usaría
37. Fui a la tienda a comprar el periódico, pero no tenían
Sí, podría usarla
No, nunca la usaría
38. Fui a la biblioteca a recoger mi libro, pero no tenían
Sí, podría usarla
No, nunca la usaría
39. Si quieren el postre, ya traigo
Sí, podría usarla
No, nunca la usaría
40. Todo lo que había que decir ya dije
Sí, podría usarla
No, nunca la usaría
41. Explícame el problema otra vez, que no entiendo
Sí, podría usarla
No, nunca la usaría
42. A: ¿Adónde nos llevarán? B: No sé, hay que esperar
Sí, podría usarla
No, nunca la usaría
43. Yo no sé qué pasó entre Juan y Pablo porque no vi
Sí, podría usarla
No, nunca la usaría
44. Soy comerciante; ya te dije antes
Sí, podría usarla
No, nunca la usaría
45. Juan cree que los niños son buenos, pero yo no creo
Sí, podría usarla
No, nunca la usaría
46. Supe qué pasó en el accidente. Ya me contaron
Sí, podría usarla
No, nunca la usaría
47. No sabía cómo se llamaba, pero no le pregunté
Sí, podría usarla
No, nunca la usaría
48. Él sabe cuántos años tengo. ¿Quién le dijo?
Sí, podría usarla
No, nunca la usaría
49. Tú tenías una idea de cómo encontrarlo, pero yo no sabía
Sí, podría usarla
No, nunca la usaría
50. A: ¿Cuánto dinero tenemos? B: Solamente tú sabes
Sí, podría usarla
No, nunca la usaría
51. ¿Vivir solo? No imagino
Sí, podría usarla
No, nunca la usaría
52. Le he preguntado muchas veces si quiere venir. No le pregunto más
Sí, podría usarla
No, nunca la usaría
53. Sabía dónde podía encontrarla, pero no sabía exactamente
Sí, podría usarla
No, nunca la usaría
54. No soy bueno contando historias; ya dije antes
Sí, podría usarla
No, nunca la usaría
55. ¿Las fotos? Mis padres quieren que les mandemos aunque estén desenfocadas
Sí, podría usarla
No, nunca la usaría
56. A: Tengo una pastilla para dormir. B: No te tomes, te va a hacer mal
Sí, podría usarla
No, nunca la usaría
57. Esta pobre no tiene un vestidito; a ver si entre todos los hermanos le compran
Sí, podría usarla
No, nunca la usaría
58. Las ballenas escasean y es difícil encontrar en el mar
Sí, podría usarla
No, nunca la usaría
59. ¿El paquete? Dale enseguida a la señora
Sí, podría usarla
No, nunca la usaría
60. Si has traído caramelos, reparte
Sí, podría usarla
No, nunca la usaría
61. El libro, ¿cuándo le vas a dar al profesor?
Sí, podría usarla
No, nunca la usaría
62. No vayas a ver esa película porque no vas a entender
Sí, podría usarla
No, nunca la usaría
63. A: ¿Viste Superman 2? B: Sí, fui a ver con Julia
Sí, podría usarla
No, nunca la usaría
64. Conozco a una persona que sabe inglés. ¿Quieres entrevistar?
Sí, podría usarla
No, nunca la usaría
65. ¿Le molesta a tu hermana el perro? Dile que no vamos a llevar y ya está
Sí, podría usarla
No, nunca la usaría
66. A: ¿Ha visto a un niño que lleva un abrigo azul? B: Sí, acabo de ver pasar
Sí, podría usarla
No, nunca la usaría
67. Ese motor produce una presión que es capaz de hacer explotar en cualquier momento
Sí, podría usarla
No, nunca la usaría
68. Las elecciones, yo nunca entendí
Sí, podría usarla
No, nunca la usaría
69. Me dejaban el document para que yo viera
Sí, podría usarla
No, nunca la usaría
70. Yo no he hecho adrede
Sí, podría usarla
No, nunca la usaría