


Highlights
-
• Eligibility for anti-amyloid therapy in Canada requires determination of APOE ε4 allelic status.
-
• Plasma APOE ε4 immunoassays (i.e., proteotyping) represent a rapid and high-throughput approach.
-
• Proteotyping can be used to rule-out APOE ε4 homozygosity (NPV 100%); however, results indicating homozygosity should be confirmed by an alternate method.
Introduction
Anti-amyloid therapies such as lecanemab and donanemab have emerged as treatments for Alzheimer’s disease (AD), with several others in the therapeutic pipeline. Both selectively target amyloid-β aggregates, slowing clinical decline by ∼27–35% over 18 months.Reference van Dyck, Swanson and Aisen1,Reference Sims, Zimmer and Evans2 Their use is associated with a spectrum of cerebrovascular complications collectively termed amyloid-related imaging abnormalities (ARIA), ranging from incidental, asymptomatic microhemorrhages to severe vasogenic edema requiring urgent intervention.Reference Salloway, Wojtowicz and Voyle3,Reference Roytman, Mashriqi and Al-Tawil4 ARIA frequently requires treatment interruption or discontinuation. In rare instances, when misdiagnosed, particularly when mimicking ischemic stroke, ARIA can lead to irreversible neurological injury or fatal intracerebral hemorrhage.Reference Barakos, Purcell and Suhy5–Reference Ryan, Feng and Liu7
The apolipoprotein E ε4 allele (APOE4) is the strongest risk factor for ARIA. In phase 3 clinical trials for lecanemab and donanemab, ARIA incidence ranged from 8.0 to 9.5% for the placebo groups and 21.5–38.9% for the treatment groups. For the treatment groups, ARIA incidence was highest among E4 homozygotes (>40%), followed by heterozygotes (E3/E4 and E2/E4) at 20–30% and non-carriers at 10%.Reference van Dyck, Swanson and Aisen1,Reference Sims, Zimmer and Evans2 ARIA-E (vasogenic edema or sulcal effusions) occurred in 13–24% of treated participants and ARIA-H (microhemorrhages and hemosiderin deposits) in 17–31%. While most ARIA cases are asymptomatic, symptomatic ARIA affects 3–6% of treated individuals, typically emerging within the first three infusions. Symptomatic presentations include acute headache, confusion, visual disturbances or seizures and in rare cases can lead to significant neurological morbidity or life-threatening intracerebral hemorrhage.
MRI surveillance protocols for ARIA monitoring include serial imaging at baseline and during early treatment.Reference Paczynski, Hofmann and Posey8,Reference Zimmer, Ardayfio and Wang9 Discontinuation rates of 20–30% have been reported, often driven by ARIA management and logistical demands.Reference Paczynski, Hofmann and Posey8,Reference Bobbins, Davies, Lynn, Roy, Yeomans and Shakir10 These risks underscore the need for APOE4-informed treatment decisions, careful monitoring during therapy and prompt intervention when ARIA develops.Reference Salloway, Wojtowicz and Voyle3,Reference Roytman, Mashriqi and Al-Tawil4,Reference Cummings, Apostolova and Rabinovici11,Reference Wang, Serap Monkul Nery and Ardayfio12 Expert consensus recommends genotyping to guide ARIA risk assessment and treatment decisions, with evolving guidelines emphasizing genotype-informed eligibility, consent and dosing.Reference Doran and Sawyer6,Reference Cummings, Apostolova and Rabinovici11
The heightened ARIA risk in APOE4 carriers has a biological basis. Impaired perivascular clearance of solubilized amyloid aggregates and increased blood–brain barrier vulnerability in APOE4 carriers likely drives ARIA pathogenesis.Reference Steward, Biel and Dewenter13 Observational data also suggest that rapid plaque clearance exacerbates these effects.Reference Wang, Serap Monkul Nery and Ardayfio12 Longitudinal and cross-sectional biomarker studies indicate that 70–80% of APOE4 homozygotes in preclinical cohorts cross the amyloid positron emission tomography (PET) positivity threshold 10–15 years earlier than E3/E3 individuals. This accelerated amyloid accumulation is dose-dependent, with each APOE4 allele adding roughly 15 centiloids of amyloid-β burden in the brain (a standardized amyloid PET quantification scale where ∼20 centiloids typically defines PET positivity).Reference Steward, Biel and Dewenter13,Reference Young, Johns and Kennedy14 A 15-centiloid increment represents a meaningful increase in AD pathology; for reference, an increase of >5 centiloids per year is considered a “fast accumulator.”Reference Iaccarino, Burnham and Tunali15
While APOE4 is the strongest known genetic risk factor for AD, the E4 allele is neither necessary nor sufficient to cause AD.Reference Goldman, Hahn and Catania16 The knowledge of an individual’s APOE genotype does not independently guide clinical management. As such, determination of an individual’s APOE allelic status is not recommended for either predicting the development of AD or as a diagnostic biomarker due to limited actionable benefit.Reference Belloy, Napolioni and Greicius17,Reference Jack, Andrews and Beach18 As such, the arrival of anti-amyloid therapies and their APOE4-associated ARIA risk has created a new indication for determination of an individual’s APOE allelic status. In the context of pretreatment drug eligibility, risk counseling and imaging-based ARIA monitoring, rapid turnaround of APOE genotype is desirable.
In clinical laboratories, DNA-based methods, such as real-time polymerase chain reaction (PCR), have been commonly used for APOE genotyping. Proteotyping assays that measure apolipoprotein E (apoE) proteoform concentrations in blood represent an emerging alternative. Although mass spectrometry-based approaches have been described over a decade ago,Reference Martinez-Morillo, Nielsen and Batruch19 more recent immunoassay-based methods offer the practical advantage of compatibility with regulatory-approved automated random-access platforms, making them a scalable option for clinical laboratories. Initial studies using one such approach on the Fujirebio Lumipulse G1200 demonstrated variable performance ranging from perfect concordanceReference Musso, Cosma and Moz20 to small proportions of discordance with DNA-based genotyping.Reference Dittrich, Blennow and Tan21 Validation in large, independent and diverse cohorts is therefore needed, particularly given ARIA risks and anti-amyloid therapy restrictions for E4/E4 homozygotes.
We aimed to gain greater insight into the potential clinical utility of apoE4 proteotyping. This study evaluates the analytical and diagnostic performance of the Fujirebio Lumipulse G1200 assay for APOE4 allelic status, along with its clinical implications for anti-amyloid therapy eligibility and ARIA risk stratification in a Canadian cohort.
Methods
Study design
We conducted a single-center retrospective study. For the method comparison, we evaluated the performance of an automated proteotyping assay (Fujirebio Lumipulse G1200) for APOE genotyping against the reference standard of genotyping via PCR. The primary objective was to assess assay performance in the context of treatment eligibility and risk stratification for individuals considering anti-amyloid therapy.
This study was approved by the research ethics board of Providence Health Care Research Institute and the University of British Columbia. Specimens for this study originated from two sources in Canada – St. Paul’s Hospital Laboratory and the biobank of the Clinic for Alzheimer’s Disease and Related Disorders (CARD) at the University of British Columbia. Specimens had previously undergone APOE genotyping by PCR either as part of routine care (specimens from St Paul’s Hospital) or for research purposes (CARD).
Materials
The following materials were obtained from the indicated commercial sources (with catalog numbers noted): EDTA blood collection tubes (BD366643, Becton Dickinson), 1.5 mL and 2.5 mL polypropylene tubes (72.703.600 and 60.614.010, Sarstedt), intralipid (I141, Sigma–Aldrich) and PBS (P4417, Sigma–Aldrich). Proteotyping was performed on the Fujirebio Lumipulse G1200 automated chemiluminescent enzyme immunoassay system. ApoE4 concentration was determined using the Lumipulse G ApoE4 reagents (81453) and calibrators (81454), and total apoE concentration was determined using Lumipulse G Pan-apoE reagents (81449) and calibrators (81450). Additional proteotyping assay reagents, all from Fujirebio, included ApoE Controls (81452), Lumipulse G Substrate Solution (219973), Specimen Diluent 1 (219935), sample cups (80351) and Wash Solution (4008248). Additionally, in-house quality control (QC) material was created from EDTA plasma samples with known APOE genotypes, including a negative QC (E3/E3 genotype) and positive QC (E3/E4 genotype pool).
Assays were run according to the manufacturer’s instructions. The apoE4/total apoE ratio was calculated from the concentrations measured by the two immunoassays and interpreted using manufacturer-defined thresholds for APOE4 allelic status determination: <5% non-carrier, 5–74% heterozygote and ≥75% homozygote. Although both assays report in μg/mL, they employ antibodies targeting different apoE epitopes and capture different apoE proteoforms. The reported concentrations therefore represent immunoreactivity-based concentrations rather than absolute molar concentrations. The apoE4/total apoE ratio serves as a relative index to infer genotype rather than a true mass fraction, and values exceeding 100% are possible.
APOE genotyping was performed by real-time PCR. St Paul’s Hospital samples were analyzed on the Roche LightCycler 480 II system using MagNA Pure DNA extraction (07658036001, Roche), and in-house master mix with oligonucleotide probes (Metabion). CARD biobank samples were analyzed on the StepOnePlus PCR system (4376600, Applied Biosystems), using the AutoGenFlex STAR extraction system (51206, Qiagen) and TaqMan assay mix for SNPs rs7412 and rs429358 (4351379, Thermo Fisher Scientific). QC included negative controls and previously characterized positive control samples.
All plasma specimens were collected in EDTA tubes following standard laboratory procedures and stored according to site-specific protocols. Specimens from St Paul’s Hospital were refrigerated (2–8°C) prior to genotyping and subsequently frozen at −20°C. For proteotyping, whole blood was equilibrated to room temperature (30 min), centrifuged at 2095 g for 5 min, and then plasma aliquoted to 1.5 mL tubes and stored at −80°C. Specimens from CARD were aliquoted (1.5 mL tubes) as both whole blood (for genotyping) and plasma (for proteotyping) and frozen at −80°C. Prior to proteotyping, plasma was equilibrated to room temperature and mixed by gentle inversion and then transferred into Fujirebio sample cups for analysis.
Analytical validation
Analytical validation of the proteotyping assay followed Clinical & Laboratory Standards Institute Guidelines and included evaluation of assay precision, matrix interference and sample stability. Intra-run, inter-run and total imprecision was assessed by analyzing the in-house positive and negative QC plasma pools in triplicate on three different days. Interference from hemolysate and lipemia was assessed by testing a series of APOE4 carrier samples spiked with hemolysate and intralipid, respectively, with each interference condition tested in duplicate. Freeze–thaw stability was assessed to four freeze–thaw cycles, using the in-house positive QC pool.
For hemolysate interference experiments, hemolysate was prepared from washed red blood cells lysed by freeze–thaw and vortexing and then centrifuged to remove debris. To 150 μL aliquots of an E3/E4 plasma pool, 50 μL of hemolysate spiking solution and Lumipulse Specimen Diluent were added to achieve final hemoglobin concentrations of 0, 0.50, 1.50, 2.50 and 5.25 g/L, tested in duplicate. For lipemia interference experiments, intralipid was spiked into E3/E4 plasma pools. To 150 μL aliquots, 50 μL of intralipid and Lumipulse Specimen Diluent were added to achieve final concentrations of 0, 125, 250, 500 and 1000 mg/dL, tested in duplicate.
Method comparison: proteotyping versus genotyping
For the method comparison, samples were selected as samples of convenience with the following inclusion criteria: (1) prior APOE PCR genotyping result and (2) minimum available plasma volume of 200 μL. Exclusion criteria included plasma with hemolysis exceeding ∼5.25 g/L of hemoglobin and/or lipemia equivalent to or greater than 500 mg/dL of intralipid, by visual inspection.22 All proteotyping analyses were performed with the operator blinded to PCR results and to any information about the sample origin or patient characteristics. Discordant samples were re-analyzed by proteotyping: all repeats confirmed the initial findings.
Data analysis
Intra- and inter-run precision was expressed as the percent coefficient of variation (% CV, Table 1). The thresholds for nonsignificant matrix interference and acceptable sample stability were results within ±20% deviation from the baseline measurement. In the method comparison, discordance was defined as a mismatch in APOE4 allelic status, with the overall agreement percentage between proteotyping and PCR reported. ApoE4 concentrations by genotypic group were compared using the nonparametric Mann–Whitney U test (two-tailed) and total apoE concentrations using the Kruskal–Wallis test, followed by Dunn’s post hoc test for multiple comparisons. Concentrations by group and subgroup are reported as the median and the interquartile range (IQR), or simply the range if there were fewer than 10 observations. All confidence intervals (CIs) reported are 95% CIs and calculated using Wilson–Brown method. Statistical significance was defined as p ≤ 0.05. Statistical tests and graphs were generated in Prism (version 10.6.1).
Precision of the apolipoprotein E ε4 (apoE4) and total apolipoprotein E (apoE) assays (expressed as % coefficient of variation [CV]) using quality control material made from human plasma with E3/E4 (QC+) and non-E4 (QC−) genotypes

Table 1. Long description
A table comparing the precision of apolipoprotein E4 (ApoE4) and total apolipoprotein E (ApoE) assays using quality control material with E3/E4 (QC+) and non-E4 (QC-) genotypes. The table has two main sections: QC+ (E3/E4) and QC- (non-E4). Each section lists three analytes: ApoE4, Total ApoE, and ApoE4/total ApoE. For each analyte, the table provides the mean concentration (µg/mL) or ratio ± standard deviation (SD), and the coefficient of variation (CV) percentages for within-run, between-run, and total variability. The QC+ section shows mean concentrations of 3.74 ± 0.32 for ApoE4, 7.89 ± 0.32 for Total ApoE, and 0.47 ± 0.03 for ApoE4/total ApoE, with corresponding CV percentages. The QC- section shows mean concentrations of 0.09 ± 0.03 for ApoE4, 17.60 ± 0.35 for Total ApoE, and 0.01 ± 0.002 for ApoE4/total ApoE, with corresponding CV percentages.
Results
Precision, matrix interference and sample stability
Total imprecision for the positive QC pool was 8.5% (apoE4), 4.0% (total apoE) and 6.4% (ratio) (Table 1). For the negative QC pool, total imprecision was 33.2% for apoE4 (reflecting noise and cross-reactivity), 1.7% for total apoE and 33.8% for the apoE4/total apoE ratio (Table 1). Every unique paired analysis (n = 9) for each QC material yielded the correct E4 allelic classification. No significant matrix interference was observed with hemolysate up to 5.25 g/L hemoglobin and intralipid up to 500 mg/dL (Figure 1A and B). Acceptable recovery to at least four freeze/thaw cycles was observed, except for one measurement (Figure 1C): the apoE4 measurement after the third cycle showed +120.6% recovery relative to baseline; however, the apoE4/total apoE ratio remained within the acceptability limits.
Matrix interferent tolerance and freeze/thaw stability of proteotyping immunoassays. (A) Percent recovery of apolipoprotein E ε4 (apoE4, blue circles), total apolipoprotein E (apoE, pink squares) and the apoE4/total apoE ratio (purple triangles) across increasing hemolysate concentrations (0–5.25 g/L of hemoglobin, with corresponding photos of samples analyzed). (B) Percent recovery with increasing concentrations of lipids (0–1000 mg/dL of intralipid, with corresponding photos of samples analyzed). (C) Percent recovery following successive freeze/thaw cycles. Dotted lines represent the ±20% acceptability range from baseline (i.e., 80%–120% recovery).

Proteotyping accuracy and classification performance
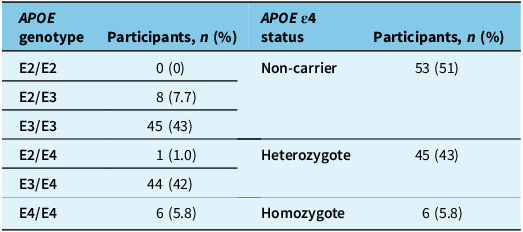
For the method comparison, a total of 104 EDTA plasma specimens were analyzed. Participants had a median age of 65 years (range: 26 to 97 years), 64 (61.5%) were female and the genotypic distribution is found in Table 2. Data on race and ethnicity was not accessible. E4 heterozygotes and homozygotes represented 43% and 5.8% of the cohort, respectively (Table 2).
PCR-based APOE genotype distribution among study participants

Table 2. Long description
A table comparing APOE genotype distribution among study participants. The table has four rows and five columns. Column headers are APOE genotype, Participants, n (%), APOE e4 status, and Participants, n (%). Row 1: APOE genotype E2/E2, Participants 0 (0 percent), APOE e4 status Non-carrier, Participants 53 (51 percent). Row 2: APOE genotype E2/E3, Participants 8 (7.7 percent), APOE e4 status blank, Participants blank. Row 3: APOE genotype E3/E3, Participants 45 (43 percent), APOE e4 status blank, Participants blank. Row 4: APOE genotype E2/E4, Participants 1 (1.0 percent), APOE e4 status Heterozygote, Participants 45 (43 percent). Row 5: APOE genotype E3/E4, Participants 44 (42 percent), APOE e4 status blank, Participants blank. Row 6: APOE genotype E4/E4, Participants 6 (5.8 percent), APOE e4 status Homozygote, Participants 6 (5.8 percent).
APOE = apolipoprotein E; PCR = polymerase chain reaction.
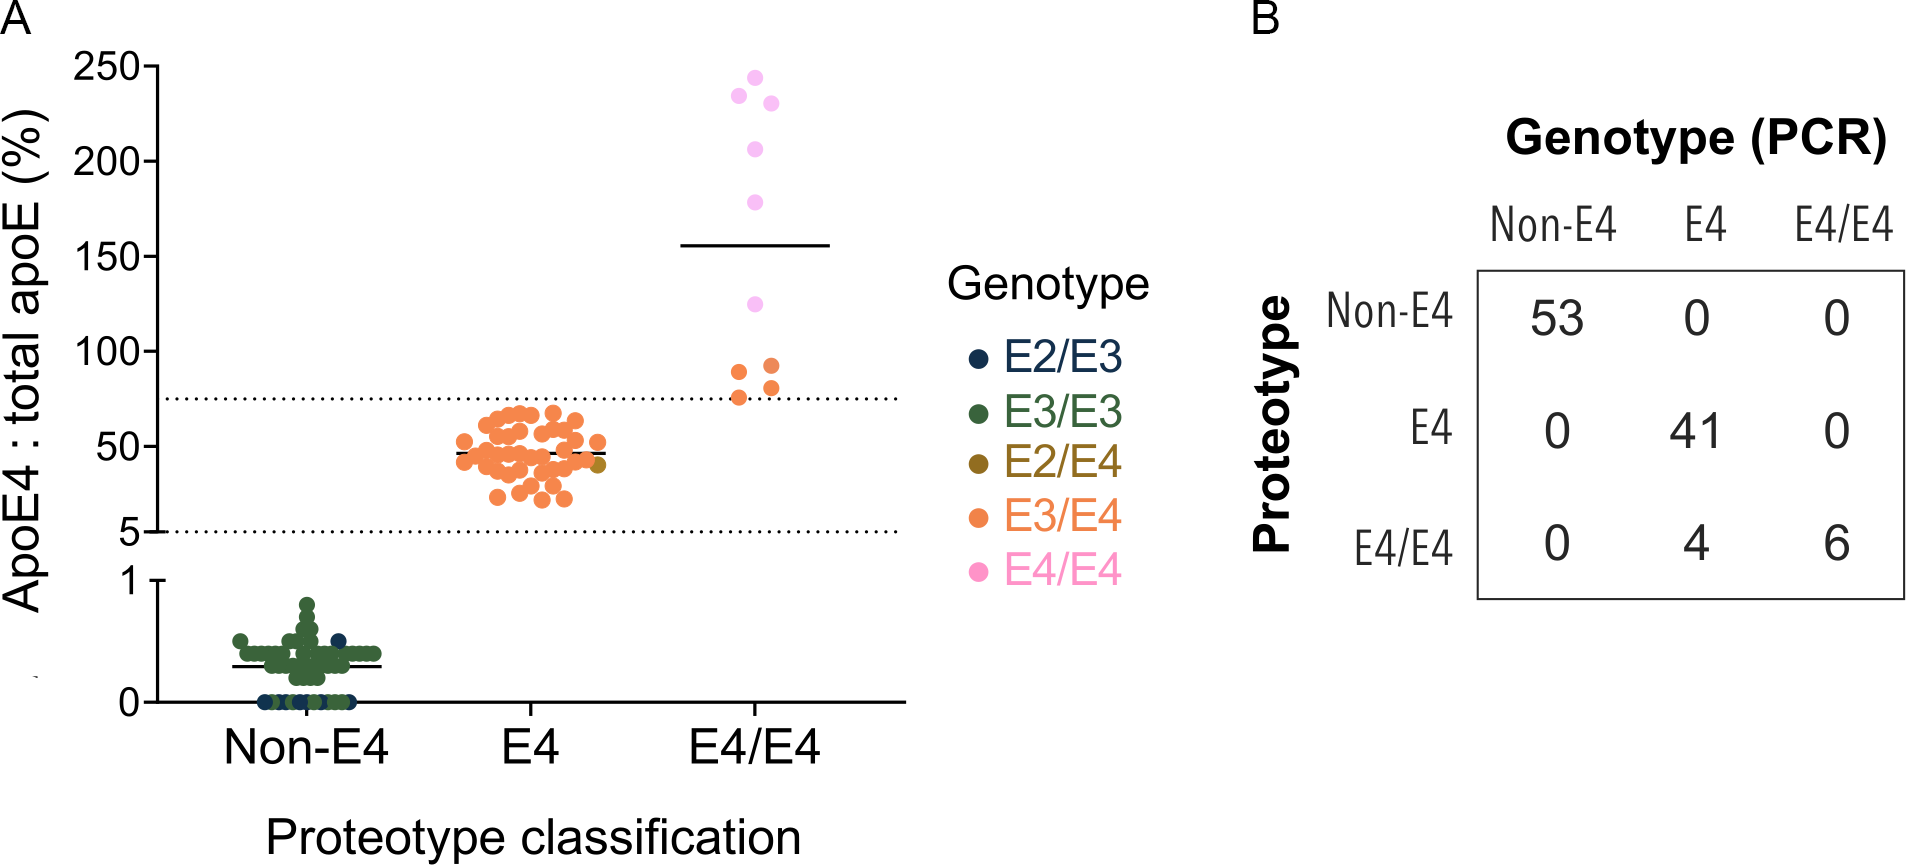
Proteotyping correctly classified all non-E4 individuals (E2/E2, E2/E3 and E3/E3; n = 53) and all E4/E4 homozygotes (n = 6) (Figures 2 and 3). Among the 45 E4 carriers (E3/E4 n = 44, E2/E4 n = 1), 41 (91.1%) were correctly classified (p < 0.0001), while 4 (8.89%) were misclassified as E4/E4 homozygotes (Figure 2). The single E2/E4 case was correctly identified as an E4 carrier (Figures 2 and 3).
Concordance of proteotyping with genotyping. (A) Results of method comparison classified by proteotype-inferred APOE4 status (x-axis) based on the measured apolipoprotein E ε4/total apolipoprotein E (apoE4/total apoE) ratio with data points colored by PCR genotype. Dotted lines represent the manufacturer’s classification thresholds between non-E4 carriers and E4 (bottom line) and between E4 and E4/E4 (top line). (B) Concordance matrix of proteotype versus genotype. PCR = polymerase chain reaction.

Figure 2. Long description
Panel A: A scatter plot shows the apoE4 to total apoE ratio (percent) on the vertical axis and proteotype classification on the horizontal axis. The proteotype classification includes Non-E4, E4, and E4/E4 categories. Data points are colored by PCR genotype: E2/E3, E3/E3, E2/E4, E3/E4, and E4/E4. Dotted lines represent the manufacturer’s classification thresholds between non-E4 carriers and E4, and between E4 and E4/E4. Panel B: A concordance matrix compares proteotype versus genotype. The matrix has rows and columns labeled Non-E4, E4, and E4/E4, with numerical values indicating the count of each genotype classification.
Paired apolipoprotein E ε4 (apoE4) and total apolipoprotein E (apoE) concentrations for each sample in the method comparison binned by proteotype-inferred APOE4 allelic status of (A) non-E4 carrier, (B) E4 heterozygote and (C) E4/E4 homozygote and colored by PCR genotype. Lines connect measurements from the same sample. PCR = polymerase chain reaction.

Figure 3. Long description
Panel A: A line graph shows the concentration of apoE4 and total apoE for non-E4 carriers. The x-axis represents apoE4 and total apoE, while the y-axis represents concentration in micrograms per milliliter (µg/mL). The data points are connected by lines, with two groups labeled E2/E3 and E3/E3. The concentrations for total apoE are generally higher than for apoE4. Panel B: A line graph displays the concentration of apoE4 and total apoE for E4 heterozygotes. The x-axis represents apoE4 and total apoE, while the y-axis represents concentration in µg/mL. The data points are connected by lines, with two groups labeled E2/E4 and E3/E4. The concentrations for total apoE are generally higher than for apoE4. Panel C: A line graph illustrates the concentration of apoE4 and total apoE for E4/E4 homozygotes. The x-axis represents apoE4 and total apoE, while the y-axis represents concentration in µg/mL. The data points are connected by lines, with two groups labeled E4/E4 and E3/E4. The concentrations for total apoE are generally higher than for apoE4.
Overall accuracy was 96.2% (CI: 90.5–98.5%). The overall misclassification rate was 3.85% (4/104). For detecting non-carriers, the assay demonstrated 100% sensitivity (CI: 93.2–100%) and 100% specificity (CI: 93.2–100%). For detecting heterozygosity, the assay demonstrated 91.1% sensitivity (CI: 79.3–96.5%) and 100% specificity (CI: 93.9–100%), yielding a positive predictive value (PPV) of 100% (CI: 91.4–100%) and a negative predictive value (NPV) of 93.4% (CI: 84.8–97.5%). For detecting homozygosity (vs. non-homozygosity), the assay demonstrated 100% sensitivity (CI: 61.0–100%) and 95.9% specificity (CI: 90.0–100%). The misclassification rate for homozygosity was 40% (4/10), yielding a PPV of 60% (CI: 31.3–83.2%) and a NPV of 100% (CI: 96.1–100%).
ApoE4 and total apoE concentration by genotype
ApoE4 concentration demonstrated clear genotype-dependent patterns (Figure 4A). E4/E4 homozygotes showed approximately 4-fold higher median apoE4 concentrations (27.5 [range: 15.6–64.2] μg/mL) compared to E3/E4 heterozygotes (6.5 [IQR: 4.6–8.8] μg/mL). For non-E4 carriers, the median apoE4 concentration was 0.10 (IQR: 0.05–0.10, range: 0.0–0.3) μg/mL, noting that the lowest assay calibrator is assigned to 0 μg/mL. A comparison with E2/E4 was not performed given the single E2/E4 specimen.
Genotype-dependent apolipoprotein E ε4 (apoE4) and total apolipoprotein E (apoE) concentrations. (A) ApoE4 and (B) total apoE concentrations (median, interquartile range and range shown; ns: p > 0.05, *p ≤ 0.05; ****p ≤ 0.0001). (C) E3/E4 cases colored by concordance (gray) and discordance (open blue circles) with PCR genotype. PCR = polymerase chain reaction.

The total apoE concentration also differed significantly by genotype (Figure 4B). The highest concentration was observed in non-E4 carriers (25.8 [IQR: 18.0–33.0] μg/mL), and the non-E4 group was significantly higher than both E3/E4 (13.7 [IQR: 9.5–18.4] μg/mL) and E4/E4 groups (13.5 [range: 6.4–27.4] μg/mL). No significant difference was observed between E3/E4 and E4/E4 groups.
Of the 44 E3/E4 cases by genotyping, the 4 cases that were incorrectly classified by proteotyping had a median apoE4 concentration of 6.5 μg/mL (range: 5.3–15.7 μg/mL) and total apoE concentration of 9.7 μg/mL (range: 6.4–17.0 μg/mL). Concentrations by individual E3/E4 case can be found in Figure 4C.
Discussion
Plasma apoE4 proteotyping reliably ruled out APOE4 homozygosity (100% NPV), positioning this assay as a high-throughput first-line screening tool for anti-amyloid therapy eligibility. Additionally, for those classified as non-APOE4 homozygotes by proteotyping, the assay further perfectly discriminated between APOE4 non-carrier and carrier status, thus making it suitable for further ARIA risk stratification. For those classified as homozygotes by proteotyping (n = 10), 40% were misclassified (4 E4/E4 proteotyping results were E3/E4 heterozygotes based on the reference standard), yielding a PPV of only 60% for homozygosity. These performance characteristics indicate that a negative result for APOE4 homozygosity can be trusted (100% NPV), while positive results require confirmatory testing due to the misclassification rate.
For clinical implementation, these performance characteristics should be interpreted in the context of prevalence in the intended use population. In North American and European populations, APOE4 carrier frequency in the general population is ∼20–25%, with E4/E4 homozygous status only ∼2–3%.Reference Farrer, Cupples and Haines23,Reference Liu, Liu, Kanekiyo, Xu and Bu24 In research cohorts enriched for AD pathology, such as those originating from specialized memory clinics or those biomarker-positive for AD pathology, APOE4 allelic frequency is increased relative to the general population. In these enriched cohorts, E4 carriers may account for up to 40–60% of individuals, and E4/E4 homozygotes may account for up to 8–12% of individuals.Reference Mattsson, Groot and Jansen25,Reference Ossenkoppele, Jansen and Rabinovici26 Our cohort was comprised of 43% heterozygotes and 5.8% homozygotes, closely matching expected prevalence in the intended use population.
Examining the discordant cases, we observed no apoE4 or total apoE concentrations that were outside the range of those observed for concordant E3/E4 cases; instead, it was the paired result (ratio) that yielded the genotypic discrepancies (Figure 4C). Whether the discrepancies were a result of true biological differences and/or experimental error (e.g., pre-analytical or analytical factors related to PCR or proteotype testing) is unknown as further analysis was limited by available sample volume and the retrospective study design. For E3/E4 cases, there were overlapping apoE4 protein concentrations between discordant and concordant subgroups (both being lower than those observed for true E4/E4 homozygotes). For discordant cases, total apoE concentrations (range 6.4–17.0 μg/mL) were consistent with, but on the lower end of, the findings for the correctly classified E3/E4 subgroup (range 5.6–49.1 μg/mL) and true E4/E4 homozygotes (6.4–27.4 μg/mL).
From the analytical validation, we found both the apoE4 and total apoE plasma immunoassays performed robustly in the presence of hemolysate and lipemia. E4 allelic classification remained accurate after multiple freeze/thaw cycles, consistent with previous reports demonstrating apoE stability through multiple (9+) freeze–thaw cycles,Reference Schiele, Vincent-Viry, Herbeth, Visvikis and Siest27,Reference van den Broek, Romijn and Nouta28 with apoE4 stable up to ∼4 cycles.Reference Schiele, Vincent-Viry, Herbeth, Visvikis and Siest27 In our precision study, every paired analysis performed yielded the correct E4 allelic classifications. As expected, imprecision was high for the E4-null sample when measuring apoE4 (likely reflecting a combination of analytical noise and cross-reactivity), but otherwise total imprecision ranged from 1.7 to 8.5%.
Although designed as a qualitative ratio-based assay, we examined individual analyte concentrations. Non-E4 individuals had the highest total plasma apoE concentrations, followed by E4 heterozygotes and homozygotes, findings consistent with studies across different assay methodologies.Reference Martinez-Morillo, Hansson and Atagi29–Reference Aslam, Fan and Lawrence31 Median concentrations did not differ significantly between E4 heterozygotes and homozygotes, but both groups had significantly lower concentrations compared to non-carriers.
Following the expected allelic dosage pattern, we observed a significantly higher apoE4 plasma concentration in E4 homozygotes compared to heterozygotes. Given that anti-amyloid therapy studies have focused on genotyping without assessing circulating apoE4 concentrations, it remains unknown whether apoE4 protein concentration, alongside genotype, may be clinically meaningful for ARIA risk. This is consistent with the APOE4 gene-dose effect on ARIA risk observed across recent anti-amyloid trials,Reference van Dyck, Swanson and Aisen1,Reference Sims, Zimmer and Evans2 though whether plasma apoE4 concentration independently contributes beyond its role as a proxy for allele dosage requires further investigation.
While identification of APOE4 homozygosity serves as the primary genetic risk criterion for ARIA, it incompletely accounts for individual ARIA susceptibility. A substantial proportion of APOE4 homozygotes do not develop ARIA, while clinically significant ARIA also occurs in E4 heterozygotes and, less frequently, in non-carriers. This heterogeneity has important clinical implications, as genotype-only stratification may lead to unnecessary deferral of potentially beneficial anti-amyloid therapy and fails to capture residual ARIA risk among non-homozygotes. These observations support the need for complementary approaches to refine ARIA risk assessment beyond binary genetic classification.
The immediate clinical concern is the assay’s E4/E4 misclassification rate, while apoE proteoform concentrations warrant further investigation. Although these misclassifications represent only a small fraction of E4 heterozygotes, the clinical impact is substantial. With homozygotes ineligible for therapy in some countries, E4/E4 results have serious implications for persons with AD. For instance, both Health Canada’s notice of compliance for lecanemab32 and the European Medicines Agency marketing authorization approval for lecanemab33 restrict therapy eligibility to non-E4 carriers and E4 heterozygotes, excluding E4/E4 homozygotes due to heightened ARIA concerns. Moreover, with eligibility also tied to a defined window of disease severity (i.e., mild cognitive impairment to mild dementia32), timely access to therapy is paramount. A lab result that may delay or derail this process (e.g., via false-positive E4/E4 result) is undesirable.
In addition to APOE genotype and stage of dementia being criteria for drug access and reimbursement, another critically important criterion is AD biomarker status. Anti-amyloid therapies are intended only for persons with biomarker evidence of AD pathology. More recently, though, advancements in automated high-throughput assay for tau phosphorylated at residue 217 (p-tau217) in plasma have resulted in blood testing with sufficient accuracy to serve as first-line diagnostic testing. While rapid DNA-based methods exist, including those with less invasive collection requirements,Reference Waterink, van der Lee and Nijland34,Reference Rajic Bumber, Racki, Meznaric, Pelcic and Mrsic-Pelcic35 plasma proteotyping enables integrated workflows where p-tau217-positive samples automatically trigger apoE4 testing. For example, a patient’s plasma sample positive for p-tau217 could trigger reflexive apoE4 proteotyping on the same specimen, providing both diagnostic information and ARIA risk stratification from a single blood draw with results available within hours. Additionally, proteotyping provides an alternative when DNA-based methods may be delayed, inaccessible or culturally constrained.
Regardless of testing method, from an ethical perspective, clinicians should recognize that genetic information is inferred from proteotyping results. As APOE4 disclosure can affect self-perception, planning and family dynamics, particularly in underserved populations,Reference Blasco and Roberts36 current guidelines advocating genetic counseling before APOE testing should extend to proteotyping assays.Reference Goldman, Hahn and Catania16 Discussions should address treatment eligibility, familial implications and potential insurance ramifications, particularly in jurisdictions lacking protections against genetic discrimination.
A strength of this study is the inclusion of specimens originating from a memory clinic population (enriching E4 genotypes) and from routine testing (increasing sample size and APOE allelic diversity), with the overall cohort closely matching the APOE4 genotypic distribution expected in the intended use population. Limitations include small sample sizes for low-prevalence genotypes – E2/E4 (n = 1) and E4/E4 (n = 6) – and the absence of the rare E2/E2 genotype. This precluded certain subgroup analyses and, for E4/E4 specifically, prevented modification of the interpretive threshold between E4 and E4/E4. For instance, increasing the apoE4-to-total apoE ratio threshold for E4 homozygotes from ≥75% to >95% would have achieved 100% concordance with genotyping results in this cohort; however, with only six E4/E4 samples, such a modification was not statistically justified.
Conclusion
In the context of anti-amyloid therapies for AD and based on the observed assay performance, an appropriate use of this plasma apoE4 proteotyping test would be to rule out APOE4 homozygosity and thus rule in eligibility for therapy. Only those cases deemed E4/E4 would necessitate confirmatory testing via an alternate method.
Consistent with early findings via alternate methodologies, we found significantly lower total apoE concentrations in E4 carriers as compared to non-carriers. This presents the intriguing possibility that apoE proteoform concentrations may hold clinical relevance. The assay demonstrated robustness to common preanalytical challenges and matrix interferents, supporting the feasibility for clinical implementation. Further research is necessary to refine classification thresholds in larger E4/E4 cohorts, validate proteotyping in diverse populations and prospectively evaluate its utility in risk-stratification frameworks through longitudinal ARIA outcome studies. Proteotyping could offer a more efficient, biomarker-driven approach for the determination of APOE4 allelic status and improve clinical decision-making for AD therapies.
Acknowledgments
The authors would like to express their gratitude to the individuals that contributed their biological specimens and associated data, without which this study would not have been possible, as well as to the staff of the Clinic for Alzheimer’s Disease and Related Disorders at the University of British Columbia who provide stewardship of resources used herein.
Author contributions
YA: Investigation; Formal analysis, Writing – Original Draft, Review & Editing; RS: Investigation, Formal analysis, Writing – Review & Editing; CH: Formal analysis, Visualization, Writing – Review & Editing; MD: Conceptualization, Methodology, Resources, Project administration, Writing – Review & Editing.
Funding statement
YA was supported by a fellowship from the Saudi Arabian Cultural Bureau in Canada and King Faisal Specialist Hospital & Research Centre. RS was supported in part by a stipend from the Alzheimer Society of British Columbia. CH was supported in part by a Four-Year Doctoral Fellowship from the University of British Columbia (#6456). MLD acknowledges in-kind support (to institution) in the form of reagents and equipment from Phoenix Airmid (Canadian distributor for Fujirebio). Phoenix Airmid had no role in the design of the study; collection, analysis or interpretation of data; writing of the manuscript; or the decision to submit the results for publication.
Competing interests
YA, RS and CH report no conflicts of interest. Outside of this work, MLD reports consulting for Canada’s Drug Agency, Siemens, Roche and Eisai, lecturing/educational activity fees from Roche and Eli Lilly; in kind support (to institution) from Fujirebio via Phoenix Airmid (reagents), Meso Scale Diagnostics (reagents), Roche Diagnostics (reagents); and role as co-chair for the CSCC/ADLM Clinical Laboratory Guidance Document on Alzheimer’s Disease Biofluid Biomarkers.




 Open access

