Introduction
Leafy spurge (Euphorbia esula L.) is a perennial weed that primarily infests range and recreation land in the North American Great Plains. It is proposed to have been introduced from two populations (Dunn Reference Dunn1979); one early in the 1700s from western European–derived populations, and the second in the 1800s from eastern European–derived populations. This later introduction appears to have brought in particularly invasive genotypes that have proven difficult to control in the grazing and wildlands of the north-central United States and south-central Canada (CABI 2004). Euphorbia esula has long been considered one of the top 10 most problematic weeds in the United States (Chao et al. Reference Chao, Horvath, Anderson and Foley2005). Due to its significant economic impact and availability of funding for research, E. esula has been suggested as a model weed to study various aspects of invasive weed biology (Chao et al. Reference Chao, Horvath, Anderson and Foley2005). Indeed, many advances have been made in understanding the biology, ecology, and control of this weed through various government-funded projects such as The Ecological Area-wide Management (TEAM) Leafy Spurge and through research directly supported by the USDA-ARS.
Until recent advances resulted in the full-genome sequencing of horseweed (Erigeron canadensis L.) (Peng et al. Reference Peng, Lai, Lane, Nageswara-Rao, Okada, Jasieniuk, O’Geen, Kim, Sammons, Rieseberg and Neal Stewart2014), E. esula was a good example of a molecularly characterized weed species that does not have a close crop relative. A Sanger-sequenced expressed sequence tag (EST) database for E. esula contains approximately half of the unigenes present in this species (Anderson et al. Reference Anderson, Horvath, Chao, Foley, Hernandez, Thimmapuram, Liu, Gong, Band, Kim and Mikel2007). Additionally, a robust cDNA microarray was developed containing almost all of those unigenes, along with an additional 4,000 unigenes from a distantly related euphorb (cassava [Manihot esculenta Crantz]). With these tools, E. esula has proven to be a model herbaceous perennial species for studying bud dormancy (Doğramaci et al. Reference Doğramaci, Horvath and Anderson2015b; Horvath et al. Reference Horvath, Chao, Suttle, Thimmapuram and Anderson2008); flowering (Doğramaci et al. Reference Doğramaci, Horvath, Chao, Foley, Christoffers and Anderson2010, Reference Doğramaci, Horvath and Anderson2015b); seed dormancy (Chao et al. Reference Chao, Foley, Doğramaci, Anderson and Horvath2011); and the effects of herbicides on plant physiology, growth, and development (Doğramaci et al. Reference Doğramaci, Foley, Horvath, Hernandez, Khetani, Fields, Keating, Mikel and Anderson2015a, Reference Doğramaci, Anderson, Chao, Horvath, Hernandez, Mikel and Foley2017). Some of these transcriptomics studies on E. esula have included next-generation sequencing technologies such as RNA-seq, which have generated large quantities of sequences from transcribed portions of the genome.
Many transcriptomics analyses on bud and seed dormancy and glyphosate responses of E. esula have helped identify key regulatory genes and signals involved in these processes. However, such transcriptomics experiments have even greater potential for identifying regulatory factors when they can be coupled to genomic sequences that include promoters. This is also true for other weed systems that have significant transcriptomics assets, including several parasitic weeds (Westwood et al. Reference Westwood, dePamphilis, Das, Fernández-Aparicio, Honaas, Timko, Wafula, Wickett and Yoder2012), Canada thistle [Cirsium arvense (L.) Scop.] (Bell et al. Reference Bell, Kane, Rieseberg and Adams2013) and several other members of the Compositae (Lai et al. Reference Lai, Kane, Kozik, Hodgins, Dlugosch, Barker, Matvienko, Yu, Turner, Pearl, Bell, Zou, Grassa, Guggisberg, Adams, Anderson, Horvath, Kesseli, Burke, Michelmore and Rieseberg2012), and rigid ryegrass [Lolium rigidum (Gaudin)] (Gaines et al. Reference Gaines, Lorentz, Figge, Herrmann, Maiwald, Ott, Han, Busi, Yu, Powles and Beffa2014). Genomic sequences for these weedy species are rarely available; thus, many of the previously described transcriptomics studies would have benefited from genomic sequencing.
Euphorbia esula is an auto-allohexaploid (Schulz-Schaeffer and Gerhardt Reference Schulz-Schaeffer and Gerhardt1989), with a reasonably large haploid genome size of over 2 Gb (Chao et al. Reference Chao, Horvath, Anderson and Foley2005). As such, E. esula is a less than an ideal model for genomic sequencing. Without resorting to an expensive, long-read technology (e.g., PacBio or Oxford Nanopore), generating a draft genome sequence of E. esula is challenging. However, advances in Illumina read lengths, reduced costs, and publicly available and effective bioinformatics resources make it feasible for any moderately funded lab to generate deep databases of whole-genome sequences from any species. A single lane of Illumina can currently generate nearly 500 million reads from 150-base paired-end fragments (150 Gb) at a cost of $4,000 or less, including sequencing and library preparation. Although full-genome sequencing requires long-read technologies, considerable information on the genetic makeup of almost any weed is possible using just these short-read technologies. Here, we present progress on characterizing the E. esula transcriptome database and genomic sequence databases, which contain primarily gene sequences. It is our hope that this work might provide a blueprint for other low-cost weed-sequencing initiatives.
Materials and Methods
Plant Material, Library Construction, Sequencing, and Read Processing
Transcriptome sequences were gathered from four different RNA-seq studies on bud dormancy and glyphosate responses of E. esula (GEO series accession numbers GSE56509, GSE71406, GSE71321, and GSE71317) as previously described (Chao et al. Reference Chao, Doğramaci, Horvath, Anderson and Foley2016, Reference Chao, Doğramaci, Horvath, Anderson and Foley2017; Doğramaci et al. Reference Doğramaci, Foley, Horvath, Hernandez, Khetani, Fields, Keating, Mikel and Anderson2015a, Reference Doğramaci, Anderson, Chao, Horvath, Hernandez, Mikel and Foley2017). Additionally, two individual plants taken from a clonal greenhouse population of E. esula (cultivar 1984-ND001) were propagated from root and shoot cuttings. Shoot tips from each clonal group were harvested directly into liquid nitrogen. DNA was extracted from each pool using a modified CTAB extraction method (Murray and Thomson Reference Murray and Thompson1980). Libraries were constructed at the University of Georgia’s core facility using the TrueSeq genomic library construction kits (Illumina, San Diego, CA) as per the manufacturer’s recommendations. Two libraries of 300 and 400 bases were constructed from each group of clonal plants (four libraries total). Libraries were sequenced on a HiSeq2000 by the USDA-ARS core facility in Stoneville, MS, with paired-end reads of 100 bases for each fragment on four partial lanes of Illumina (see NCBI SRA: SRX3452315-18). Additionally, 12 ChIP-seq libraries with insert length of 300 bases sequenced on a Hiseq2500 as 150 base paired-end reads were also included by the Roy J. Carver Biotechnology Center, University of Illinois–Urbana (see NCBI SRA: SRX3452313-14 and SRX3452319-28). Initial read quality was assessed using the FastQC program (http://www.bioinformatics.babraham.ac.uk/projects/fastqc) in the CyVerse Discovery Environment (Oliver et al. Reference Oliver, Lenards, Barthelson, Merchant and McKay2013). The program Sickle-Quality-Base-Trimming (Joshi and Fass Reference Joshi and Fass2011) was used to trim reads for quality and length (minimum quality score of 20 and a minimum read length of 70 bases) in the CyVerse Discovery Environment. Two libraries also had the first 3 bases removed from the reads to improve quality scores. Complexity and kmer coverage was determined using the bbnorm subprogram in the BBMap suite of programs (Bushnell Reference Bushnell2014, Reference Bushnell2015) and/or with the subprogram Jellyfish in the program Quake.
Identification of Expressed and/or Conserved, Plastid, Mitochondrial, and Repetitive Sequences within the Genomic Sequence Data
Low-Copy-Number Expressed and Conserved Sequences
To identify conserved and transcribed sequences, the program Bowtie 2 in CyVerse was used to obtain reads with homology to poplar [Populus balsamifera L. ssp. trichocarpa (Torr. & A. Gray ex Hook.) Brayshaw], M. esculenta, rubber tree [Havea brasiliensis (Willd. ex A. Juss.) Müll. Arg.], and castorbean (Ricinus communis L.), based on genomic sequences (Ptrichocarpa_210.fa, Mesculenta_147.fa, Rcommunis_119.fa) extracted from the Phytozome 8.0 database (Goodstein et al. Reference Goodstein, Shu, Howson, Neupane, Hayes, Fazo, Mitros, Dirks, Hellsten, Putnam and Rokhsar2012) and H. brasiliensis from NCBI (GCF_001654055.1). Only reads with appropriately matched paired-end were selected. Bowtie 2 was also used to identify fragments with similarity to the combined databases for our Sanger-sequenced ESTs of M. esculenta (Lokko et al. Reference Lokko, Anderson, Rudd, Raji, Horvath, Mikel, Kim, Liu, Hernandez and Dixon2007) and E. esula (Anderson et al. Reference Anderson, Horvath, Chao, Foley, Hernandez, Thimmapuram, Liu, Gong, Band, Kim and Mikel2007) present on previously published microarrays (Horvath et al. Reference Horvath, Chao, Suttle, Thimmapuram and Anderson2008), as well as the assembled transcriptome of E. esula from RNA-seq studies described earlier. The resulting paired-end sequences with similarity to these sequences were extracted from the combined and corrected genomic sequence libraries using a custom Perl script (Supplementary File 1, “Assembly of Conserved and Expressed Gene Space”). Low-copy sequences were extracted from the paired-end sequences by kmer selection for fragments with kmer coverage between 5X and 80X using the program bbnorm.
An alternative and faster method (see Supplementary File 1, “Alt.method”) tested on genomic data produced similar results using the program BBMap to select fragments that had sequences matching the EST database, the assembled E. esula transcriptome (see below), and sequences with similarity to the reference sequences of P. trichocarpa, R. communis, H. brasiliensis, and M. esculenta (for program scripts, see Supplementary File 1, Alt.method). The results from the alternative method are not presented here, as it was discovered after the initial analyses. However, the alternative methods are noted in Supplementary File 1, because they are easier and faster.
Chloroplast and Mitochondrial Sequences
Chloroplast sequences were identified by homology to the chloroplast sequences of R. communis from the NCBI nonredundant database using methods similar to those described earlier. For mitochondrial sequences, the program bbduk.sh in the BBMap suite was used to kmer-select mitochondrial sequences based on similarity to a collection of assembled mitochondrial sequences from five related plants, R. communis, H. brasiliensis, jujube (Ziziphus jujuba), cotton (Gossypium hirsutum L.), and P. trichocarpa, obtained from NCBI.
Assembly of the Various Sequence Collections
Transcriptome
The trimmed transcriptome sequences were concatenated into a single set of paired-end files and subjected to kmer reduction using the program Trinity Normalize By K-mer Coverage (Grabherr et al. Reference Grabherr, Haas, Yassour, Levin, Thompson, Amit, Adiconis, Fan, Raychowdhury, Zeng, Chen, Mauceli, Hacohen, Gnirke, Rhind, di Palma, Birren, Nusbaum, Lindblad-Toh, Friedman and Regev2011) in the CyVerse Discovery Environment (Merchant et al. Reference Merchant, Lyons, Goff, Vaughn, Ware, Micklos and Antin2016) with the default parameters of no more than 30X coverage for a given kmer. The program Trinity (Grabherr et al. Reference Grabherr, Haas, Yassour, Levin, Thompson, Amit, Adiconis, Fan, Raychowdhury, Zeng, Chen, Mauceli, Hacohen, Gnirke, Rhind, di Palma, Birren, Nusbaum, Lindblad-Toh, Friedman and Regev2011) was then used to assemble the resulting files in the CyVerse Discovery Environment.
Genomic Sequences
The conserved and expressed sequences were combined with the low-copy sequences selected using the bbnorm program, and duplicate entries were removed using Unix commands (see Supplementary File 1, “Assembly of Conserved and Expressed Gene Space”). The resulting reads were kmer normalized to no more than 20X coverage using the program bbnorm.sh program. This normalized set was assembled using a 63-kmer overlap with the program tadpole.sh in the BBMap program suite and Abbys 1.4 in Linux (see Supplementary File 1 for run parameters) or in the CyVerse Discovery Environment for Velvet 2.5, SOAPde novo 2.0.4, and Trinity 2.1 using default parameters with a kmer overlap of 63 and a minimum coverage of 3X. Likewise, the unselected entire genomic sequence database was assembled with the program Trinity 2.1. in our Linux environment. Contigs greater than 200 bases were collected from each assembly for analysis. Finally, the best assemblies (the whole-genome Trinity and the low-copy, expressed and conserved Velvet assemblies) were scaffolded to the assembled transcriptome using the program L_RNA_scaffolder (Xue et al. Reference Xue, Li, Zhu, Hou, Kong, Kuang and Sun2013). The program Compute Contig Statistics in the CyVerse discover environment was used to determine the N50 (the value in which 50% of the assembled sequence is contained in contigs of length greater than) and other length assessments of the given assemblies. The programs Core Eukaryotic Genes Mapping Approach (CEGMA) (Parra et al. Reference Parra, Bradnam and Korf2007) and BUSCO v. 3 (Simão et al. Reference Simão, Waterhouse, Ioannidis, Kriventseva and Zdobnov2015) were used to determine the representation of a core set of highly conserved eukaryotic sequences and conserved plant-specific sequences, respectively, to establish gene representation for the various assemblies using default parameters in the CyVerse discover environment. Additionally, the program BlastN was used to determine the representation of the expressed sequences in each assembly. Only hits with E values less than 10−5 were collected. This assembly was cleaned from contaminating nonplant sequences and submitted to NCBI (PRJNA413193 for the low-copy, expressed, and conserved Velvet assembly, and PRJNA411945 for the L-RNA–scaffolded whole-genome assembly with Trinity). The assemblies performed with the other programs will be made available upon request.
Chloroplast and Mitochondria
Fragments with similarity to chloroplast and mitochondrial sequences were assembled with the tadpole.sh program in the BBMap program suite, and the resulting contigs were extended and joined using the program PriceTI (Ruby et al. Reference Ruby, Bellare and DeRisi2013) (Supplementary File 1). Initial assemblies indicated that chloroplast sequences could perturb the mitochondrial assembly, and thus chloroplast sequences were removed from the sequence database before the mitochondrial assembly processes. Scripts for selecting and assembling the chloroplast and mitochondrial sequences can be found in Supplementary File 1, “Assembling Chloroplast and Mitochondrial Genomes.” Mitochondria contigs were also extended using PriceTI, first from the chloroplast-depleted fragment library and then from the total library. The chloroplast assembly was submitted to GenBank (PRJNA377010).
Annotation of the Assembled Sequences
Transcript sequences from the RNA-seq assembly were blasted against the GenBank nonredundant database using the program BlastX (Altschul et al. Reference Altschul, Gish, Miller, Myers and Lipman1990) with a minimum E value of 10−5 to identify the most similar protein-coding genes. Clustering of transcribed contigs was done using the program CD-HIT-est 4.6.1 with a threshold of 90% identity in the CyVerse Discovery Environment. The program BlastX was used to identify similar mouse-ear cress [Arabidopsis thaliana (L.) Heynh.] sequences from the TAIR10 database with E<10−5. BlastN was used to identify the most similar genomic contigs from the L-RNA–scaffolded total Trinity-assembled genome and the L-RNA–scaffolded low-copy, expressed, and conserved Velvet-assembled genome in order to annotate the transcriptome assembly.
Genomic Sequences
The program Transcript Decoder 1.0 in the CyVerse Discovery Environment with default parameters (minimum open reading frame size >300 bases) was used to identify open reading frames (ORFs) in the two L-RNA–scaffolded genome assemblies. The resulting peptide databases from the low-copy, expressed, and conserved Velvet assembly were blasted against the nonredundant database using BlastP. Likewise, the entire Velvet-assembled L-RNA–scaffolded assembly was annotated to A. thaliana using BlastX against the TAIR10 database.
Promoters
Probable promoter sequences were identified first by collecting transcripts from the combined RNA-seq and Sanger-sequenced EST databases that produced ORFs using Transcript Decoder 1.0 in the CyVerse Discovery Environment with a minimum peptide length of 50. Those transcripts that started with an ATG were then selected using the “grep” command in our Linux system (grep –B 1 ‘^ATG’ file.FASTA > identifier_list.txt) to pull the transcript identifier from all sequences that began with ATG. The resulting list of transcript identifiers was used to build a FASTA database of the likely 5′-most transcripts using a custom Perl script (see Supplementary File 1 “Perl Script to Pull Selected Sequences from a FASTA File”). The program BLAT (Kent Reference Kent2002), in the CyVerse Discovery Environment was used to map these sequences back to the EST database to identify transcripts that likely contained start codons and to determine the orientation of the ORFs. Because many ORF sequences mapped to multiple transcripts, only those that had >97% identity to at least the first 30 bases from the start of the putative full-length transcript were selected. The column containing the selected transcript identifiers was again used to pull these selected sequences into a new FASTA file. This FASTA file was mapped to both the RNA-scaffolded low-copy, expressed, and conserved Velvet-assembled and the L-RNA–scaffolded whole-genome Trinity-assembled genomic sequence databases using BLAT in the CyVerse Discovery Environment. The orientation of the transcript ORFs to positions within a given genomic fragment allowed us to determine the likely size of any sequences 5′ (upstream) to the probable transcription start sites of these protein-coding genes.
Chloroplast and Mitochondria
The assembled chloroplast and mitochondria sequences were annotated using the program DOGMA (Wyman et al. Reference Wyman, Jansen and Boore2004). Protein-coding regions (start, stop, and intron–exon boundaries) for both chloroplast and mitochondria were manually assessed and confirmed based on BlastX and BlastN results against the nonredundant database and the transcriptome assembly. The GenomeVx program (http://wolfe.ucd.ie/GenomeVx) was used for mapping and visualizing the chloroplast assembly.
Highly Repetitive Sequences and Long Noncoding RNAs (lncRNAs)
A collection of all known repetitive elements was downloaded from the PGSB Plant Repeat Database (http://plantrepeats.plantbiology.msu.edu/downloads.html). This file was used as the BlastN database to identify probable repetitive elements within the E. esula EST collection. The high-copy portion of the genome (fragments containing kmers represented more than 80X) was extracted from the sequence database using the bbnorm subprogram of the BBMap program suite. The program BLAT was used to map these fragments to the EST database in the CyVerse Discovery Environment. The program BBMap was also used to estimate the percentage of the genome containing repetitive elements (Supplementary File 1, “Report Coverage”). Additionally, the program RepeatModeler (RMBlastn v. 2.2.27+) (Smit et al. 2013–Reference Smit, Hubley and Green2015) was used to identify additional repeat elements, including novel repetitive elements that might not be represented in the established databases using the L-RNA–scaffolded whole-genome Trinity-assembled genome. Likewise, sequences of known and suspected lncRNAs from P. trichocarpa, A. thaliana, wine grape (Vitis vinifera L.), R. communis, and M. esculenta were downloaded from the GREENC database (Gallart et al. Reference Gallart, Pulido, de Lagrán, Sanseverino and Cigliano2016) on November 20, 2017. These sequences were concatenated into a single file, and E. esula sequences with similarity were identified using BlastN against the transcriptome assembly and the L-RNA–scaffolded whole-genome Trinity assembly.
Single-Nucleotide Polymorphism Analysis
Within the CyVerse Discovery Environment, the program Bowtie 2 v. 2.2.1—Build-and-map for workflows was used to map sequences from the initial shoot-tip material to the L-RNA–scaffolded whole-genome Trinity-assembled FASTA file. The resulting Sequence Alignment Map (SAM) files were transformed to BAM files using the program SAM to sorted BAM-0.1.19 (app for workflows). Duplicate reads were marked with Picard MarkDuplicates 2.7.1, and the resulting Binary Sequence Alignment Map (BAM) files were run through samtools 1.6 (see Supplementary File 1, “SNP Analysis”). The resulting Variant Call Format (VCF) file for each of the four sequenced libraries was analyzed in Excel to examine the genotypes generated from each library. Data were filtered to only include markers that had a combined quality score for each of the four libraries that was >25; the genotype was the same between both libraries derived from the same sample, and the quality of the genotype call was supported by at least 10 high-quality fragments (approximate read depth or “DP value”) in each of the four genomic libraries (SRA: SRX3452315-18).
Results and Discussion
Assembly and Annotation of the Transcriptome
Assessment of the RNA-seq Assembly
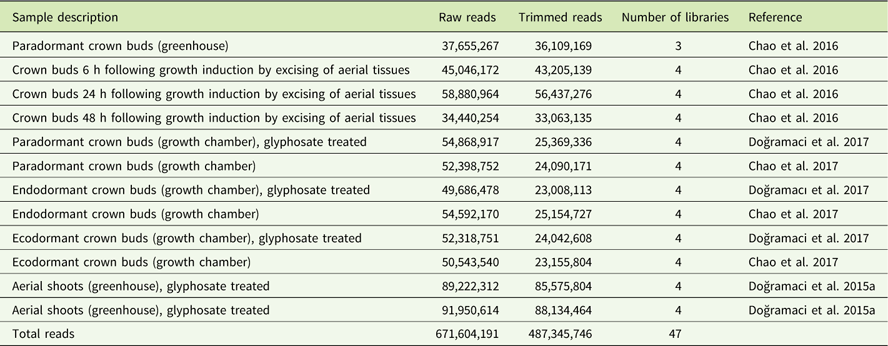
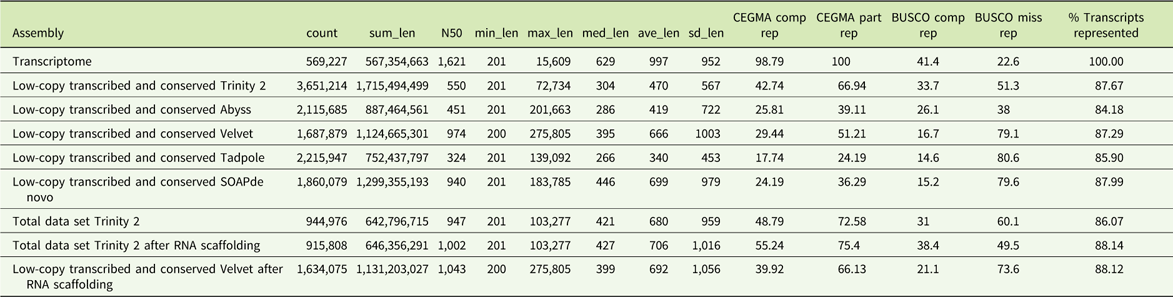
We have previously published data for the RNA-seq-derived transcriptome of E. esula crown bud and aerial shoot tissues using 47 different libraries representing 12 different conditions (Table 1). A total of 569,227 contigs representing 223,732 genes were assembled from the 671,604,191 fragments (Supplementary File 2). The longest contig had a length of 15,609 bases, and the collection had an N50 of 1,621 with an average length of 629 bases. Among these contigs, 304,692 had long ORFs encoding >90 amino acids in length. The compiled assembly statistics are shown (Table 2). Even though E. esula is a hexaploid, it is unlikely to have more than 200,000 genes. Because most plant species contain 20,000 to 40,000 genes (Schliesky et al. Reference Schliesky, Gowik, Weber and Brautigam2012), it is likely that many of the E. esula transcripts identified in this study represent partial sequences and/or noncoding sequences.
Sample description, raw read numbers, the number of quality-trimmed reads, the number of libraries produced from each sample, and the manuscript referencing each library used for the construction of the combined RNA-seq assembly, with total numbers for each column noted in the last row.

Assembly statistics for the various assemblies.Footnote a

a Key to column headings: Assembly, the source of the contigs assembled; counts, the number of contigs in each assembly; sum_len, the total additive length of all the contigs produced; N50, the size of the contigs above which 50% of the total sequences are contained; min_len, the minimum contig length in each assembly; max_len, the size of the largest contig in each assembly; ave_len and sd_len, the average and standard deviation of the contig size in each assembly, respectively; comp rep and part rep, the percentage of conserved eukaryotic sequences in the CEGMA database that were represented as either full-length or as partial sequences, respectively; comp rep and miss rep, the percentage of sequences that were noted as present and complete or missing, respectively, from the BUSCO database of conserved sequences from plants; % transcripts represented, the percentage of the 589,235 combined RNA-seq-assembled and Sanger-sequenced expressed sequence tags represented in the designated assembly.
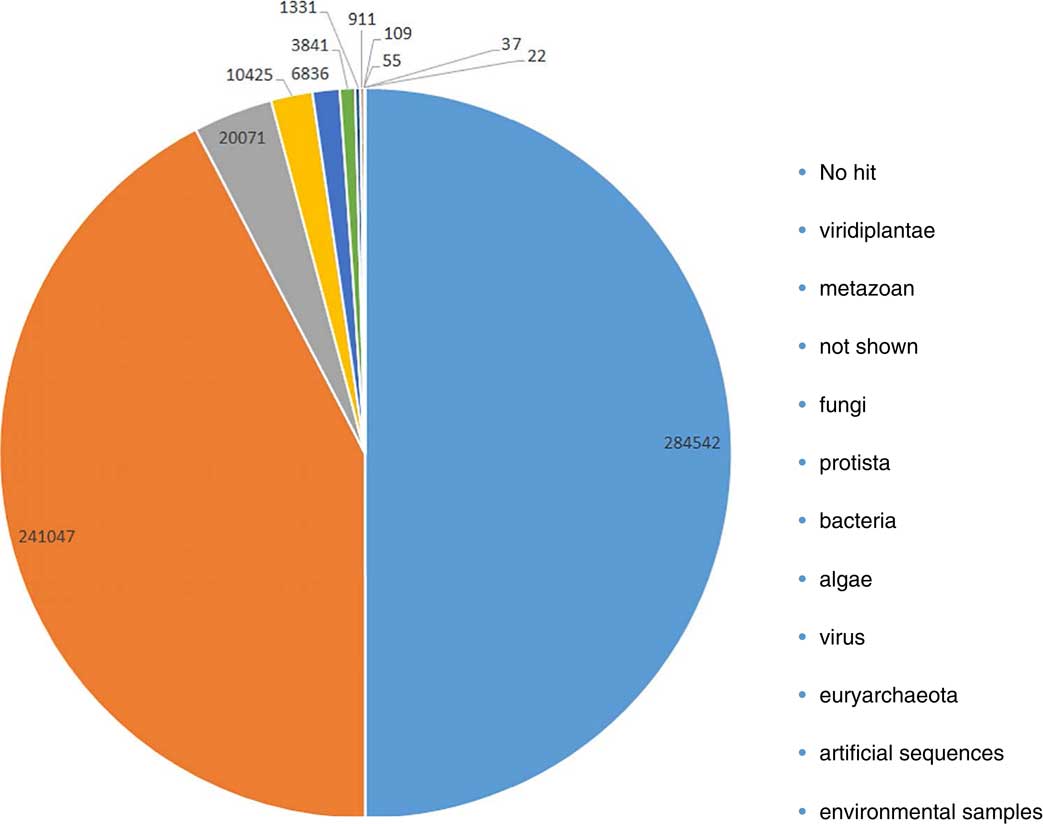
To obtain a better estimate for the true number of E. esula genes, we initially identified 284,640 transcripts with significant similarity (E < 10−5) to the nonredundant database. We then determined the number of genes with similarity to higher plant genes (Figure 1). This resulted in 241,047 transcripts representing 56,234 different genes. This number of genes is closer to that expected for a hexaploid plant species. We then examined the number of genes that has no similarity to either the nonredundant database or the A. thaliana protein database (E < 10−5), and determined that about 50% of the total transcripts (282,630) fell into this category. This observation is also in line with most other plant transcriptome assemblies. For example, the number of annotated transcripts ranges from 49% to 58% in safflower (Carthamus tinctorius L.) (Lulin et al. Reference Lulin, Xiao, Pei, Wen and Shangqin2012), waterhemp [Amaranthus tuberculatus (Moq.) J. D. Sauer] (Riggins et al. Reference Riggins, Peng, Stewart and Tranel2010), and alligatorweed [Alternanthera philoxeroides (Mart.) Griseb.] (Li et al. Reference Li, Xu, Wang, Pan and Lu2015; Zhu et al. Reference Zhu, Zhou and Yang2015). However, a majority (88.7%) of the transcripts with no similarity to the nonredundant database still have similarity to one or more of the genome assemblies (Supplementary File 2). This suggests that they are transcribed sequences from E. esula and are not misassembled or contaminating sequences. This observation points to a prodigious amount of noncoding sequences that are transcribed in E. esula and other eukaryotic genomes.
The relative representation for the source of transcripts assembled from the combined RNA-seq databases from Euphorbia esula. The colors represent the different phylogenetic source from which the Trinity-assembled transcripts were derived as based on a BlastX search of the nonredundant database. The numbers represent the total number of transcripts assigned to each phylogenetic group.

We also examined the number of transcripts with similarity to non-plant sequences and identified 22 annotated as “environmental sample”; 37 contigs annotated as “artificial sequences,” mostly recombinant proteins of some kind; 55 as having the highest similarity to archaebacteria proteins; 109 with high similarity to viral proteins; 1,331 from bacteria; 3,841 from protists; 6,836 from fungi; and 20,071 of metazoan origin, mostly arthropod and nematode (also see Supplementary File 2). Thus, ~15% of our annotated sequences have their highest similarity to non-plant genes. Based on a brief assessment of the available literature (Chiara et al. Reference Chiara, Horner and Spada2013; Huang et al. Reference Huang, Lu, Yan, Chen, Zhang, Huang and Zheng2012; Peng et al. Reference Peng, Abercrombie, Yuan, Riggins, Sammons, Tranel and Neal Stewart2010; Sudheesh et al. Reference Sudheesh, Sawbridge, Cogan, Kennedy, Forster and Kaur2015), this is relatively higher than the 1% to 5% more generally observed in other similar assemblies. We hypothesize that these non-plant sequences resulted from inclusion of tissues from underground crown buds that, due to their small size and prominent leaf scales, often contained small amounts of soil contaminants. As expected, a vast majority of these contaminants show poor representation in the various RNA-seq libraries. This would be consistent with these transcripts being derived from the contaminating biome and not from the transcriptome of E. esula.
Analysis of Combined RNA-seq and EST Databases
The nearly 700 million fragments from our transcriptome assembly described above, combined with the additional ESTs from an earlier Sanger-sequencing project, identified 589,235 contigs representing 271,855 unigenes. To determine the quality of the assembly, we assessed the representation of highly conserved eukaryotic sequences present. Complete contigs were found for 98.8% of the core eukaryotic genes in the CEGMA database, and partial contigs were found for 100% of these core eukaryotic genes (Table 2). BlastX of the combined RNA-seq and Sanger-sequenced databases against the A. thaliana protein database identified 235,851 transcripts (representing ~40% of the combined RNA-seq and ESTs) that have significant similarity to known A. thaliana genes. Conversely, more than half (17,968) of the ~35,000 A. thaliana genes annotated in the TAIR10 database have similarity (E<10−5) to the assembled E. esula contigs. Likewise, 87% of the M. esculenta unigenes set is represented in our assembled transcripts (BlastX resulting in E<10−5). This indicates that we have representation of 80% to 90% of the expressed genes of E. esula in this assembly.
Assessment of Next-Generation Sequence–generated Genomic Sequences
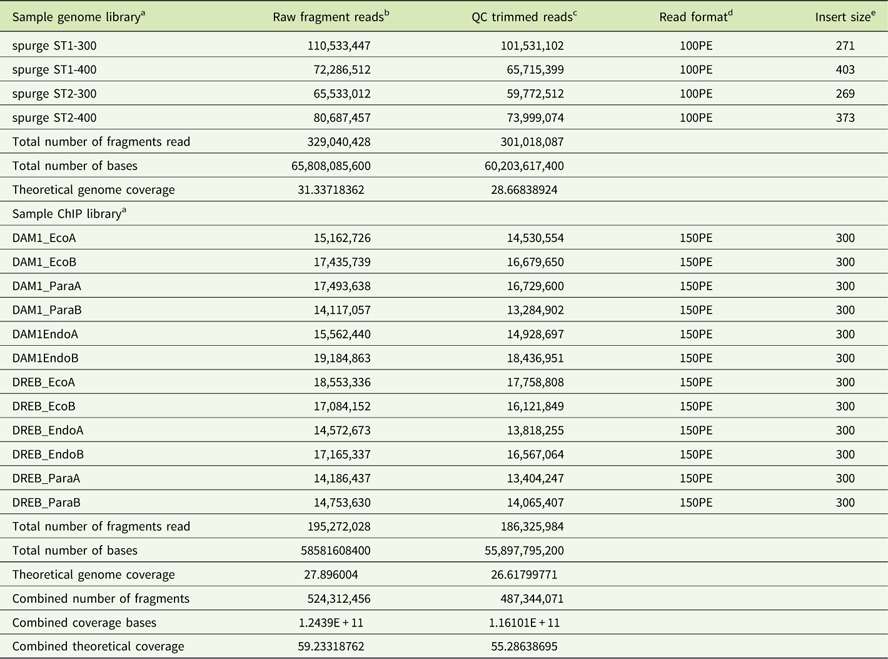
A total of 329,040,428 fragments were paired-end sequenced, resulting in 65,808,085,600 sequenced bases (200 bases from each fragment) (Table 3) from our E. esula shoot-tip libraries. Over 90% (301,018,087) of the fragments were retained after quality trimming, and well over 99% remained as full-length paired-end reads. In addition to the genomic libraries, we also obtained additional genome sequence data from ChIP-seq analysis. Because the sequence data from the ChIP-seq studies showed limited enrichment of specifically targeted sequences based on kmer counts, these data likely represent random genomic sequences. The ChIP-seq data generated 70- to 160-base, paired-end reads from 12 different libraries, providing an additional 186,325,984 quality-trimmed fragments. We combined the genomic sequence from our shoot-tip and ChIP-seq libraries for our genomic assemblies.
The number and source of sequences used to create the various genomic assemblies.

a The name of the genomic library as well as the designation for summed data.
b The number of raw reads obtained.
c The number of reads remaining after quality trimming.
d Indicates whether the libraries generated 100-base-long or 150-base paired-end reads.
e The average size of fragments used to build each library.
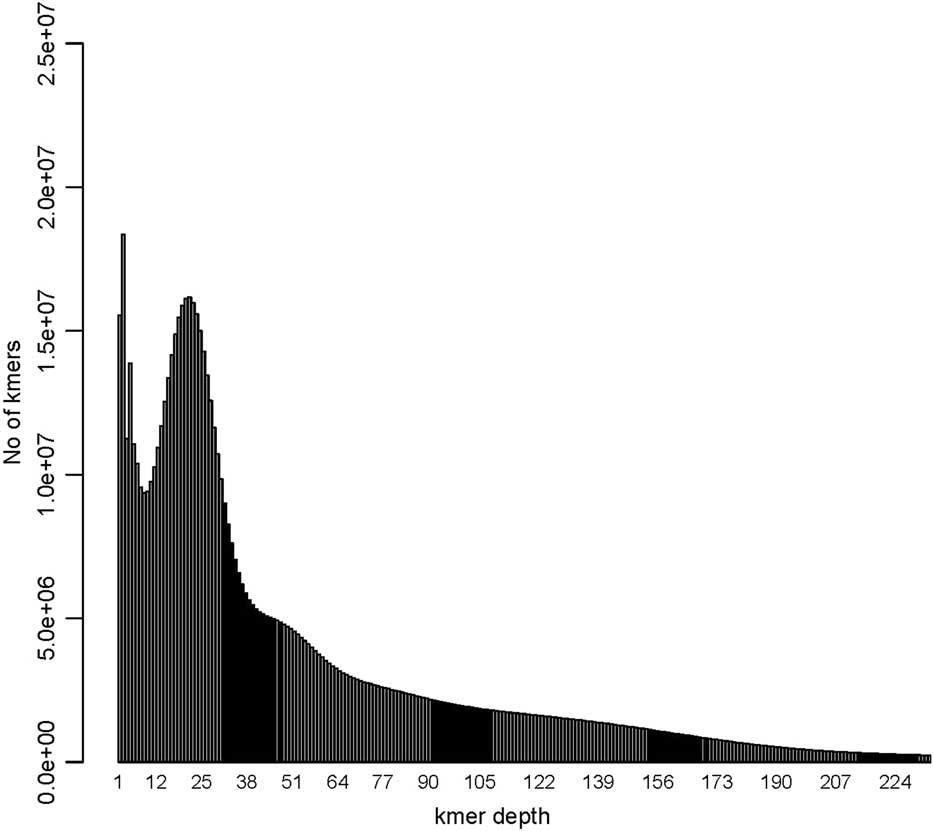
Given that the theoretical size of the E. esula genome is nearly 2.1 Gb per haploid genome (Chao et al. Reference Chao, Horvath, Anderson and Foley2005), and that we obtained approximately 200 bases from the 487,344,071 genomic fragments, we had expected 55X coverage of the genome (Table 3). However, a kmer estimate of genome coverage indicate that we only had about 18X coverage (Figure 2). This was due to a high number of singletons that likely represent sequencing errors that were not excluded during the quality-trimming steps or during the kmer correction steps. Because our whole-genome libraries were sequenced as they could be fit in among other samples, they were not all sequenced immediately, and this might be why the data were not as high a quality as is generally observed. Data from the BBNorm subprogram from the BBMap suite predicted the genome size to be only about 1.14 Gb and erroneously indicated that the E. esula genome was haploid (showing only a single defined peak) based on kmer-counting analyses. A similar kmer-counting analysis using the program Jellyfish, followed by a procedure that sums the number of nucleotides from the kmer counts and multiplies that by the fold coverage, produced a genome size estimate of ~3.5 Gb. The same methods used in the Jellyfish estimates (summing the number of nucleotides from the kmer counts and multiplying by the fold coverage), when applied to the BBNorm kmer counts indicated a genome size of 4.6 Gb. These larger genome size predictions are more in line with the previous flow-cytometry analysis providing the genome is fairly heterozygous. Likewise, if the genome is primarily homozygous, the BBNorm genome size prediction would be more in line with the flow-cytometry analysis (Chao et al. Reference Chao, Horvath, Anderson and Foley2005). These discrepancies are likely due to the underlying methods for predicting genome size estimates as described above; they might also be due to the low coverage of the genome in our database. Alternatively, the individual genomes making up the hexaploid nature of E. esula were collapsed in the BBMap analysis due to low heterozygosity and high similarity between the homeologous genomes. An analysis with the genome of A. philoxeroides also produced similar discrepancies when using these two approaches (D Lui, personal communication).
The kmer representation plot derived from the program Jellyfish with a kmer size of 19. The number of kmers in each class is noted on the y-axis, and the fold representation of kmers in each class is noted on the x-axis.

Repetitive Sequence Analyses
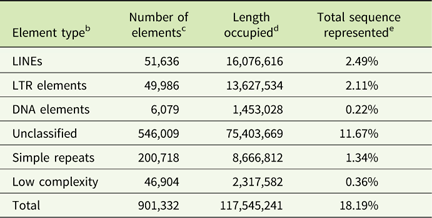
The kmer analysis using the program BBMap indicates that between 21% and 31% of the E. esula genome was composed of repetitive sequences. Likewise, a number of cDNAs from both the RNA-seq and Sanger-sequenced databases contain highly repetitive sequences, with more than 2,000 transcripts having significant similarity (E<10−5) to a collection of known repetitive elements (Supplementary File 2). However, mapping of genomic fragments to the Sanger-sequenced EST database identified more than 6,000 ESTs (unpublished data) that contained sequences that were highly overrepresented (over 300X per unit length). This is similar to a recent analysis of data from A. philoxeroides that also indicated ~22% repetitive sequences (D Lui, personal communication) but is lower than the number of repetitive sequences observed in other crop species (Wendel et al. Reference Wendel, Jackson, Meyers and Wing2016). The program RepeatModeler produced similar results, suggesting ~18% of the genome contained repetitive elements (Table 4). Interestingly, more than 11% of these were unclassified or novel repetitive elements. The sequence of all repetitive elements identified by RepeatModeler can be found in Supplementary File 3.
Representation and type of repetitive elements.Footnote a

a The sum of each column is noted in the last line.
b The type of repetitive element.
c The number of each individual element type found in the assembled genome.
d The total length in bases occupied by each element in the genome.
e Percentage of the genome occupied by each element.
Selection and Assembly of Exome
Highly repetitive sequences present challenges to assembly programs. Thus, we hypothesized that the prevalence of even fairly short repetitive regions would make whole-genome assembly of our E. esula genomic database difficult. To test various assembly methods, we first selected genomic fragments that represented low-copy, expressed, and/or conserved sequences. The program Trinity produced the most contigs greater than 200 bases in length (Table 2) and had the best representation as determined by coverage of conserved eukaryotic sequences (~67% represented) (Table 2). The Trinity-assembled low-copy, conserved, and expressed data set also contained sequences representing nearly 88% of the assembled transcriptome. However, the N50 of this assembly was low (450 bases). Trinity is designed to assemble splice variants of transcripts (Grabherr et al. Reference Grabherr, Haas, Yassour, Levin, Thompson, Amit, Adiconis, Fan, Raychowdhury, Zeng, Chen, Mauceli, Hacohen, Gnirke, Rhind, di Palma, Birren, Nusbaum, Lindblad-Toh, Friedman and Regev2011). Because E. esula is a hexaploid, and the data set was primarily genic sequences, the Trinity program was better designed to assemble the multiple variants of homeologous genes and gene families than the other assembly programs used in this study (Table 2).
Although the Trinity program produced a data set with the best representation of E. esula ESTs and known conserved eukaryotic genes, the Velvet program was superior at generating long contigs, with an N50 of 974 bases including contigs over 250 Mb (Table 2). The Velvet assembly had 61% of the conserved eukaryotic sequences and ~87% of the assembled transcriptome contigs represented. The SOAPde novo program also produced a similar but marginally less representative assembly with an N50 of 940 with a maximum contig size of 183,785 bases. The assembly programs Tadpole and Abyss gave the poorest assemblies in our analyses.
To test our hypothesis that genome assembly with high-copy regions can hinder assemblies, we also assembled the entire data set using the Trinity program. Surprisingly, the resulting assembly had the second-highest N50 (947) and the highest percentage of partial sequences (~73%) matching the conserved eukaryotic set (Table 2). However, slightly fewer transcribed sequences were represented in this assembly (~86% relative to 88% for the low-copy-number Trinity assembly). These results may indicate that additional sequences in the whole-genome data set are bridging gaps between contigs.
Both the whole-genome Trinity assembly of the total sequence database and the Velvet assembly of the low-copy, transcribed, and conserved sequence database produced good assemblies. However, it was likely that both assemblies might contain multiple contigs from any given gene. Thus we scaffolded both of these assemblies with the assembled transcriptome to link contigs of gene units. In both cases, this reduced the total number of contigs by only about 3% and resulted in modest increases in contig size and representation (Table 2).
Identification of Probable Promoter Sequences
Having promoter sequences can be beneficial for identifying regulatory element binding sites in sets of coordinately expressed genes observed from transcriptomics studies (Jegga et al. Reference Jegga, Sherwood, Carman, Pinski, Phillips, Pestian and Aronow2002) or for identifying regulatory elements through techniques such as phylogenetic footprinting (Tagle et al. Reference Tagle, Koop, Goodman, Slightom, Hess and Jones1988). We identified 322,508 ORFs in the combined transcriptome assembly that began with an ATG. Mapping these transcripts back to the two genomic contig assemblies indicated 74,231 transcripts representing as many as 20,000 different genes had more than 1,000 bases of probable promoter sequences (Supplementary File 2). However, the length of the promoter sequences is likely less than predicted in some cases, as not all assembled transcripts contained the 5′ transcription start site, and thus some putative promoter sequences might actually represent transcribed but noncoding sequences.
Identifying Potential Long lncRNAs
lncRNAs are RNAs that are transcribed, and often spliced like messenger RNAs, but encode proteins. Some are known structural components of ribosomes, and other have been show to play significant roles in gene regulation (Kim and Sung Reference Kim and Sung2012). Many are evolutionarily conserved (Kim and Sung Reference Kim and Sung2012). There are a growing number of sequenced transcripts with known and unknown functions that have been collected into various plant lncRNA databases (Bhatia et al. Reference Bhatia, Goyal, Sharma, Upadhyay and Singh2017). We looked to see which contigs likely represented E. esula lncRNAs based on homology to previously described lncRNAs from A. thaliana, M. esculenta, R. communis, P. trichocarpa, and V. vinifera. We identified 3,113 contigs from our transcriptome assembly that had significant similarity to 464 different known lncRNAs from these selected species. The role of these potential lncRNAs is unknown, but 679 were shown to be significantly differentially expressed among genes regulated by paradormancy release (Chao et al. Reference Chao, Doğramaci, Horvath, Anderson and Foley2016). Likewise, we identified 876 contigs from our L-RNA–scaffolded total Trinity assembly representing 354 different potential lncRNA-encoding sequences. Of these, 277 were identified in both assemblies.
Determining Coverage of Genic and Intergenic Sequences
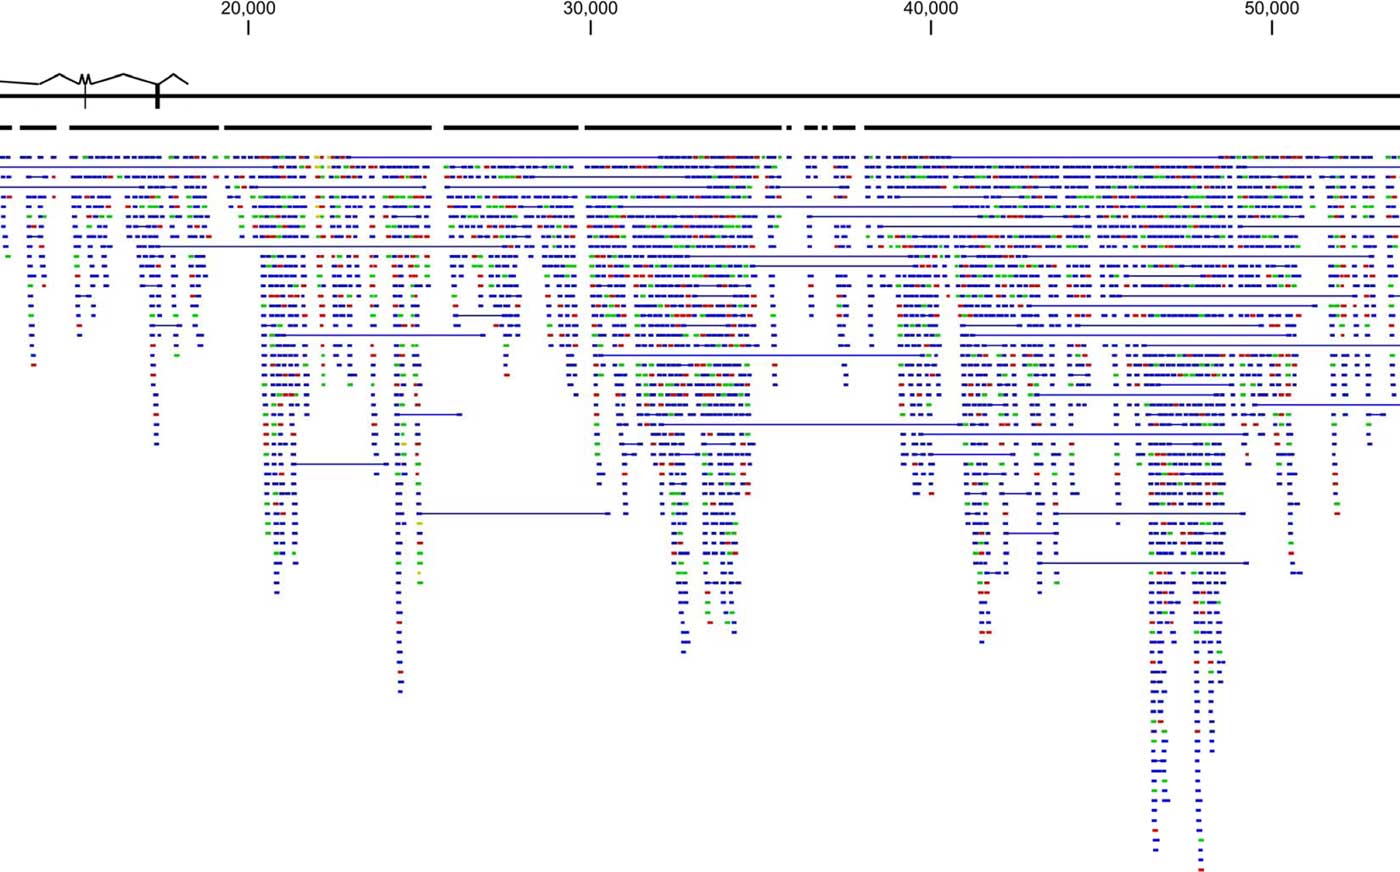
To confirm the representation of promoter and intron sequences within the assembly, we also performed a BlastN of the genomic fragments against the sequence of a genomic BAC clone containing the DORMANCY-ASSOCIATED MADS-BOX1 (DAM1) gene (Horvath et al. Reference Horvath, Kudrna, Talag, Anderson, Chao, Wing, Foley and Doğramaci2013). We found that a vast majority of the fragments that mapped to the DAM1 gene assembled into contigs that covered promoter, introns, and 3′ noncoding region sequences surrounding this gene (Figure 3). However, clearly there are still gaps in both the L-RNA–scaffolded low-copy, expressed, and conserved Velvet-assembled and the L-RNA–scaffolded whole-genome Trinity-assembled databases that would result in missing data from this and other genes. Further sequencing with long-read technologies such as PacBio or the Oxford nanopore systems are needed to create a more complete and contiguous assembly.
Fragment-mapping analysis of the combined paired-end genomic sequences from ChIP-seq and shoot-tip libraries. Sequences were first mapped to the BAC clone containing the DAM1 gene of Euphorbia esula previously sequenced (Horvath et al. Reference Horvath, Kudrna, Talag, Anderson, Chao, Wing, Foley and Doğramaci2013) and then visualized using the CLC genomics suite of programs. Paired-end fragments are linked by lines, and the sequence similarity is noted by the color of each bar. The known coding sequences of the DAM1 gene are noted as troughs with or without vertical bars, and intron sequences are noted as peaks on the line drawing at the upper left of the sequence.

SNP Analysis and Marker Discovery
We identified 502,028 high-quality single-nucleotide polymorphism (SNP) and short indel markers in the L-RNA–scaffolded whole-genome Trinity-assembled database after mapping reads from the libraries derived separately from the four shoot-tip libraries derived from two likely clonally derived plants (Supplementary File 4). Only 4.4% were determined to be different between the two plant samples, and likely represent somatic variation. Similar rates of differences were observed between probable clonal varieties of giant miscanthus (Miscanthus × giganteus) (Głowacka et al. Reference Głowacka, Clark, Adhikari, Peng, Stewart, Nishiwaki, Yamada, Jørgensen, Hodkinson, Gifford, Juvik and Sacks2015). The differences observed here are likely a combination of both sequencing error and real somatic mutations.
Approximately 97% of these markers in each set of clones were heterozygous. This high frequency of heterozygosity is due to the fact that only heterozygous sites would be identified as variants among the two sets of likely clonal plants. Indeed, given the approximate size of the E. esula genome at 2.1 Gb, we can estimate that about 0.02% of the nucleotides are heterozygous (approximately 2 heterozygous markers for every 10,000 bases). Thus, these results actually indicate a low level of heterozygosity in E. esula. As a comparison, a recent assessment of heterozygous loci from a large population of about 400 inbred canola (Brassica napus L.) cultivars indicated the average percent of heterozygous nucleotides at 0.002% (unpublished data). This low level of heterozygosity is likely due to the relatively recent introduction of E. esula into North America from a limited source (CABI 2004; Dunn Reference Dunn1979).
Euphorbia esula is a hexaploid (Schulz-Schaeffer and Gerhardt Reference Schulz-Schaeffer and Gerhardt1989), and it was expected that some markers should map to homeologous genes or other gene family members. In such cases, one would expect that allelic frequencies significantly different from 1:1 among loci genotyped as heterozygous and multiple loci might be expected to have more than two alleles. We observed very few loci (0.2%) that had multiple alleles, and only about 18% of the loci had close to a 1:1 allelic ratio. However, we observed an average allele frequency of 2:1 per for heterozygous locus. This was true even when we limited our selection of alleles to those that had low-copy numbers (those loci with high-quality allelic counts [DP values] between 10 and 20). Thus, these data may help explain the difference between the kmer-estimated genome size (BBMap output) and the flow cytometry–estimated genome size (Chao et al. Reference Chao, Horvath, Anderson and Foley2005). The low level of heterozygosity is consistent with limited peaks in the kmer analysis (Figure 2). However, if the observed differences were due to similarities between the three resident genomes being so high that the kmer estimates collapsed these three genomes into a single entity, we would expect a high number of loci with allele frequencies that differed from 50%—unless all of the homeologous loci are also improbably heterozygous. The fact that we found that the average heterozygous locus had a 2:1 allelic ratio is consistent with the observation that E. esula is an auto-allohexaploid and the duplicated genome, as well as about 18% of the heterologous genome, is likely collapsed in the kmer counts, because they are essentially identical. Clearly, more intensive sequencing efforts that include long-read sequences are needed to determine which of the vastly different genome size estimates are correct and to better understand why these differences are observed.
Assembly of Chloroplast and Mitochondrial Genome
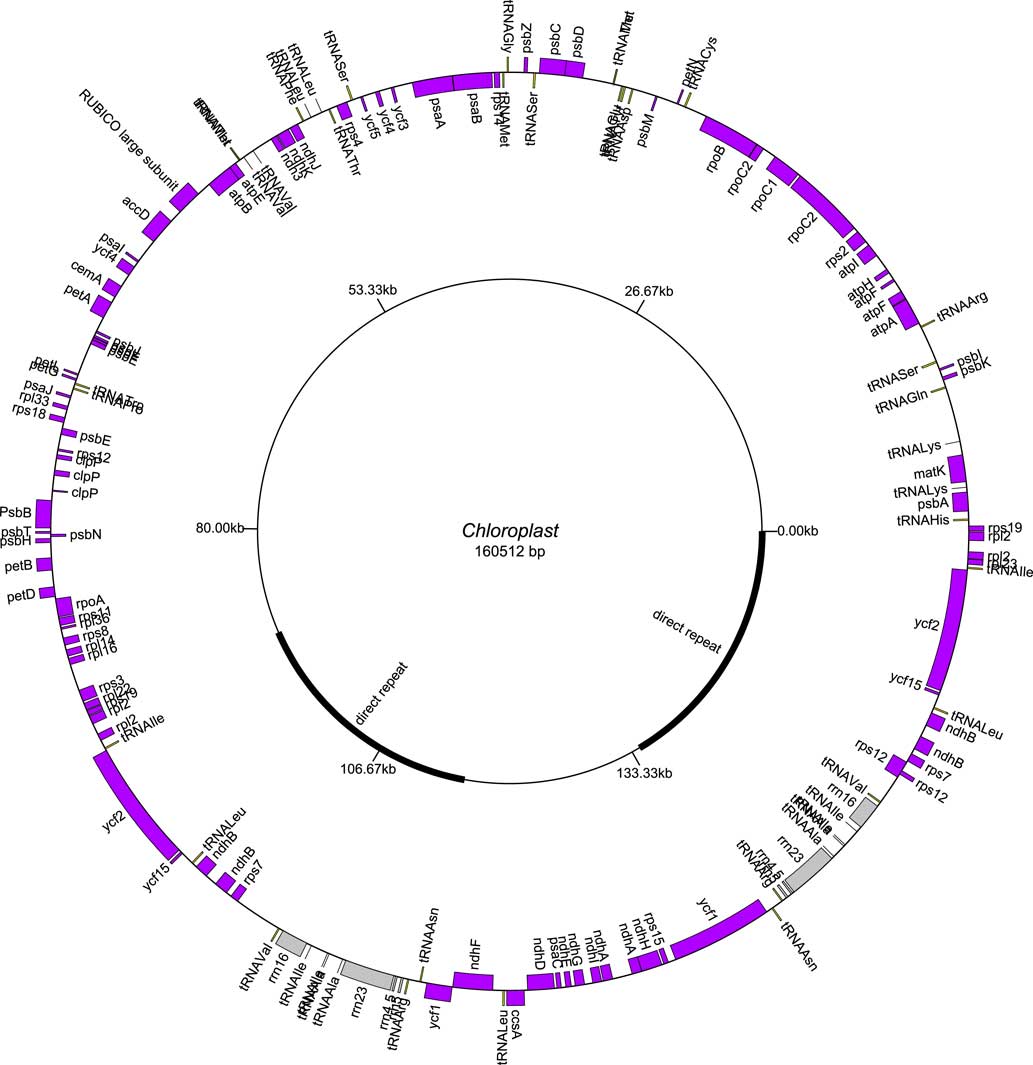
Chloroplast sequences should be well represented in our genome data sets. To assemble the chloroplast genome, we identified and assembled all of the conserved sequences from this organelle. This resulted in 7 contigs from 200 to 52,994 bases in size for the chloroplast. Gaps were filled in, and a single circular contig of 160,512 bases was generated for the E. esula chloroplast (GenBank accession NC_033910.1) (Figure 4). The size of this contig is in line with chloroplast sequences from related species such as M. esculenta (Daniell et al. Reference Daniell, Wurdack, Kanagaraj, Lee, Saski and Jansen2008) and R. communis (Rivarola et al. Reference Rivarola, Foster, Chan, Williams, Rice, Liu, Melake-Berhan, Creasy, Puiu, Rosovitz, Khouri, Beckstrom-Sternberg, Allan, Keim, Ravel and Rabinowicz2011). All major genes normally found in Euphorbia spp. chloroplasts were present in the E. esula assembly, including the intron in the AtpF gene that was lost in the M. esculenta genome (Daniell et al. Reference Daniell, Wurdack, Kanagaraj, Lee, Saski and Jansen2008). However, some evidence for novel RNA editing was observed. For example, the CemA and NdhB genes both have alternative start codons, and this has not been previously observed in other plant species—except in the case of the NdhB gene, where a GenBank search indicated the variant is found in the sequence of several E. esula voucher specimens and also in the sequence of a voucher specimen of snow-on-the-mountain (Euphorbia marginata Pursh). These alternative start codons were confirmed by examining the independently assembled and sourced transcriptome data. In the case of the CemA gene, the E. esula gene model lacks a C at base 22 that is found in the R. communis CemA gene, resulting in the E. esula gene being out of frame and requiring a the likely edited novel start site we indicate. In the case of the NdhB gene, the start site for this gene in both M. esculenta and R. communis is the standard ATG sequence. In both of these cases, the variation is the common C to U transition found in many other edited chloroplast sequences (Freyer et al. Reference Freyer, Kiefer-Meyer and Kossel1997).
Circular map of the Euphorbia esula chloroplast sequence. Pink, protein-coding genes; light gray, ribosomal coding sequences; dark gray, tRNA sequences. Gene names are provided. Genes on the outside of the circle are in the plus orientation, and those in the inside are in the reverse orientation. The ubiquitous direct repeat is noted on the inside circle in black. The inner circle also notes the size of the plasmid genome.

We were unable to assemble a contiguous mitochondrial contig. Starting with the 18 contigs greater than 200 bases in size for the mitochondrial sequences, we eventually assembled and extended these to cover ~300 kb in 13 contigs ranging in size from 222 to 50,355 bases (Supplementary File 5). Preliminary mapping of these fragments to the R. communis mitochondrial genome suggests that we have several rearrangements and gaps. Rearrangements and even multiple circular subchromosomal molecules are common in plant mitochondrial genomes, making assemblies more difficult (Palmer and Herbon Reference Palmer and Herbon1988). Further sequencing with long-read technologies will be needed to complete the assembly of the mitochondrial genome.
Conclusion
A limited number of weeds have significant genomic sequence data available, with the most complete analyses being done on various composite weeds (Lai et al. Reference Lai, Kane, Kozik, Hodgins, Dlugosch, Barker, Matvienko, Yu, Turner, Pearl, Bell, Zou, Grassa, Guggisberg, Adams, Anderson, Horvath, Kesseli, Burke, Michelmore and Rieseberg2012). Most notably, a draft sequence of E. canadensis was published in 2014 (Peng et al. Reference Peng, Lai, Lane, Nageswara-Rao, Okada, Jasieniuk, O’Geen, Kim, Sammons, Rieseberg and Neal Stewart2014). The genomes of A. tuberculatus and kochia [Bassia scoparia (L.) A. J. Scott] are currently being assembled (P Tranel and P Westra, personal communication). By combining the previously published RNA-seq data sets with a limited amount of short paired-end Illumina-generated genomic sequence, we were able to assemble a substantial portion of the gene-coding regions of the invasive perennial weed E. esula. This was accomplished even though E. esula has a fairly complex auto-allohexaploid genome. Even though we had less than 20X coverage, we were able to successfully assemble and annotate the entire chloroplast genome and large portions of the mitochondrial genome. We were also able to create a database of putative promoter sequences that should be useful for defining potential transcription factor–binding sites from transcriptomics studies on drought responses and dormancy transitions previously performed on E. esula (Doğramaci et al. Reference Doğramaci, Horvath and Anderson2015b). We also discovered that there are novel RNA-editing processes active in the chloroplasts of E. esula. Although long-read sequences would be needed to create a finished genome assembly, this study provides an efficient blueprint for low-cost sequence analysis of other weed species. Such efforts will provide critical information on the physiology and biology of weeds and a better understanding of weediness traits, weed evolution, and herbicide resistance.
Acknowledgements
This work would not have been possible without the dedicated efforts of USDA-ARS employees Laura Kelley, Brant Bigger, Wayne Sargent, and Cheryl Huckle. Additionally, discussions and bioinformatics assistance from Roger Barthelson at CyVerse and Brian Bushnell on the http://seqanswers.com/forums, and Shiaoman Chao at the USDA-ARS were critical and invaluable. Mention of trade names or commercial products in this publication is solely for the purpose of providing specific information and does not imply recommendation or endorsement by the U.S. Department of Agriculture. USDA is an equal opportunity provider and employer. No conflicts of interest have been declared.
Supplementary material
To view supplementary material for this article, please visit https://doi.org/10.1017/wsc.2018.2