Nomenclature
Abbreviations
- BE
-
Boltzmann equation
- DSMC
-
direct simulation Monte Carlo
- MD
-
molecular dynamics
- NSF
-
Navier-Stokes Fourier
- PPC
-
particles per cell
Symbols
-
 ${C_p}$
-
pressure coefficient
-
${C_f}$
-
skin friction coefficient
-
${C_h}$
-
heat transfer coefficient
- d
-
molecular diameter [m]
- f
-
distribution function
- h
-
characteristic length-(Cavity height) [m]
-
${\rm{H}}$
-
channel height [m]
-
${k_b}$
-
Boltzmann constant
-
${\rm{Kn}}$
-
Knudsen number
- m
-
molecular mass [kg]
-
${\rm{Ma}}$
-
Mach number
- n
-
number density [m−3]
- N
-
number of molecules
- p
-
pressure [N/m2]
- q
-
heat flux [W/m2]
- R
-
gas constant [J/mol. K]
-
${\rm{Re}}$
-
Reynolds number
- t
-
time [s]
- T
-
temperature [K]
-
$X$
-
distance in
$x$
-direction [m] -
$Y$
-
distance in
$y$
-direction [m]


Greek symbols
-
$\chi $
-
mole fraction
-
$\omega $
-
viscosity-temperature index
-
$\rho $
-
density of the gas [kg/m3]
-
$\mu$
-
viscosity of the gas [N.s/m2]
-
$\tau $
-
shear stress [N/m2]
-
$\lambda $
-
mean free path [m]
-
$\zeta $
-
degree of freedom
-
${\bf{\Delta }}$
-
timestep
-
${\rm{\Theta }}$
-
vibrational temperature
-
$\delta $
-
boundary layer thickness


Subscripts
-
$\infty $
-
free stream
- w
-
wall
- R
-
rotational
- T
-
translational
- V
-
vibrational
-
$ov$
-
overall


1.0 Introduction
Aerospace vehicles experience severe thermal and aerodynamic stresses while re-entry into the atmosphere, thereby demanding a careful construction of a thermal shield. It is generally desired to have a smooth shape of the re-entry vehicles. Still, discontinuities such as steps, gaps or cavities are often inevitable due to the placement of certain sensors, manufacturing tolerances, and the different expansion rates when dissimilar materials are adopted. Since these vehicles move at high velocities, often hypersonic, and encounter various regimes during their path, these surface discontinuities can be a prospective cause of high heat loads. These heat loads can create a sudden transition to turbulence and cause flow separation [Reference Kumar and Vengadesan1–Reference Zukoski5]. Thus, there is an inherent need to determine these loads for the vehicle to function safely [Reference Gallis, Boyles and LeBeau6, Reference Board7]. The estimation of these thermal and aerodynamic loads can be carried out by experimentation, which is a very costly affair. Numerical modeling and computations can be performed relatively easily and steadily, gaining significance [Reference Bird8–Reference He, He and Cai10].
Among the various surface discontinuities, the flow over a cavity is among the several forms of conceptual designs commonly seen in thermal protection systems of re-entry aerospace vehicles. The analysis of cavity flows offers a more in-depth perspective into the flow field and surface properties of those geometries similar in nature. The flow rarefaction is determined using the Knudsen number (
 ${\rm{Kn}}$
) [Reference Jun and Boyd11, Reference Darbandi and Roohi12] given by,
 \begin{align}{\rm{Kn}} = \frac{\lambda }{h}\end{align}
where
 $\lambda $
depicts the mean free path, and
 ${\rm{h}}$
is the characteristic dimension under consideration.
The Knudsen number classifies the flow regimes as [Reference Mohammadzadeh, Roohi, Niazmand, Stefanov and Myong13–Reference Loth, Tyler Daspit, Jeong, Nagata and Nonomura15]:
 ${\rm{Kn\;}} \le {\rm{\;}}0.001$
(Continuum regime),
 $0.001{\rm{\;}} \le {\rm{\;Kn\;}} \le {\rm{\;}}0.1$
(Slip regime),
 $0.1{\rm{\;}} \le {\rm{\;Kn\;}} \le {\rm{\;}}10$
(Transitional regime) and
 ${\rm{Kn\;}} \geq {\rm{\;}}10$
(Free-molecular regime). The breakdown of continuum theory occurs as the flow approaches the slip regime owing to prevalent rarefaction results, thereby requiring the use of computational alternatives, such as molecular dynamics (MD), the solution of Boltzmann equations (BE), and direct simulation Monte Carlo (DSMC) [Reference Li and Xiao16].
The
 ${\rm{Kn}}$
,
 ${\rm{Re}}$
and
 ${\rm{Ma}}$
are related to each other by the relationship given by,
 \begin{align}{\rm{Kn}} = \sqrt {\frac{{\pi \gamma }}{2}} \frac{{\rm{Ma}}}{{{\rm{Re}}}}\ {\rm{where}}\ \textrm{Ma} = \frac{{{U_\infty }}}{{\sqrt {\gamma RT} }}\ {\rm{also}},\ {\rm{Re}} = \frac{{\rho {U_\infty }h}}{\mu }\end{align}
where ρ denotes density,
 ${U_\infty }$
free-stream velocity, h cavity depth and
 $\mu $
dynamic viscosity of the fluid.
Several studies featuring experimental, numerical and analytical are carried previously for analysing the flow characteristics [Reference Charwat, Roos, Dewey and Hitz17–Reference Nestler22] on surfaces of aerospace re-entry vehicles. However, in this introduction, we shall describe numerical studies that have been carried out in the past to study the flow field structure around cavities. Mankodi et al. [Reference Mankodi, Bhandarkar and Puranik23] used the DSMC approach to investigate the flow field and surface properties over a stardust re-entry vehicle. Akhlaghi et al. [Reference Akhlaghi, Roohi and Stefanov24] used the DSMC approach with a novel flow decomposition to investigate the rarefaction effects in a lid-driven cavity. Roohi et al. [Reference Roohi, Shahabi and Bagherzadeh25] also used the DSMC approach to investigate the cold to hot heat transfer and rarefaction effects in a nano-scale isosceles triangular cavity. Mohammadzadeh et al. [Reference Mohammadzadeh, Roohi and Niazmand26] also performed a similar study for a micro-nano square cavity. Creighton and Hillier [Reference Creighton and Hillier27] carried out several studies on the hypersonic flow over annular cavities. They studied the consequence of cavity length to depth ratios on the flow field. Morgenstern and Chokani [Reference Morgenstern and Chokani28] used the CFD approach to investigate the unsteady hypersonic cavity flow and analysed the influence of Reynolds number and cavity length to height ratios (
 $L/H$
) on the heat transfer rates. Palharini et al. [Reference Palharini, Scanlon and Reese29] employed the DSMC approach to investigate the cavity flow and studied three-dimensionality’s effect on the aerodynamic properties. Santos et al. [Reference Paolicchi and Santos30] studied the impact of change in cavity height for a range of (
 $L/H$
) ratio on the aerodynamic properties in a hypersonic cavity flow using DSMC. Guo et al. [Reference Guo and Luo31] applied the DSMC approach to numerically investigate the rarefied flow over various cavity shapes. They studied the effect of length-to-depth ratio, rear wall-to-front wall height ratio, and the inclination of the front wall and rear wall on the flow field properties. Guo et al. [Reference Guo and Luo32] also studied the 2-D hypersonic cavity flow for various Knudsen numbers ranging from continuum to transition regime and investigated the associated flow-field properties. Palharini et al. [Reference Palharini, Scanlon and White33] employed the Quantum Kinetic (QE) modeling using the DSMC method to simulate chemical reactions for investigating the flow-field structure characteristics in a 3-D hypersonic flow over a cavity for several length-to-depth (
 $L/D$
) (length to depth) ratios. In another study, Palharnini et al. [Reference Palharini and Santos34] applied the DSMC method and conducted a thorough analysis on the effect of change in cavity length for different (
 $L/D$
) ratios of the cavity in the transitional regime. Jin et al. [Reference Jin, Wang, Cheng, Wang and Huang35] using the DSMC approach studied the impact of the Maxwellian accommodation coefficient on the rarefied hypersonic flows over 3-D cavity flows in the transitional regime.
From the literature study, it is observed that the majority of the studies employ the DSMC method due to its capability of modeling flows involving various rarefaction regimes. Nonetheless, the aerothermodynamic conditions encountered by hypersonic re-entry vehicles are challenging to analyse owing to the multiple complexities involved. Therefore, the physical dynamics of such extremely rarefied hypersonic flows are not adequately recorded in the open literature. Also, a significant chunk of the work focuses on studying the effects of cavity geometry, primarily in the transitional regime. Minimal studies have been carried out on cavity flows in the other regimes, particularly the free molecular regime. This paper aims to bridge the gap and explores the flow-field and aerodynamic properties for non-reacting hypersonic cavity flow. The study mainly focuses on examining the influence of the Mach number and Knudsen number on the flow field and aerodynamic characteristics.
This study is structured into the following sections: Section 2 summarises the computational technique employed. Section 3 summarises the validation and verification studies carried out. Section 4 thoroughly illustrates the Mach number and Knudsen number effects on the flow field and surface properties. Also, a comparison is made with chemically reacting flows to explain the differences observed. Finally, Section 5 lists critical conclusions from the study.
2.0 Methodology
In this section, a brief description of the computational approach employed for the analysis, the problem statement, and the various computational parameters used in the investigation are provided.
2.1 Direct simulation Monte Carlo
Pioneered by Bird [Reference Bird36] in the early 1960s, the DSMC method is one of the most popular and successful techniques to analyse rarefied gas flows. The DSMC method is a probabilistic method for modeling gas flows in a rarefied regime [Reference Jin, Huang, Cheng, Wang and Wang37]. This technique involves simulated particles, each representing a substantial number of actual molecules. The motion of particles and their collision interactions describe the physics of gas. The transportation of mass, momentum and energy at the microscopic size is assessed. Movements are modeled in a deterministic way, whereas the collisions in a stochastic manner. The separation of the deterministic molecular movements and the stochastic inter-molecular collisions form the central hypothesis of the DSMC technique. The particle data averaged over a considerable number of time steps; mostly millions give the macroscopic properties. Despite the development of other methods, the DSMC plays an important role in solving rarefied gas dynamics problems. It addresses many issues, including high-altitude aerodynamics, plume impingement, laser ablation and rarefied plasma [Reference Cai, Zheng, Liu, Ren and He38–Reference You, Zhang, Zhang, Li, Xu, Yan, Yu, Liu, Li, Wang, Zhao, Zhang, Xu, Chen, Lin, Fu, Gao, Wang, Wang and Zhi40]. The technique can also be implemented to the continuum regime; however, it is computationally costly [Reference Walsh, Berthoud and Allen41].
As known, the air density declines steadily as the elevation rises, and the effects of rarefaction effects are more prevalent. Also, the flow enters the free-molecular regime, the breakdown of Navier Stokes Fourier (NSF) equations takes place [Reference Mohammadzadeh, Roohi, Niazmand, Stefanov and Myong13], paving the way to use the Boltzmann equation [Reference Zhang, Liu and Jin42]. The Boltzmann equation is not handled directly by the DSMC technique; instead, it is a mere simulation technique that models the flow physics. The Boltzmann equation [Reference Cercignani43] is given by,
 \begin{align}{{\partial f} \over {\partial t}} + \boldsymbol{{v}}.{\nabla _{\boldsymbol{{x}}}}\,f = {1 \over {{\rm{Kn}}}}Q\!\left( {f,f} \right),\;\;\boldsymbol{{x}}\varepsilon {{\mathbb R}^{dx}}\;,\;\boldsymbol{{v}}\varepsilon {{\mathbb R}^{dv}}\end{align}
Where
 $f\!\left( {t,x,v} \right)$
represents the density distribution function at a location
x
, velocity
v
and at time t.
 ${\rm{Kn}}$
signifies the Knudsen number and the collision operator
 $Q\!\left( {f,f} \right)$
indicates the binary collisions that occur.
The DSMC process involves calculation at every time step the movement and intermolecular collision of a finite number of fictitious particles separately, considering that each particle constitutes a considerable number of actual particles. The physical space under investigation is represented by a computational grid, divided into many cells for selecting collision pairs. The cell sizes should be kept of the order of or smaller than the local mean free path [Reference Alexander, Garcia and Alder44]. Also, the timestep used should be smaller than the mean collision time [Reference Hadjiconstantinou45]. The DSMC technique is susceptible to many statistical errors as it is probabilistic centred and relies on multiple thousands or millions of simulated molecules. Quantitative research showed that such errors were inversely proportional to the sample size square root. Thus, a condition of a minimum number of DSMC particles per cell (PPC) should be satisfied. Therefore, to decrease this significant error, an exact DSMC simulation should involve an appropriate number of particles in a cell, generally 15–20. However, this brings its own computational challenges. Therefore, it is necessary to determine the optimum number of particles in each cell so that statistical accuracy, along with a realistic computational expenditure, can be maintained.
There are many schemes to select a collision pair; a review is given in Refs. (Reference Roohi and Stefanov46 and Reference Roohi, Stefanov, Shoja-Sani and Ejraei47). Here, the No Time Counter scheme (NTC) [Reference Abe48] is employed. The DSMC also involves numerous collision models explained in Ref. (Reference Prasanth and Kakkassery49); among them, the Variable Hard Sphere (VHS) collision model is adopted here.
In this study, DSMC computations employed the dsmcFoam code [Reference Scanlon, Roohi, White, Darbandi and Reese50, Reference White, Borg, Scanlon, Longshaw, John, Emerson and Reese51]. The code is highly efficient and scalable by adapting efficient parallelisation techniques such as OpenMPI. The code has been validated on various problems in rarefied gas flows.
2.2 Problem statement
The schematic illustration of the 2D cavity is shown in Fig. 1. The fluid movement occurs from left to right. The flow along the streamwise and transverse directions is depicted by the coordinates x and y. The length and depth of the cavity were fixed to 3mm. The domain height at the outlet was set at
 ${\rm{H}} = 60{\rm{mm}}$
after conducting an influence study on the flow properties.
Schematic illustration of the 2-D cavity problem.

2.3 Boundary conditions and computational grid
The different boundary conditions applied on the surfaces and dimensions of all the parameters are as shown in the computational domain in Fig. 1. The left and top boundaries represent the far-field boundary condition through which the simulated particles enter and leave the domain. The right boundary denotes the outlet, where the particles exit [Reference Akhlaghi, Balaj and Roohi52, Reference Guo and Liaw53]. The solid boundary (blue) represents the open cavity and is given a diffused reflection with full thermal accommodation condition. In a diffuse reflection model, the simulated molecules are equally reflected in all directions. The initial length of 15mm from the inlet to the edge of the cavity represents symmetry and is used to accomplish a precise velocity in the perpendicular directions [Reference Roohi and Stefanov46]. Thus, this surface is analogous to a specular reflecting model.
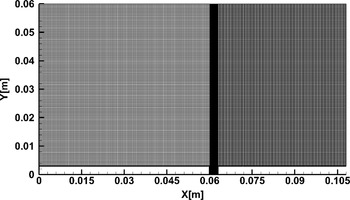
The computational domain is divided into several blocks and meshed in a structured manner, as shown in Fig. 2. The cell widths in both
 $X{\rm{\;}}$
and Y directions were maintained below the mean free path, i.e.
 ${\rm{\Delta }}{x_{cell}}$
,
 ${\rm{\Delta }}{y_{cell}}{\rm{\;}}$
< 0.3
 ${\lambda _\infty }$
. The cell size was refined near the cavity. The total number of cells for the case of
 ${\rm{Kn}} = 1.06$
was about 40,548 cells. Also, the cell count varied for other cases depending on the corresponding mean free path.
The meshed domain.

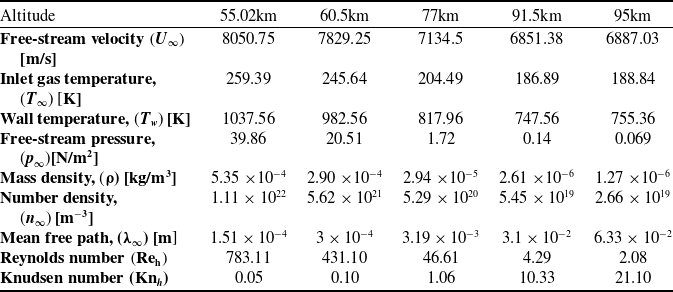
Tables 1 and 2 show the gas properties and the free-stream flow parameters employed in the present simulations. Such flow characteristics are experienced by a hypersonic vehicle during its re-entry and are taken from the U.S. Standard Atmosphere charts [54]. The fluid considered is non-reacting air having a molecular weight of about 28.96g/mol with a major composition of 76%
 ${{\rm{N}}_2}$
and 23%
 ${{\rm{O}}_2}$
. The inflow Mach number considered was
 ${\rm{Ma}} = 25$
and it was constant for all cases. Also, all the wall surface
 $({T_w})$
was maintained at four times the free-stream temperature
 $4{T_\infty }$
. In the initial studies, the simulations were conducted considering air as non-reacting rarefied perfect-gas and the chemical reactions were relaxed. This assumption has been used in numerous published studies [Reference Palharini, Scanlon and Reese29, Reference Palharini and Santos34, Reference Jin, Wang, Cheng, Wang and Huang35, Reference Leite and Santos55]. In Table 3,
 ${\rm{\chi }}$
denotes the mole fraction, m denotes the molecular mass, d the molecular diameter
 $\omega $
represents temperature dependent viscosity index and
 ${\rm{\;}}\zeta $
represents the degrees of freedom.
Table 2 lists the inflow boundary conditions, which show the different atmospheric altitudes examined, ranging from 55 to 95Km. All the simulations ran for about
 $1.5{\rm{ms}}$
of flow time, which consisted of 75,000 timesteps and employed about 276,500 simulated particles. The time averaging of the DSMC particle fields was started once the total DSMC particles reached a steady state. The solution was considered steady-state when the average linear kinetic energy of the system showed no significant variation [Reference Scanlon, Roohi, White, Darbandi and Reese50]. The Knudsen number (
 ${\rm{K}}{{\rm{n}}_{\rm{h}}}$
) and Reynolds number
 $\left( {{\rm{R}}{{\rm{e}}_{\rm{h}}}} \right)$
were estimated by choosing the cavity depth (h) as the characteristic dimension.
3.0 Model validation
In the section, the validation studies performed to assess the accuracy of the solver are explained. Firstly, without considering the chemical reactions, the validation was carried for flow over a cavity. Then, the solver was validated, accounting for the chemical reactions using a cylinder test case.
3.1 Flow over cavity
The analyses in this paper are carried out using the dsmcFoam solver. The solver has been examined in different cases [Reference Nabapure, Sanwal, Rajesh and Murthy56–Reference Nabapure and Murthy66] in our previous studies. For a comparable case of flow over the cavity, the validation studies were carried out, and the results were compared against that of Guo et al. [Reference Guo and Luo31]. Guo et al. studied the flow over a cavity in different regimes for different L/D ratios of the cavity. L denotes the cavity length, and D represents the cavity depth, respectively. The flow conditions of the case are shown in Table 3.
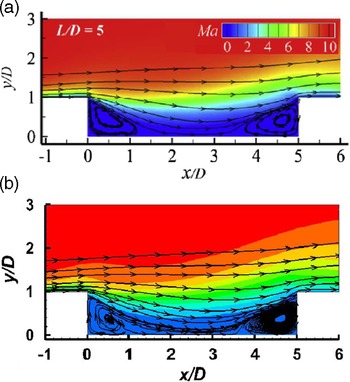
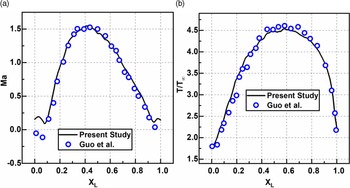
For visual validation, the Mach number contours, and the streamlines are compared. The simulated results are reasonably similar to the published results of Guo et al., as observed in Fig. 3. Furthermore, the Mach number and temperature profile along the surface at a depth
 $D = 0.5$
for an
 $L/D = 5$
is shown in Fig. 4(a) and (b). Comparing the simulated results with Guo et al. reveal no significant deviation in the profiles depicting close alignment between present DSMC computations and the other literature findings.
Properties of the gas [Reference Leite and Santos55]

Inflow boundary conditions [54]

Computational details of Guo et al. [Reference Guo and Luo31]

Distribution of Mach number contours and streamlines for cavities with
 $L/D = 5$
. (a) Published results [Reference Guo and Luo31] (b) Present study.

Comparison of (a) Mach number and (b) temperature ratio profiles for the depth of 0.5D.

3.2 Flow over cylinder
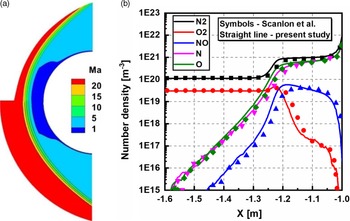
To validate the solver with incorporating the chemical reactions, a test case of the cylinder was simulated. A 2-D hypersonic rarefied air flow over a circular cylinder with a diameter of 2m, examined by Scanlon et al. [Reference Scanlon, White, Borg, Palharini, Farbar, Boyd, Reese and Brown67], was used as a standard case, and the Quantum-Kinetics (Q-K) chemical reaction model was considered. The computational conditions considered for the case are given in Table 4. The cylinder was maintained at a temperature of 1000K, and the cylinder walls are fully diffuse with full thermal and momentum accommodation coefficients. This study was carried out using dsmcFoam+. Figure 5(a) shows the comparison of contours of Mach number between Scanlon et al. and the current simulation. From the contours, a reasonable agreement among them is observed. The number density of the species along the stagnation line of the cylinder is shown in Fig. 5(b), which shows a good overlap. Thus, the findings are consistent with those reported by Scanlon et al., establishing the validity of our outcomes.
4.0 Results and discussion
In the analysis of re-entry vehicles, the flow field and the aerodynamic surface properties play a crucial role. Hence in this section, the influence of the free-stream Mach number and the Knudsen number’s influence is thoroughly investigated. The flow properties such as velocity, pressure, temperature and surface properties such as pressure coefficient, skin friction coefficient and heat transfer coefficient are presented in detail.
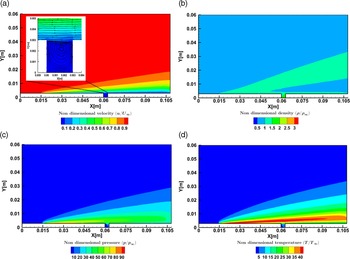
Prior to discussing the flow field and aerodynamic properties, the contours are presented in brief. For the case of
 ${\rm{Ma}} = 25$
,
 ${\rm{Kn}} = 1.06$
, the various flow-field contours are shown in Fig. 6. Figure 6(a) shows the non-dimensional velocity contour that depicts the hydrodynamic boundary layer’s growth, with lower magnitudes at the wall and higher magnitudes away from it in the central domain. Downstream of the step, the velocity magnitudes are very low due to flow recirculation. Also, the band of near-wall low velocity extends from the step to the outlet region.
The non-dimensional density contour shown in Fig. 6(b) shows a higher density near the upstream wall and a gradual reduction away from it. The density magnitude is close to one in the majority of the computational domain. The region close to the step has low-density magnitudes due to the recirculation and expansion effects. Furthermore, a high-density magnitude band arises from the upstream surface and traverses towards the top surface, causing a regionalised density rise.
The non-dimensional pressure contour is shown in Fig. 6(c), which attain greater values at the upstream wall and are one order greater than that of free-stream. Due to the minimal influence of the step in the central domain, pressure attains the free-stream value. In the downstream direction, the pressure magnitudes are very low due to the recirculation. Also, the wall pressures are lower than their upstream counterparts, primarily due to the flow expansion.
The non-dimensional temperature contour is shown in Fig. 6(d), which follows the pressure contour and depicts higher magnitudes near the wall due to the viscous heating and compressibility phenomena. The band of high temperature at the step height level continues to dissipate the energy farther downstream of the step. Similar to the pressure contour, the non-dimensional temperature also shows lower magnitudes close to the step; however, these low temperatures are confined to a lower region than the pressure.
Computational details of Scanlon et al. [Reference Scanlon, White, Borg, Palharini, Farbar, Boyd, Reese and Brown67]

(a) Mach number contour reported by Scanlon et al. [Reference Scanlon, White, Borg, Palharini, Farbar, Boyd, Reese and Brown67] (lower half) and current simulation results (upper half), (b) Number density along the stagnation line.

Contours of non-dimensional (a) velocity, (b) density, (c) pressure, and (d) temperature for
 $ {\rm Ma} = 25$
and
 ${\rm{Kn}} = 1.06$
.

Compressibility (
 ${\rm{Z}}$
) contour for
 $ {\rm Ma} = 25$
and
 ${\rm{Kn}} = 1.06$
.

The compressibility (Z) contour is shown in Fig. 7. The compressibility factor shows the departure of the gas from the ideal behaviour and is given by
 \begin{align}Z = \frac{p}{{\rho RT}}\end{align}
where p denotes the pressure,
 $\rho $
the density, R the gas constant, and T is the temperature.
The regions of higher Z magnitudes are witnessed on the upstream surface due to the shear effects. A similar trend is noticed downstream of the step; however, the magnitudes of Z are lower compared to the upstream. Inside the cavity, the magnitudes of Z are relatively low, depicting equilibrium.
4.1 Influence of Mach number
In this section, the influence of Mach number (
 ${\rm{Ma}})$
is presented. The various
 ${\rm{Ma}}$
considered for analysis were 5, 10, 25, and 30. The Knudsen number and wall temperature was fixed to
 ${\rm{Kn}} = 1.06$
and
 ${T_w} = 4{T_\infty }$
respectively. Along the transverse direction, the properties are evaluated at four different X locations, namely
 $X = 30$
,
 $59$
,
 $64$
and
 $93{\rm{mm}}$
, respectively. (The dashed purple line in the following figures represents the level of the cavity height
 $h = 0.003{\rm{m}}.$
)
4.1.1 Flow properties
a) Velocity field
The non-dimensional velocity
 $\left( {u/{U_\infty }} \right)$
variation for various
 ${\rm{Ma}}$
at sections
 $X = 30{\rm{mm}}$
,
 $X = 59{\rm{mm}}$
,
 $X = 61{\rm{mm}}$
and
 $X = 93{\rm{mm}}$
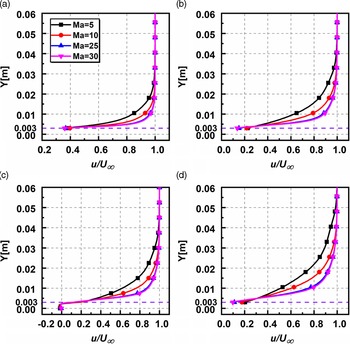
is shown in Fig. 8(a–d). Y denotes the perpendicular distance in y-direction above the cavity surface. The non-dimensional velocity at
 $X = 30{\rm{mm}}$
and
 $X = 59{\rm{mm}}$
are found to be overlapping for different
 ${\rm{Ma}}$
away from the wall, depicting the flow is not influenced due to the presence of the cavity. Inside the cavity for
 $X = 61{\rm{mm}}$
, the non-dimensional velocities are negative, portraying flow recirculation. This observation aligns with the continuum results of Grotowsky and Ballmann [Reference Grotowsky and Ballmann68] and that of Camussi et al. [Reference Camussi, Felli, Pereira, Aloisio and Di Marco69] for comparative geometries. Also, the plots overlap for different Ma up to the height of the cavity and deviate after that, signifying that the change in Ma has relatively less influence on the velocity field inside the cavity. At section
 $X = 93{\rm{mm}}$
, away from the bottom surface, the variation is similar to the one found on the upstream side. Near-wall slip is observed at all the sections except inside the cavity where the recirculation takes place. Furthermore, the boundary layer thickness decreases with an increase in
 ${\rm{Ma}}$
as observed for continuum flows.
Non-dimensional velocity variation for various
 ${\rm{Ma}}$
at (a)
 $X = 30{\rm{mm}}$
, (b)
 $X = 59{\rm{mm}}$
, (c)
 $X = 61{\rm{mm}}$
, (d)
 $X = 93{\rm{mm}}$
.

b) Pressure field
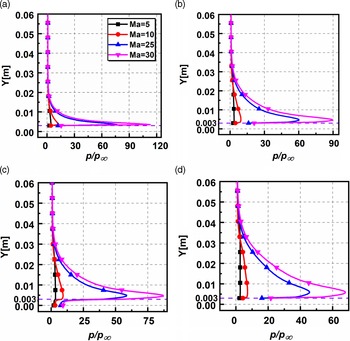
The non-dimensional pressure
 $\left( {p/{p_\infty }} \right)$
variation for various Ma at sections
 $X = 30{\rm{mm}}$
,
 $X = 59{\rm{mm}}$
,
 $X = 61{\rm{mm}}$
and
 $X = 93{\rm{mm}}$
is shown in Fig. 9(a–d). Near the inlet of the domain at
 $X = 30{\rm{mm}}$
, the pressure magnitudes are higher and are two orders greater than the free-stream pressure. At
 $X = 59{\rm{mm}},$
the pressure magnitudes are less and show deviation for different Ma. Inside the cavity at
 $X = 61{\rm{mm}},$
the pressure magnitudes are lower due to the recirculation and expansion effects. Below the cavity depth (for
 $Y \lt 0.003$
), the pressure reduces and attains the free-stream magnitudes, whereas, above the cavity (for
 $Y \gt 0.003$
), the pressure magnitudes reach a peak shortly, after that the profiles overlap near the centre of the domain. For reference, at section
 $X = 61{\rm{mm}}$
, the peak pressure ratios are 3.41, 9.22, 58.57 and 87.03 for Mach numbers 5, 10, 25 and 30. Also, for different Ma, the near-wall pressure is relatively similar when compared to the other sections. The pressure magnitudes are lower downstream of the cavity and show distinct variation for different Ma and attain free-stream magnitudes at a more considerable distance in the transverse direction. Thus, the non-dimensional pressure magnitudes are directly influenced by the Ma and increase with increasing Ma due to viscous heating.
Non-dimensional pressure variation for various Ma at (a)
 $X = 30{\rm{mm}}$
, (b)
 $X = 59{\rm{mm}}$
, (c)
 $X = 61{\rm{mm}}$
, (d)
 $X = 93{\rm{mm}}$
.

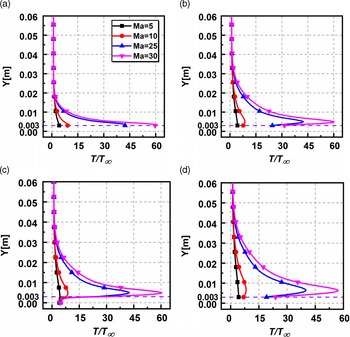
c) Temperature field
The non-dimensional temperature
 $\left( {T/{T_\infty }} \right)$
variation for different Ma at sections
 $X = 30{\rm{mm}}$
,
 $X = 59{\rm{mm}}$
,
 $X = 61{\rm{mm}}$
and
 $X = 93{\rm{mm}}$
is shown in Fig. 10(a–d). In
 $X = 30{\rm{mm}},$
the temperatures near the wall are of higher magnitudes than the imposed wall temperature owing to viscous heating effects and soon overlap in the transverse direction. The profiles in section
 $X = 59{\rm{mm}}$
are similar but take a longer distance in the transverse direction to coincide and attain temperature close to the free-stream magnitude. Inside the cavity at
 $X = 61{\rm{mm}},$
identical to the pressure, the near-wall temperatures for different Ma seem to be unaffected and are found to be relatively the same. This is due to the recirculation region, which causes the flow to stagnate and reduces the temperatures. For quantitative assessment at section
 $X = 61{\rm{mm}}$
, on the top face of the cavity, the peak temperature ratios are 4.39, 8.70, 42.50 and 60.44 for Mach numbers 5, 10, 25 and 30. Near the exit of the domain at
 $X = 93{\rm{mm}},$
the plots are similar but of a marginally lower magnitude. At the same level as the cavity entrance, the peak magnitudes of temperatures are observed in the shear layer. Thus, it is observed that similar to the pressure; the temperatures are directly influenced by the change in Ma and show an increasing trend.
Non-dimensional temperature variation for various Ma (a)
 $X = 30{\rm{mm}}$
, (b)
 $X = 59{\rm{mm}}$
, (c)
 $X = 61{\rm{mm}}$
, (d)
 $X = 93{\rm{mm}}$
.

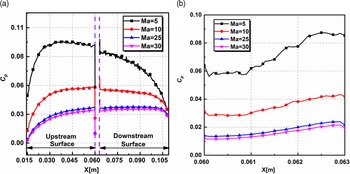
Variation of pressure coefficient
 ${C_p}$
(a) on the upstream and downstream surfaces (b) on the cavity base for various Ma.

4.1.2 Aerodynamic surface properties
a) Pressure coefficient
The variation of pressure coefficient (
 ${C_p}$
) for different Ma on the upstream, downstream, and the base surface of the cavity is shown in Fig. 11(a–b),
 ${C_p}$
is given by
 \begin{align}{C_p} = \frac{{{p_w} - {p_\infty }}}{{\frac{1}{2}{\rho _\infty }{U_\infty }^2}}\end{align}
where,
 ${p_w}$
denotes pressure at the wall,
 ${\rm{\;}}{U_\infty }$
is the free-stream velocity,
 ${p_\infty }$
the free-stream pressure and
 ${\rho _\infty }{\rm{\;}}$
the free-stream density, respectively. Equation (6) shows that the pressure at the wall is extracted by computing the summation of momentum fluxes in the perpendicular direction for the incident and reflected molecules at every time step.
 \begin{align}{p_w} = {p_{inc}} - {p_{ref}} = \frac{{{F_N}}}{{A\Delta t}}\mathop \sum \limits_{j = 1}^N \left\{ {{{\left[ {{{(mv)}_j}} \right]}_{inc}} - {{\left[ {{{(mv)}_j}} \right]}_{ref}}} \right\}\end{align}
where,
 ${F_N}$
signifies the amount of real particles that are characterised by each simulated particle, A denotes the surface area,
 ${\rm{\;}}\Delta t$
denotes the time step, m represents the mass of the particles, N indicates the number of particles colliding with surface per unit time per unit area and
 ${\rm{\;}}v$
denotes perpendicular component velocity of particle j. Subscripts
 $inc{\rm{\;}}$
and ref signify the incident and reflected molecules, respectively.
Figure 11(a) shows that the pressure coefficient
 ${C_p}$
is found to behave in a similar manner for different Ma, showing a nonlinear trend, resembling a parabolic profile. Along the upstream surface, the magnitude of
 ${C_p}$
gradually increases from the inlet. At the edge of the cavity the
 ${C_p}$
reduces significantly. This can be attributed to the flow being expanded due to the increased area. Along the beginning of the downstream surface, stagnation pressure causes a surge in magnitudes of
 ${C_p}$
. Subsequently the
 ${C_p}$
shows a reducing trend towards the outlet. At the outlet, the magnitudes of
 ${C_p}$
are greater than zero showing that the wall pressure is greater than the free-stream pressure. Inside the cavity, as shown in Fig. 11(b), the pressure coefficient
 ${C_p}$
has a significantly lower magnitude due to the flow recirculation which causes a reduction in pressure. Along the cavity the
 ${C_p}$
gradually increases for the lowest case of
 ${\rm Ma} = 5$
, whereas it is reasonably constant for the other cases. Thus, to summarise, the increase in Ma causes a reduction in
 ${C_p}$
. As the Mach number increases the free-stream velocity increases and the contribution of the inertial term
 $\frac{1}{2}{\rho _\infty }{U_\infty }^2$
in the Equation (5) which causes a reduction in the magnitude of pressure coefficient.
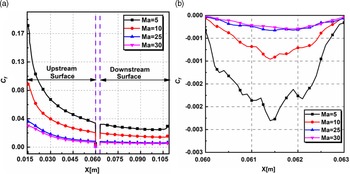
b) Skin friction coefficient
The skin friction coefficient (
 ${C_f}$
) variation for different Ma on the upstream, downstream and the base surface of the cavity is shown in Fig. 12(a–b).
 ${C_f}$
is given by
 \begin{align}{C_f} = \frac{{{\tau _w}}}{{\frac{1}{2}{\rho _\infty }{U_\infty }^2}}\end{align}
where,
 ${\tau _w}$
denotes the shear stress at the wall,
 ${\rm{\;}}{U_\infty }$
is the free-stream velocity, and
 ${\rho _\infty }{\rm{\;}}$
the free-stream density. The shear stress at the wall is extracted by computing the summation of the tangential momentum fluxes of the incident and reflected molecules at every time step and is given by,
 \begin{align}{\tau _w}{\rm{\;}} = {\tau _{inc}} - {\tau _{ref}} = \frac{{{F_N}}}{{A\Delta t}}\mathop \sum \limits_{j = 1}^N \left\{ {{{\left[ {{{(mu)}_j}} \right]}_{inc}} - {{\left[ {{{(mu)}_j}} \right]}_{ref}}} \right\}\end{align}
where u is the tangential component of the velocity of particle j.
Variation of skin friction coefficient
 ${C_f}$
(a) on the upstream and downstream surfaces (b) on the cavity base for various Ma.

In the present study, the walls are modeled using diffuse reflection gas-surface interaction; hence the tangential momentum of the reflected molecules is zero. Therefore, Equation (8) reduces to
 \begin{align}{\tau _w}{\rm{\;}} = {\tau _{inc}} = \frac{{{F_N}}}{{A\Delta t}}\mathop \sum \limits_{j = 1}^N \left\{ {{{\left[ {{{(mu)}_j}} \right]}_{inc}}} \right\}\end{align}
Figure 12(a) shows that the skin friction coefficient
 ${C_f}$
which follows the pressure coefficient and behaves similarly for different Ma. Along the upstream surface, the magnitude of
 ${C_f}$
is greater at the beginning due to the high-velocity gradients at the wall. This also causes the peak magnitudes of
 ${C_f}$
near the upstream edge. From the upstream edge,
 ${C_f}$
gradually decreases along X. Near the edge of the cavity
 ${C_f}$
reduces significantly. Along the downstream surface, the magnitude of
 ${C_f}$
surges quickly at a very short distance from the cavity and remains almost a constant towards the outlet. At the outlet, the magnitudes of
 ${C_f}$
are again greater than zero, as observed in the pressure coefficient. Inside the cavity,
 ${C_f}$
is found to be negative for all the cases due to the formation of recirculation region. The reduction in the magnitude is highest for the case of lowest
 $\textrm{Ma} = 5.$
Thus, similar to the pressure coefficient
 ${C_p}$
, the increase in Ma causes a reduction in
 ${C_f}$
. This trend can be explained using the relation,
 ${\rm{Kn}} = \sqrt {\frac{{\pi \gamma }}{2}} \frac{{\rm{Ma}}}{{{\rm{Re}}}}$
. For a given Knudsen number, the Mach number is proportional to the Reynolds number. Thus, as the Mach number increases, it causes an increase of the Reynolds number, leading to the domination of the inertial term in Equation (7). Thus, the magnitude of skin friction coefficient reduces with increasing Mach number. Also, the skin friction coefficient magnitudes are higher than the pressure coefficient, demonstrating tangential forces’ dominance over the normal forces.
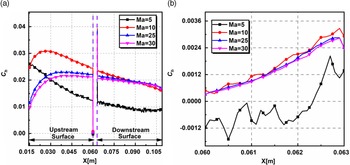
c) Heat transfer coefficient
The variation of heat transfer coefficient (
 ${C_h}$
) for different Ma on the upstream, downstream and the base surface of the cavity is shown in Fig. 13(a–b).
 ${C_h}$
is given by
 \begin{align}{C_h} = \frac{{{q_w}}}{{\frac{1}{2}{\rho _\infty }{U_\infty }^3}}\end{align}
where
 ${q_w}$
represents the heat flux at the wall,
 ${U_\infty }$
is the free-stream velocity and
 ${\rho _\infty }{\rm{\;}}$
denotes the free-stream density. The heat flux at the wall is extracted by computing the summation of the net energy flux of impinging molecules on the surface, with the flux being positive towards the surface. It is given by,
 \begin{align*}{q_w}\; = {q_{inc}} - {q_{ref}}\end{align*}
 \begin{align} = \frac{{{F_N}}}{{A\Delta t}}\left\{ {\mathop \sum \limits_{j = 1}^N {{\left[ {\frac{1}{2}{m_j}{c_j}^2 + {e_{{R_j}}} + {e_{{V_j}}}} \right]}_{inc}} - \mathop \sum \limits_{j = 1}^N {{\left[ {\frac{1}{2}{m_j}{c_j}^2 + {e_{{R_j}}} + {e_{{V_j}}}} \right]}_{ref}}} \right\}\;\;\;\;\;\;\;\;\;\;\;\end{align}
where
 ${\rm{\;}}c$
represents molecular velocity,
 ${e_R}$
and
 ${e_V}$
represent the rotational and vibrational energies, respectively.
Variation of heat transfer coefficient
 ${C_h}$
(a) on the upstream and downstream surfaces (b) on the cavity base for various Ma.

Figure 13(a) shows that the heat transfer coefficient
 ${C_h}$
which shows contrasting trends for different Ma. Towards the upstream end, the magnitude of
 ${C_h}$
is highest for
 $\textrm{Ma} = 10$
in comparison with the other cases. Also, the profiles show a gradual decrease for the case of Ma
 $ = 5$
, whereas for the other cases the
 ${C_h}$
gradually increases and shows a decline after that. The differing profiles are possibly caused by the varying boundary layer thickness at the separation [Reference Rom and Seginer70]. Along the downstream surface the
 ${C_h}$
shows a declining trend for different Ma, though, the reduction in
 ${C_h}$
is very minimal. Inside the cavity as shown in Fig. 13(b), the heat transfer coefficient
 ${C_h}$
is found to be negative for Ma
 $ = 5$
for a considerable part of the cavity. However, towards the end of the cavity the
 ${C_h}$
is found to recover and attain a positive value. For the other cases, the
 ${C_h}$
values are fairly similar and are found to increase along the cavity length gradually. At the end of the cavity the
 ${C_h}$
values are positive for all the cases due to viscous dissipation, which causes an increase in the wall heat flux and consequently the heat transfer coefficient.
4.2 Influence of Knudsen number
In this section, the influence of the Knudsen number (
 $Kn)$
is presented. The various Kn considered for analysis were 0.05, 0.10, 1.06, 10.33 and 21.10. The Mach number and wall temperature was fixed to Ma
 $ = 25$
and
 ${T_w} = 4{T_\infty }$
respectively.
4.2.1 Flow properties
a) Velocity field
The non-dimensional velocity variation for different
 ${\rm{Kn}}$
at sections
 $X = 30{\rm{mm}}$
,
 $X = 59{\rm{mm}}$
,
 $X = 61{\rm{mm}},$
and
 $X = 93{\rm{mm}}$
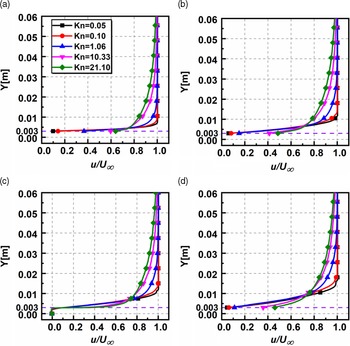
is shown in Fig. 14(a–d). The non-dimensional velocity is similar in appearance upstream of the cavity at
 $X = 30{\rm{mm}}$
and
 $X = 59{\rm{mm}}.$
Inside the cavity at
 $X = 61{\rm{mm}},$
the velocity magnitudes are negative due to the recirculation effects. This trend is also observed in the continuum study conducted by Camussi et al. [Reference Camussi, Felli, Pereira, Aloisio and Di Marco69]. Also, up to the cavity height, the velocity field is not influenced by the rarefaction effects as they are relatively the same and are found to overlapping. However, the rarefaction affects the velocity field above the cavity height, and the profiles show a deviation. At the exit of the domain at
 $X = 93{\rm{mm}}$
, the profiles resemble those observed upstream of the cavity. It is found that there is a substantial velocity slip at the walls at all sections, except inside the cavity where the velocity slip is relatively the same for different
 ${\rm{Kn}}$
. This velocity slip increases with rarefaction and falls in line with the results of Ejtehadi et al. [Reference Ejtehadi, Roohi and Esfahani71].
Non-dimensional velocity variation for various
 ${\rm{Kn}}$
at (a)
 $X = 30{\rm{mm}}$
, (b)
 $X = 59{\rm{mm}}$
, (c)
 $X = 61{\rm{mm}}$
, (d)
 $X = 93{\rm{mm}}$
.

Along the transverse direction, the non-dimensional velocity reduces with an increase in
 ${\rm{Kn}}.$
As
 ${\rm{Kn}}$
increases, the molecular mean free path increases substantially, resulting in the more significant propagation of the wall effects into the flow domain. This is corroborated quantitively by extracting the boundary layer thickness (
 $\delta $
). Here, the boundary layer thickness (
 $\delta $
) is calculated by considering
 ${\rm{u}}/{{\rm{U}}_\infty } = 0.99$
. For the top surface location considered in the present study, the boundary layer is fully established for different Kn, except
 ${\rm{Kn}} = 21.10,$
which shows a developing trend. For a particular location of
 $X = 59{\rm{mm}}$
, (
 $\delta $
) and (
 $\delta $
/H) are given in Table 5.
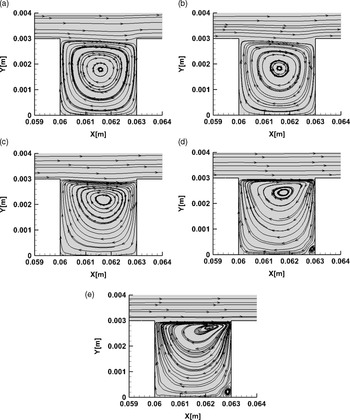
The velocity streamlines for different
 ${\rm{Kn}}$
are depicted in Fig. 15. It is observed that for all
 ${\rm{Kn}}$
, a recirculation region exists. Furthermore, streamlines of the free-molecular flow for the case of
 ${\rm{Kn}} = 10.33,21.10$
suggest that there exists a secondary smaller recirculation region. The vortex centre shifts towards the top of the cavity as the rarefaction increases. The location of the primary vortex for different
 ${\rm{Kn}}$
is shown in Table 6.
b) Pressure field
The non-dimensional pressure variation for different
 ${\rm{Kn}}$
at sections
 $X = 30{\rm{mm}}$
,
 $X = 59{\rm{mm}}$
,
 $X = 61{\rm{mm}}$
and
 $X = 93{\rm{mm}}$
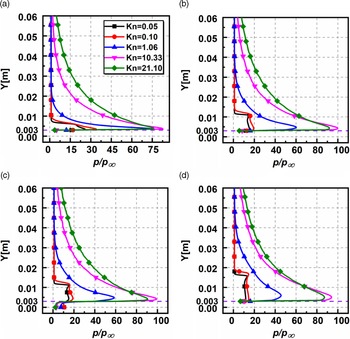
is shown in Fig. 16(a–d). The pressure plots are found to behave in a similar manner in all the sections; however, the magnitudes differ. The near-wall pressure in all the sections is higher than the corresponding free-stream pressure due to the stagnation effects. Also, in the transverse direction, pressure attains free-stream magnitude considerably quicker in the slip regime. Furthermore, the compressibility effects of the flow create a pressure surge just at the level of the cavity height. Inside the cavity at
 $X = 61{\rm{mm}}$
, the magnitudes of pressure are the same order as the free-stream. In contrast, above the cavity (for
 $Y \gt 0.003)$
, the magnitudes attain a peak (owing to the presence of shock layer upstream) and gradually decrease and attain a free-stream value. For assessment, at section
 $X = 61{\rm{mm}}$
, the peak pressure ratios are 15.36, 18.96, 58.57, 99.08 and 90.73 for
 ${\rm{Kn}}$
0.05,0.1,1.06,10.33 and 21.10. Downstream of the cavity at
 $X = 93{\rm{mm}}$
, the pressure magnitudes are relatively lower.
Boundary layer thickness (
 $\delta $
) for various
 ${\rm{Kn}}$
at
 $X = 59{\rm{mm}}$

Streamlines inside the cavity for (a)
 ${\rm{\;Kn}} = 0.05$
, (b)
 ${\rm{\;Kn}} = 0.1$
, (c)
 ${\rm{\;Kn}} = 1.06$
, (d)
 ${\rm{\;Kn}} = 10.33$
, (e)
 ${\rm{\;Kn}} = 21.10$
.

c) Temperature field
The non-dimensional temperature
 $\left( {T/{T_\infty }} \right)$
variation for various
 ${\rm{Kn}}$
at sections
 $X = 30{\rm{mm}}$
,
 $X = 59{\rm{mm}}$
,
 $X = 61{\rm{mm}},$
and
 $X = 93{\rm{mm}}$
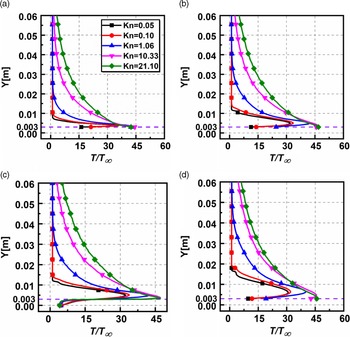
is shown in Fig. 17(a–d). The temperature profiles show a similar trend as the pressure and the magnitudes of temperature increase with increasing
 ${\rm{Kn}}$
. The compressible nature of the incoming flow leads to a significant rise in temperature at the walls. However, in contrast, inside the cavity at
 $X = 61{\rm{mm}},$
the near-wall temperature is similar for different
 ${\rm{Kn}}$
and is of the same order as the free-stream temperature.
Variation of the centre of the primary vortex for different Kn

Non-dimensional pressure variation for various
 ${\rm{Kn}}$
at (a)
 $X = 30{\rm{mm}}$
, (b)
 $X = 59{\rm{mm}}$
, (c)
 $X = 61{\rm{mm}}$
, (d)
 $X = 93{\rm{mm}}$
.

The non-dimensional temperature surges near the cavity height level and then attains free-stream temperature in the transverse direction. Also, at a given transverse location, it is found that the temperature surges with
 ${\rm{Kn}}$
. The number density of the molecules reduces with rarefaction; thereby, the viscous heating generated in the shear layer is distributed among lesser molecules causing a temperature rise. However, at lower levels of rarefactions where the molecules are significantly higher, the same intensity of viscous heating gets distributed among more molecules, inciting a reduced temperature gain. For quantitative assessment, at the section
 ${\rm{\;}}X = 61{\rm{mm}}$
, the non-dimensional temperature at
 $Y = 0.03$
are 1.00, 0.99, 2.31, 10.02 and 14.53 for
 ${\rm{Kn}}$
0.05, 0.1, 1.06, 10.33 and 21.10.
Non-dimensional temperature variation for various
 ${\rm{Kn}}$
(a)
 $X = 30{\rm{mm}}$
, (b)
 $X = 59{\rm{mm}}$
, (c)
 $X = 61{\rm{mm}}$
, (d)
 $X = 93{\rm{mm}}$
.

Variation of pressure coefficient
 ${C_p}$
(a) on the upstream and downstream surfaces (b) on the cavity base for various
 ${\rm{Kn}}$
.

Variation of skin friction coefficient
 ${C_f}$
(a) on the upstream and downstream surfaces (b) on the cavity base for various
 ${\rm{Kn}}$
.

4.2.2 Aerodynamic surface properties
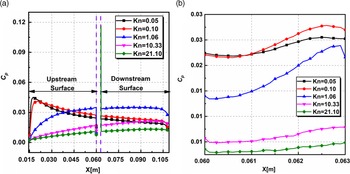
a) Pressure coefficient
The variation of pressure coefficient (
 ${C_p}$
) for different
 ${\rm{Kn}}$
on the upstream, downstream and the base surface of the cavity is shown in Fig. 18(a–b). The plot shows distinct trends in the slip regime where the profiles are similar for
 ${\rm{Kn}} = 0.05,\;0.10$
. Also, in the transition and free-molecular regimes, the profiles behave similarly. On the upstream surface, the pressure coefficient
 ${C_p}$
in the slip regime, attains a peak at a very short distance from the leading edge and then shows a gradually declining trend towards the edge of the cavity. The early peaks can probably be due to the relatively higher magnitude of near-wall pressure, as seen in Fig. 18(a). In contrast in the transition and free-molecular regime, the
 ${C_p}$
gradually rises along the flow direction (X). The peak
 ${C_p}$
on the upper surface is observed at X locations of 17.45, 20, 59, 59.40 and 59.45mm for Kn 0.05, 0.1, 1.06, 10.33 and 21.10. Along the downstream surface, the magnitudes of
 ${C_p}$
are higher in the beginning and show a reduction towards the outlet for slip regime. For the other regimes,
 ${C_p}$
attains a peak and then decreases. Inside the cavity, as shown in Fig. 18(b), the spatial variation in the pressure coefficient
 ${C_p}$
is nominal for different Kn and is found to be unaffected by the rarefaction effects.
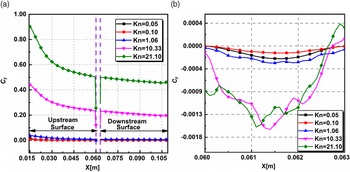
b) Skin friction coefficient
The skin friction coefficient (
 ${C_f}$
) variation for different Kn on the upstream, downstream and the base surface of the cavity is shown in Fig. 19(a–b). The plot shows that the skin friction coefficient
 ${C_f}$
at a given location increases with increasing
 ${\rm{Kn}}.$
From Equation (2), as
 ${\rm{Kn}}$
increases,
 ${\rm{Re}}$
diminishes causing the viscous forces to dominate compared to the inertial forces, which leads to an increase in shear stress and
 ${C_f}$
. Due to the strong near-wall velocities at the leading edge of the inlet, the
 ${C_f}$
is found to attain a peak value. Along the upstream surface,
 ${C_f}$
shows a declining trend and attains a lower magnitude at the edge of the cavity. Further, as the flow begins to achieve a high degree of rarefaction, the magnitude of
 ${C_f}$
tends to increase significantly. For instance,
 ${C_f}$
at the inlet, increases by two folds on transitioning from
 ${\rm{Kn}} = 10.33$
to
 ${\rm{Kn}} = 21.10$
. Along the downstream surface, the
 ${C_f}$
decreases very marginally. Inside the cavity, as shown in Fig. 19(b), the
 ${C_f}$
is negative for all the cases due to recirculation observed in the streamline plot (see Fig. 15). The decrease in
 ${C_f}$
is higher in the free-molecular regime when compared to the other regimes. Also, in the free-molecular regime, the variation in
 ${C_f}$
is significant due to the asymmetry of the vortex formed, whereas for
 ${\rm{Kn}} \le 1.06$
, the
 ${C_f}$
is relatively constant due to the symmetry in the vortex.
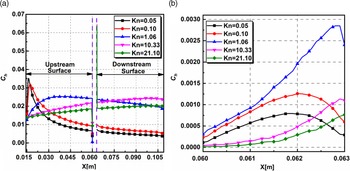
c) Heat transfer coefficient
The variation of heat transfer coefficient (
 ${C_h}$
) for different
 ${\rm{Kn}}$
on the upstream, downstream and the base surface of the cavity is shown in Fig. 20(a–b). The plots of
 ${C_h}$
and
 ${C_p}$
are similar in appearance. Also, on the upper surface, the profiles are dissimilar for different
 ${\rm{Kn}}$
. Along the upper surface of the cavity, near the leading edge, the heat transfer coefficient
 ${C_h}$
show a sudden peak in the slip regime, whereas in the other regimes the
 ${C_h}$
shows a gradually increasing trend. Near cavity base, flow expansion caused the temperature reducing, leading to a drop in the heat transfer coefficient
 ${C_h}$
. Along the lower surface the
 ${C_h}$
values are relatively constant in the slip regime, whereas they show a gradual increase in other regimes. As the rarefaction increases, particles from the middle of the computational domain collide due to the increased mean free path, causing a rise in the heat transfer coefficient.
Variation of heat transfer coefficient
 ${C_h}$
(a) on the upstream and downstream surfaces (b) on the cavity base for various
 ${\rm{Kn}}$
.

4.3 Comparison with chemically reacting flows
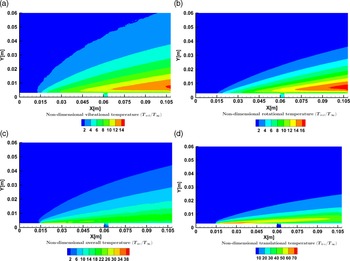
The present study involves hypersonic flow conditions, resulting in an energised system where the gas’s vibrational modes are triggered, and chemical reactions take place. Consequently, the influence of these vibrational excitations on the flow properties needs to be studied.
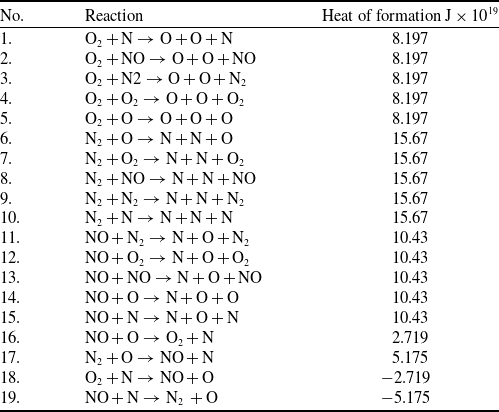
Over the years, several chemical reaction models for DSMC have been developed. Bird [Reference Nabapure and Murthy59] introduced the Total Collision Energy (TCE) model. It is one such popular chemical reaction model that uses the equilibrium kinetic theory to translate the Arrhenius rate coefficients into collision probabilities. Alternatively, Bird [Reference Bird72] proposed the Quantum-Kinetic (Q-K) chemistry model, a molecular-level chemistry model that employs the fundamental molecular properties instead of the classical TCE model, which relies on the availability of experimental data. The current research utilises the Q-K chemistry model to simulate chemical reactions of five species of air with 19 chemical reactions. This study is carried out using dsmcFoam+. Two chemical reaction types are relevant to the present discussion Dissociation (No. 1–15 in Table 7) and Exchange reactions (No. 16–19 in Table 7).
List of chemical reactions employed

To define the overall temperature, the weighted average of translational, rotational and vibrational temperatures [Reference Bird73] is taken and is given by,
 \begin{align}{T_{ov}} = \frac{{3{T_T} + {\xi _R}{T_R} + {\xi _V}{T_V}}}{{3 + {\xi _R} + {\xi _V}}}\end{align}
where
 $\xi $
represents the degree of freedom, and the subscripts T, R and V stand for translation, rotation and vibration, respectively.
The following equations give the translational, rotational and vibrational temperatures,
 \begin{align}{T_T} = \frac{1}{{3{k_b}}}\frac{{\mathop \sum \nolimits_{j = 1}^N {m_j}{c^{\prime\,2}}}}{N}\end{align}
 \begin{align}{T_R} = \frac{2}{{{k_b}{\xi _R}}}\frac{{\mathop \sum \nolimits_{j = 1}^N {{\!({\varepsilon _R})}_j}}}{N}\end{align}
 \begin{align}{T_V} = \frac{{{{\rm{\Theta }}_V}}}{{{\rm{ln}}\!\left( {1 + \frac{{{k_b}{{\rm{\Theta }}_V}}}{{\mathop \sum \nolimits_{j = 1}^N {{({\varepsilon _V})}_j}}}} \right)}}\end{align}
where
 ${\varepsilon _R}$
and
 ${\varepsilon _V}$
represent the average rotational and vibrational energies, respectively,
 ${k_b}$
is the Boltzmann constant, and
 ${{\rm{\Theta }}_V}\;$
denotes the characteristic vibrational temperature, having a value equal to 3371 and 2256K for
 ${\rm{\;}}{N_2}$
and
 ${O_2}$
respectively. The rotational and vibrational collision relaxation number considered in the study was 5 and 50, respectively.
To compare chemically reacting and non-reacting cases, the flow over cavity at Ma
 $ = 25$
was studied for different
 ${\rm{Kn}}$
. When chemical reactions were considered and compared against the non-reacting flows, the flow-field properties such as velocity, pressure and density showed no marked difference. Hence, the discussion will be limited to only the temperature field. Figure 21 shows the non-dimensional temperature contours for different components of the temperature
 ${\rm{Kn}} = 1.06$
.
Contours of non-dimensional (a) vibrational, (b) rotational, (c) overall, and (d) translational temperature for
 ${\rm Ma}= 25$
and
 ${\rm{Kn}} = 1.06$
.

The vibrational component of the temperature in Fig. 21(a) is relatively lower in magnitude than the other components. The vibrational excitations appear not to affect the cavity, and as a result, the vibrational temperature shows no marked difference. However, a temperature surge is observed towards the outlet. The rotational component of the temperature is shown in Fig. 21(b). Its order of magnitude is the same as that of the vibrational component with only marginally higher values. Figure 21(c) and (d), the overall and translational components, respectively. Near the wall, the translational temperature has a much larger magnitude, which can be credited to the viscous heating effects observed in the shear layer at the top of the cavity and near the wall. The rotational and vibrational temperatures show similar behaviour. This entire effect is reflected in the contours of the overall temperature in Fig. 21(c). Rapid flow expansion is observed just upstream of the cavity and results in expansion cooling inside the cavity. This expansion cooling is the reason for the lower magnitudes of the translational temperature inside the cavity. Expansion cooling also affects the translational temperature downstream near the outlet, resulting in lower translational temperature values. At the outlet, there is a considerable decrease in the magnitude of the translational temperature. Contrasting to this behaviour, an increase in the rotational and vibrational temperatures near the outlet is visible, as shown in Fig. 21(a) and (b), respectively, due to the non-equilibrium effects. Figure 21(c) shows that the cumulative consequence of enhanced rotational and vibrational temperature is compensated by the decreased translational temperature downstream of the cavity. As a result, a relatively uniform overall temperature variation is observed downstream of the cavity.
The non-dimensional temperature variation for different
 ${\rm{Kn}}$
at sections
 $X = 30{\rm{mm}}$
,
 $X = 59{\rm{mm}}$
,
 $X = 61{\rm{mm}}$
and
 $X = 93{\rm{mm}}$
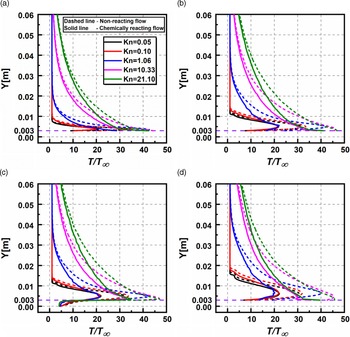
is shown in Fig. 22(a–d). It is observed that both chemically reacting and non-reacting flows follow similar trends for different
 ${\rm{Kn}}$
. However, a considerable difference in the predicted value is observed for the chemically reacting flows. The highest temperature in the shear layer is computed, and the relative change is evaluated with respect to the non-reacting flow for various locations. For instance, at
 $X = 30{\rm{\;mm}}$
the maximum temperature ratio values predicted by non-reacting flow, vary with chemically reacting flow by roughly 66.52%, 80.12%, 49.78%, 6.76% and 0.79% for
 ${\rm{Kn}} = 0.05,{\rm{\;}}0.10,{\rm{\;}}1.06,{\rm{\;}}10.33{\rm{\;and\;}}21.10$
. Similarly, inside the cavity at
 $X = 61{\rm{mm}}$
, the change in the maximum temperature is more than 35% for all
 ${\rm{Kn}}$
.
Non-dimensional temperature variation for various
 ${\rm{Kn}}$
(a)
 $X = 30{\rm{mm}}$
, (b)
 $X = 59{\rm{mm}}$
, (c)
 $X = 61{\rm{mm}}$
, (d)
 $X = 93{\rm{mm}}$
for reacting and non-reacting cases.

5.0 Conclusion
The flow over the cavity can be approximated as one of the abnormalities that can occur on the surface of a hypersonic vehicle, the study of which aids in the understanding of the flow dynamics over such vehicles. This study explores the influence of Ma and
 ${\rm{Kn}}$
on the flow field and surface properties. The DSMC method is used as a numerical tool to conduct the studies. The numerical model is validated with the literature results, and a good agreement is found among them. The main conclusions are listed as follows:
-
1. The flow field properties such as velocity, pressure and temperature significantly rise with Mach number, owing predominantly to the viscous dissipation. Inside the cavity, the trends were similar except for the velocity field that showed a contrasting trend.
-
2. Rarefaction of the flow caused a reduction in the velocity due to the increased boundary layer thickness. The pressure field and temperature field increased with increasing Knudsen number. Inside the cavity, no definitive trend was observed.
-
3. The presence of the cavity is felt by the flow field only in the immediate vicinity of it, and trends in the variation of the flow properties far away from it are mostly unaffected.
-
4. Inside the cavity, flow recirculation was observed in all regimes. The recirculation was symmetric in the slip regime and asymmetric in other regimes. Secondary vortices set in for the free-molecular flows.
-
5. Magnitude of the aerodynamic coefficients (i) decrease with
${\rm{Ma}}$
, both inside the cavity and on its upstream and downstream surfaces (ii) show more complex trends with an increase in
${\rm{Kn}}$
both inside and outside the cavity. They increase in the slip regime and decrease in the transitional and free-molecular regimes, whereas only
${C_f}$
shows an opposing variation. -
6. The flow-field properties such as velocity, pressure and density showed no marked difference when compared against the non-reacting flows. In contrast, considerable difference was observed in the temperature field as the chemical reactions result in absorption of the energy by the fluid. The temperature differences were substantial, particularly in the shear layer.


This study presents a detailed analysis of the hypersonic flow over a cavity and offers valuable insights into the physics of individual flow and aerodynamic properties for the cases considered.
Acknowledegements
Authors would like to thankfully acknowledge the support and help of High-Performance Computing Laboratory, Birla Institute of Technology and Science Pilani, Hyderabad Campus, for provision of the requisite facilities for carrying out the simulations.