

Speech silences became a focus of psycholinguistic investigation when researchers discovered that the frequency and duration of silent intervals varied systematically with a variety of cognitive and linguistic factors. Early researchers established that pause time increased with the difficulty of a language task (e.g., Goldman-Eisler, Reference Goldman-Eisler1968), which led to the conclusion that pause time reflects general cognitive processing. For example, a classic study by Goldman-Eisler (Reference Goldman-Eisler1961) showed that silent pauses were longer when speakers were asked to interpret New Yorker cartoons compared to when they were asked to merely describe them. Lexical choice was also less predictable and the syntax more complex in the interpretations compared to the descriptions (Goldman-Eisler, Reference Goldman-Eisler1968).
The conclusion that pausing reflects general cognitive processing was extended in work that investigated the sequential structure of pauses in speech. Henderson, Goldman-Eisler, and Skarbek (Reference Henderson, Goldman-Eisler and Skarbek1966) found that speakers alternated between periods of greater and lesser silence to speech times during stretches of spontaneous speech (~60 s). The periods of speech associated with higher silent pause times contained more instances of filled pauses (“ums” and “erhs”) per N words and more ungrammatical junctures than the periods of speech associated with lower pause times. These results were interpreted to mean that speakers were engaged in more processing during periods of higher pause time than during periods of lower pause time.
Subsequent work investigated the context in which pauses occurred in order to better understand the type of processing speakers engage in during stretches of speech with higher and lower pause times (Butterworth & Goldman-Eisler, Reference Butterworth, Goldman-Eisler, Siegman and Feldstein1979). This work indicated that higher pause times were more associated with conceptual and semantic factors than lower pause times. Such an association was confirmed in studies that investigated the relationship between pausing and narrative structure and between pausing and discourse structure (Esposito, Reference Esposito, Faundez-Zanuy, Janer, Esposito, Satue-Villar, Roure and Espinosa-Duro2005; Esposito, Stejskal, Smékal, & Bourbakis, 2007; Gee & Grosjean, Reference Gee and Grosjean1984). For example, Gee and Grosjean (Reference Gee and Grosjean1984) showed that pause time could be used to identify plot units in spontaneous narratives, but not in read narratives, and that pause times tended to increase toward the middle of a narrative as new information (e.g., characters, plot elements) are added. Pause times may then decrease again as the story is resolved.
Cooper and Paccia-Cooper (Reference Cooper and Paccia-Cooper1980) were among the first researchers to shift focus away from the relationship between pausing and global cognitive processes to systematically study the relationship between pausing and phrase-level linguistic structure. To investigate local linguistic effects on pausing, Cooper and Paccia-Cooper studied pauses produced during practiced reading rather than during spontaneous speech, reasoning that “results for reading (would) reflect processing stages that in spontaneous speech presumably operate subsequent to (the formulation of ideas and their translation into linguistic code)” (p. 23).
Although Cooper and Paccia-Cooper (Reference Cooper and Paccia-Cooper1980) agreed with other's assumption that silent pauses reflected time needed to plan upcoming language, they also noted that the pausing (and lengthening) were affected by preceding linguistic structure. Such effects were explained in terms of execution:
The internal clock, in effect, runs more slowly at the ends of major constituents, presumably due to processing fatigue brought on by the activity associated with computing time intervals for all the previous segments within the constituent. (p. 199)
Whereas Cooper and Paccia-Cooper explained pause times that both preceded and followed an utterance in terms of syntactic structure, Ferreira (Reference Ferreira1993) showed that the immediately preceding prosodic structure was more relevant than syntactic structure for explaining postutterance pause times. More recently, Krivokapic (Reference Krivokapic2007) showed that preutterance pause times might also be explained by subsequent prosodic structure. Krivokapic (Reference Krivokapic2007) also found that the preceding and subsequent phrase lengths independently predicted variance in pause time, a result that is consistent with numerous other studies that show a relationship between phrase length and pause time (Ferreira, Reference Ferreira1991; Grosjean, Grosjean, & Lane, 1979; Zvonik & Cummins, Reference Zvonik and Cummins2002, Reference Zvonik and Cummins2003).
In summary, the early literature on silent pauses in adult speech indicated that general cognitive processing affected pause frequency and duration. Subsequent work indicated that conceptual and narrative structure also affects pause time. More recent work has focused on the effects of phrase-level factors such as syntax and prosody on pausing. With respect to these latter studies, a principal theory-neutral finding seems to be that preceding and subsequent phrase lengths affect pause time.
SILENT PAUSES IN CHILDREN'S SPEECH
Whereas silent pauses in adult speech have been systematically investigated from multiple perspectives by many researchers since the late 1950s, children's pauses have received much less attention. The most important developmental information on silent pauses comes from a set of studies conducted on 880 individuals who ranged in age from 6 to 49 years old. Sabin, Clemmer, O'Connell, and Kowal (1979) summarized these studies and provided information on the frequency and duration of silent pauses from young childhood to middle age. Their data, binned by grade level rather than by age, indicated a sharp decrease in pause frequency and duration from kindergarten to second grade and another, gentler decrease from sixth to eighth grade. Such results align nicely with age-dependent increases in speech rate (Sabin et al., Reference Sabin, Clemmer, O'Connell, Kowal, Siegman and Feldstein1979), age-dependent decreases in segmental durations (e.g., Kent & Forner, Reference Kent and Forner1980; Smith, Reference Smith1992), and of course, with the general increases in cognitive processing and language abilities that occur during childhood. No doubt it was these latter developmental trends that led Sabin et al. (1979, p. 55) to conclude that the higher pause frequencies and times in their child data indicated that young children are “wrestling with the basic tools of speech.”
Although Sabin et al.'s (1979) results on age-dependent changes in pausing make sense in the context of similar changes in cognition, language, and speech articulation, their results do not necessarily indicate that pause time per se decreases with age. This is because Sabin et al. (Reference Sabin, Clemmer, O'Connell, Kowal, Siegman and Feldstein1979) measured pause characteristics with respect to utterance characteristics. Specifically, the measurements of frequency and duration were normalized across age/grade levels by expressing total frequency or duration of pauses per 100 syllables. This normalization procedure leaves open the possibility that the reported changes in pausing only reflect developmental changes in the mean length of utterances, implying that pause frequency and duration could be stable over developmental time. One aim of the current study was to test this possibility.
Earlier it was noted that in addition to linking pause time to general cognitive processing, research on adult pausing has identified many specific linguistic variables, ranging from narrative structure to phrase length, that help explain pause duration. Specific linguistic variables have also been invoked to explain pause location. Adults are more likely to pause before presenting new information than when presenting given information (Gee & Grosjean, Reference Gee and Grosjean1984), and there is some indication that older children do so as well (Esposito, Reference Esposito, Faundez-Zanuy, Janer, Esposito, Satue-Villar, Roure and Espinosa-Duro2005; Esposito et al., Reference Esposito, Stejskal, Smékal, Bourbakis, Mele, Ramella, Santillo and Ventriglia2007). Adults also tend to pause at major syntactic boundaries and very frequently at intonational boundaries, which themselves nearly always correspond to syntactic constituent boundaries (Cooper & Paccia-Cooper, Reference Cooper and Paccia-Cooper1980; Selkirk, Reference Selkirk1984). Children are also reported to pause more frequently at clause boundaries than elsewhere in a sentence (McDaniel, McKee, & Garrett, Reference McDaniel, McKee and Garrett2010). Finally, adults tend to pause so that prior and subsequent phrase lengths are more or less equal (Grosjean et al., Reference Grosjean, Grosjean and Lane1979).
Do the linguistic variables that explain pausing in adult speech also explain pausing in young children's speech? Maybe not: for example, if Sabin et al.'s (1979) conclusion that children are “wrestling with the basic tools of speech” is correct then it could be that, compared to adult pauses, children's pauses reflect the influence of phrase-level variables, such as phrase length and syntactic structure, more than higher level variables, such as the position within a narrative. The other aim of the current study was to explore this possibility.
THE CURRENT STUDY
Sabin et al.'s (1979) results indicated that the largest developmental difference in pausing occurs between kindergarten (5- and 6-year-olds) and second grade (7- and 8-year-olds). For this reason, the current study investigated the spontaneous speech pauses produced by kindergarten-aged children and compared these with the pauses produced by their accompanying adult caregivers. Spontaneous speech was elicited in preference to practiced speech (read or imitative) so that the general effects of cognitive processing and the specific effects of linguistic structure at multiple levels could be investigated. The idea that all of these factors can be studied in spontaneous speech follows from Cooper and Paccia-Cooper's (1980) rationale for using read speech, namely, that spontaneous speech will show the effects of global and local cognitive/linguistic processing on pauses.
The spontaneous speech samples were obtained by having children and their caregivers participate in a storytelling task in which each narrated a different wordless picture book to the other. The speech samples were segmented into pauses and utterances, and their durations extracted. Utterances were also transcribed and coded so as to provide information about the language context in which pausing occurred.
A first set of analyses compared the characteristics of silent pauses in child and adult speech using absolute and language-standardized measures of pause frequency, duration, and the distribution of pause durations. The expectation was that group differences would be evident across both types of measures if age-dependent differences in general cognitive processing affect speech pausing. If group differences are only evident when language-standardized measures are used, then this could indicate that pausing is more closely tied to language factors than to general cognitive processing.
A second set of analyses investigated the language context in which pausing occurred in child and adult speech and the extent to which several relevant language variables at different levels of analysis would explain the location and duration of child and adult pauses. These variables were phrase length, syntactic completeness, discourse boundaries, and position within the narrative. The expectation was that all language variables would explain pausing in adult speech, but only the most local variables—phrase length and syntactic completeness—would explain pausing in child speech.
METHODS
Participants
Ten parent–child dyads were recruited by word of mouth and through local elementary schools to provide short spoken narratives. The children were all typically developing 5-year-olds (5 years, 2 months [5;2] to 5;8), who were in kindergarten at the time of the study. Three of the children were female and the rest were male. One of the parents was male and the rest were female. All participants were native speakers of American English.
Narrative speech samples
Spontaneous spoken narratives were obtained using a storytelling task. An experimenter presented a child–parent dyad with four picture books that depicted different adventures of a frog and/or a boy and a dog (i.e., the frog story books by Mercer Mayer). The experimenter told the dyad that their task was to provide the words to the stories depicted. Each participant was then asked to choose the one picture book that they would most like to narrate. Once each participant had chosen a book, they were told to look through it so that they could develop the story they wanted to tell to the others. While the parent familiarized herself with her book, the experimenter helped the child to look through his. Specifically, the experimenter made sure that the child looked through every page of the book and drew his attention to a major action and to a principal character's emotion at predetermined locations in the book. The goal of this step in the procedure was to encourage parents and children to conceptualize their stories prior to telling them to maximize the use of a story grammar during storytelling.
Once the child and parent were familiar with their own picture book, each was asked to tell the story to the others. The participant not telling the story was instructed to just listen and not to interrupt the storyteller. The storyteller wore a wireless lavaliere microphone that was placed on a hat to minimize clothing generated noise. Everyone looked at the pictures while the storyteller provided a narrative, which was digitally recorded for later analysis.
Each participant told the same story twice so that the effect of cognitive load (or familiarity) on pausing behavior could be examined within an individual. Although stories were told twice, the order of storytelling was interleaved with the other's storytelling. For example, if a child chose to tell his story first, then the parent would tell her story next for the first time, after which the child would retell his story before the parent did so. Retellings were interleaved in this way to make the storytelling more spontaneous and to minimize boredom with the task. Only one retelling was used because pilot work suggested that whatever small increases in fluency may have occurred between a second and third storytelling, these were outweighed by a participant's loss of interest in the task.
Pause criteria
The storytelling procedure resulted in 40 short narratives that ranged in length from 1.13 min to 4.58 min, with a mean length of 2.37 min, and altogether represented approximately 95 min of recorded spontaneous speech. The recordings were displayed in Praat as time-aligned oscillograms and spectrograms and then hand-segmented into pauses—defined as silent intervals—and utterances—defined as pause-delimited intervals of speech, using the following criteria.
Pause boundaries were located at the edges of silent intervals of any duration when the surrounding sounds were vocalic (unstressed or in final position), liquid, nasal, sonorant, or fricative. In the vicinity of a word–initial stressed vowel with an abrupt onset, silent intervals had to equal or exceed 150 ms before a pause boundary was noted. If the silence occurred at a stop offset/stressed vowel onset sequence and the final stop was unreleased, silent intervals had to equal or exceed 350 ms before a pause boundary was noted. The extra 200 ms were meant to ensure that stop closures were not taken as silent pauses. If the final stop in the sequences was released, the 150-ms rule for the stressed vowel onset was followed. In the vicinity of stop consonants, silences had to equal or exceed 250 ms before a pause boundary was noted. If the silent interval exceeded 250 ms, but was less than 400 ms long, then the pause boundary was placed midway into the silent interval. If the silent interval equaled or exceeded 400 ms, then pause boundaries were defined 150 ms before an utterance-initial stop, unless a more natural boundary could be identified (i.e., the sharp intake of a breath), and 150 ms after an utterance-final stop, unless a stop release was evident, in which case the boundary was placed after the release. Silent intervals also had to equal or exceed 400 ms before a pause boundary was noted if the silence occurred at a stop offset/onset sequence and the final stop was unreleased. The 250-ms rule was followed for the initial stop if the final stop in the sequence was released.
The procedure resulted in the identification of 2198 pauses. The mean number of absolute pauses in children's first storytelling was 53.60 (SD = 21.15) and 54.80 (SD = 26.65) in their second. The mean number of pauses in adults’ first storytelling was 60.30 (SD = 20.67) and 51.10 (SD = 16.49) in their second. Once fully segmented, pause and utterance durations were extracted automatically.
Language variables
The 40 short narratives were also transcribed in normal orthography. Pauses were noted with a forward slash and all interruptions, such as giggles, coughs, page turning problems, were noted in parentheses. Sound effects were indicated with conventional spellings when possible (e.g., arrgh) and as faithfully as possible otherwise. Filled pauses were noted in triangle brackets and false starts were indicated with three dots. Uninterpretable sounds were indicated with a question mark.
An example transcript that shows most of the transcription features is provided below. This particular transcription represents the first story told by a boy who was 5 years, 3 months of age at the time of the storytelling.
little boy was / looking at his pet froggy / when <uh> / his dog jumped in / and looked (page turning problems) / and then / he / slipped / and then the frog went down / and / then / he lifted / his boot up / and / and then his dog / they both looked out the window / and then / his dog fell / out / and then / the little boy / ran out / and then he's calling / then / he got some / and then his dog was eating / honey and / then it fell down / and all the bees were coming out of it / and then / and then he climbed the tree / and a / owl / peeked out / and he fell down / and then / he was standing on a branch ca . . . / I mean not / <uh> / rock / and then / he / <um> / he / was a / the / ?oal was a deer / so / the deer carried him / and then / he fell off the deer / and / he almost landed in a pond but instead / he's in the pond / and then he / climbed onto a rock / and ?eet / he / was on / and then / on that rock he jumped on to / a tree stump / and / then he climbed into / the / <um> / into the / grass and then / he / went home
The transcripts were used to identify pauses that occurred before an interruption. These were deleted from the set of pauses to be analyzed. The transcripts were also used to define speech and language variables relevant to the understanding of pause durations. Disfluencies, including filled pauses, word breaks, restarts, and self-corrections, were counted. The numbers of words per utterance were also counted. The onsets and offsets of utterances were respectively coded for the grammaticality of the subsequent pause and the presence or absence of a discourse marker.
The grammaticality of a subsequent pause was defined by the syntactic completeness of the preceding phrase, which was in turn defined by the element that occurred in utterance-final position. Pauses that directly followed transitive verbs, determiners, conjunctions, and copulas were considered ungrammatical. Pauses that directly followed final prepositions were also considered ungrammatical if the context was such that a subsequent noun phrase would be required to complete the phrase (e.g., and sat next to / Sproing).
Discourse markers were defined, following Fraser (Reference Fraser1999), as expressions that conjoin two sentences, representing two separate ideas. So, for example, the initial “and” in the fifth utterance given above (his dog jumped in / and looked) was not coded as a discourse marker, but the subsequent “and” was (his dog jumped in / and looked / and then / he).
Analyses
Two major types of statistical analyses were conducted. The first type focused on the effect of age group (child and adult) and storytelling (first or second) on pausing characteristics. The dependent variables in these analyses included different measures of pause frequency and duration, the distribution of pause durations, pause durations relative to utterance durations, as well as those related to the language context in which pauses occurred. In all of these analyses, the per speaker/per story averages for each of the dependent variables were calculated and entered into analysis of variance models that had age group as a between subjects factor and storytelling as a within subjects factor.
The other major type of analysis investigated whether and to what extent the coded language variables predicted pause durations in fluent child and adult speech. The predictor variables were number of words in the preceding and subsequent utterance, pause grammaticality (1 or 0), presence or absence of a subsequent discourse marker (1 or 0), and location within the story (1 = beginning, 2 = middle, 3 = ending). A first analysis had speaker nested within age group, and a second analysis was by speaker. Pauses that occurred before or after a well-defined disfluency (filled pause, word break, restart, or self-correction) occurred in 2.6% of the child data and 0.3% of the adult data. These disfluent pauses were excluded from the analyses and pause durations were log transformed to minimize the influence of extreme values on the results of the mixed hierarchical linear regression models.
RESULTS
The analyses indicated that child and adult pauses in spontaneously produced narratives are only well distinguished when considered relative to utterance lengths and durations or with respect to the language context in which they occurred. A small portion of the variation in pause durations was explained by the language variables examined. The child data were even less well explained by these variables than the adult data.
Raw pause frequency and absolute duration
Children produced an average of 23.34 pauses per minute during their first storytelling and 26.18 during their second. Adults produced an average of 21.92 pauses per minute during their first storytelling and 21.63 during their second. The variation in number of pauses per minute across speakers and stories was large, so neither the effect of age group nor of storytelling was statistically significant. The group by storytelling interaction was also not significant.
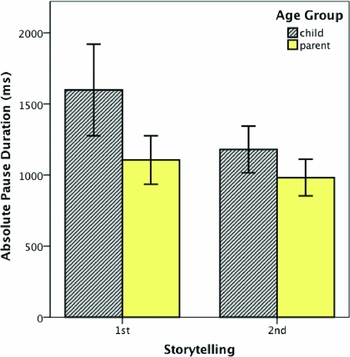
Average pause durations were longer in children's speech compared with adults’: 1416 versus 993 ms during the first storytelling, and 1094 versus 901 ms during the second. But just as with pause frequency, average pause duration varied so extensively by speaker that the effect of age group was not significant. In contrast, the difference between the first and second storytelling was significant, F (1, 18) = 7.35, p = .014, but there was no interaction between age group and storytelling. These results are shown in Figure 1. Note the large standard error bars, especially those associated with children's first storytelling.
The mean pause duration in milliseconds is shown as a function of age group (child and parent) and storytelling (first and second). [A color version of this figure can be viewed online at http://journals.cambridge.org/aps]

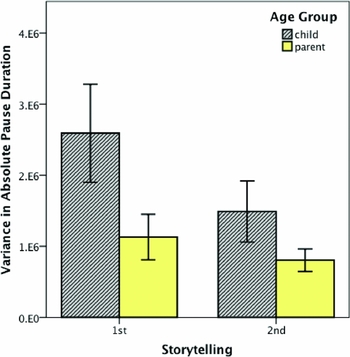
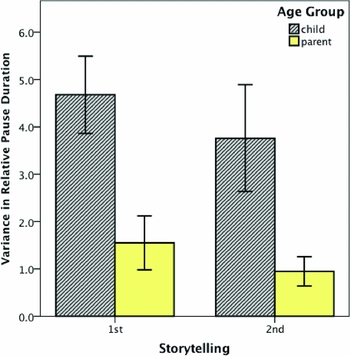
Pause duration variances were also calculated for each distribution associated with each speaker and storytelling. The results, shown in Figure 2, indicated a significant decrease in pause duration variability from the first to second storytelling, F (1, 18) = 6.44, p = .020, but the clear trend toward less variability in adult pause durations than in child pause durations did not reach significance. The interaction between age group and storytelling on variability was also not significant.
The variance in absolute pause duration is shown as a function of age group (child and parent) and storytelling (first and second). [A color version of this figure can be viewed online at http://journals.cambridge.org/aps]

Standardized pause frequency and relative duration
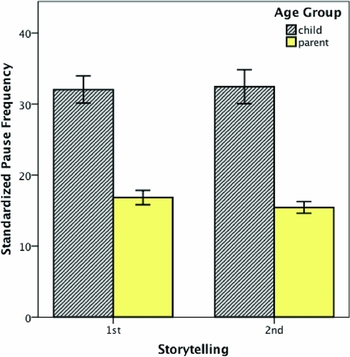
Even though the analyses of raw pause frequency and absolute duration indicated little difference between child and adult pauses due to extensive individual differences, large group differences emerged when pauses were considered relative to utterance characteristics. For example, when pause frequency was calculated with respect to number of words, it was 1.98 times higher in children's narratives than in adults’ narratives, F (1, 18) = 56.05, p < .001. Figure 3 shows this result. Standardized pause frequency was found to be similar for the first and second storytelling and for the interaction between age group and storytelling.
The language-standardized pause frequency, calculated as the number of pauses per 100 words, is shown as a function of age group (child and parent) and storytelling (first and second). [A color version of this figure can be viewed online at http://journals.cambridge.org/aps]

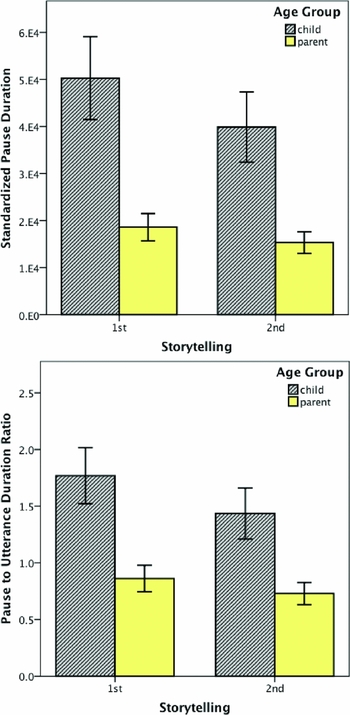
Similarly to pause frequency, when pause duration was standardized by number of words, it was 2.67 times longer in children's narratives than in adults’, F (1, 18) = 11.31, p = .003. This result is shown in the top panel in Figure 4. Standardized pause durations also decreased from the first to second storytelling, F (1, 18) = 13.64, p = .002, but the interaction between group and storytelling did not reach significance.
The relative pause duration is shown as a function of age group (child and parent) and storytelling (first and second). (Top) A language-standardized measure of relative duration, which was calculated as cumulative pause duration in milliseconds per 100 words. (Bottom) A different language-standardized measure of relative duration, namely, the ratio of preceding pause duration to following utterance duration. [A color version of this figure can be viewed online at http://journals.cambridge.org/aps]

Average pause to utterance ratios for each speaker and each storytelling provided another measure of relative pause duration. This measure was higher in child speech compared to adult speech, F (1, 18) = 5.15, p = .004, and in the first storytelling compared to the second, F (1, 18) = 8.90, p = .008, with no interaction between the factors. These results, shown in the bottom panel of Figure 4, are consistent with the results on language-standardized pause duration and with an increase in fluency from the first to second storytelling.
Pause to utterance duration ratios were also more variable in child speech compared to adult speech, F (1, 18) = 11.78, p = .003, as shown in Figure 5. Variance in pause to utterance duration ratios, however, was not affected by the simple effect of storytelling nor by the interaction between age group and storytelling. These results were in contrast to the results on variability of absolute pause durations (Figure 2) where age group was not significant, but the effect of storytelling was.
The variance in relative duration (pause to utterance ratios) is shown as a function of age group (child and parent) and storytelling (first and second). [A color version of this figure can be viewed online at http://journals.cambridge.org/aps]

Pauses in context
Consistent with the language-standardized results on pause frequency and duration, pauses that occurred in the vicinity of a filled pause, word break, restart, or self-correction were more common in child speech compared to adult speech, F (1, 18) = 18.48, p < .001. Although more common in child speech, disfluent pauses represented only a small percentage of the total number of child and adult pauses (2.6% and 0.3%, respectively), which may be why neither the effect of storytelling nor the interaction between age group and storytelling was significant. When disfluent pauses were excluded from the analyses, children were still more likely than adults to produce pauses in an ungrammatical location, F (1, 18) = 12.40, p = .002; that is, children paused more frequently than adults after a determiner, conjunction, or copula, or between an auxiliary and the main verb, a transitive verb and its direct object, or between a preposition and its noun phrase. These ungrammatical pauses represented a larger percentage of total pauses than disfluent pauses in both child and adult speech (18% and 7%, respectively). The effects of age group on pause grammaticality did not interact with storytelling nor was there a main effect of storytelling on pause location.
The analyses of duration as a function of context also revealed some differences in child and adult pausing. Recall that five language variables were used to predict pause duration in a hierarchical linear model: (a) the preceding and (b) subsequent phrase lengths, (c) pause grammaticality, (d) presence or absence of a subsequent discourse marker, and (e) position within a story. The complete model in which fluent pause durations were nested within storytelling, then within speaker, and then within group indicated a significant effect of age group on pause duration, F (1, 26.1) = 14.09, p < .001,Footnote 1 but not of storytelling. On the basis of this result, the data were split by age group and reanalyzed so that the effects of each language variable on pause duration could be assessed independently for the child and adult data.
Whereas the independent analyses of the child and adult data indicated interesting differences in the explanatory value of the different language variables, it is important to note that the models explained a small amount of the overall duration variance: the child model explained 5.8% of the variance and the adult model 10%. This basic result suggests that the pause duration data were extremely noisy. Additional language and/or nonlanguage covariates may also be needed to explain more of the variance in pause duration, but our five predictors included the most important explanatory variables discussed in the literature. We now turn the results on the effects of the different language variables on child and adult pause durations.
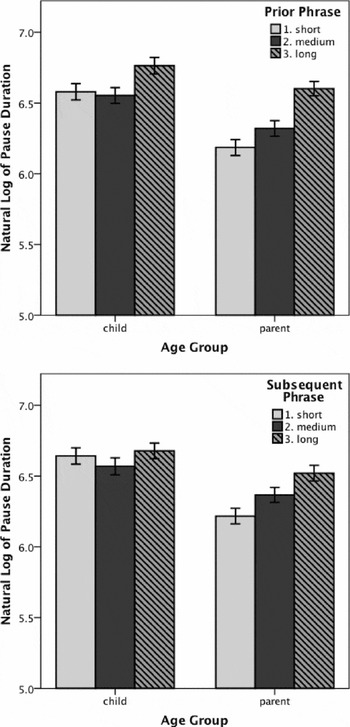
Preceding and subsequent phrase lengths were significant predictors of adult pause durations, F (1, 845) = 13.72, p < .001 and F (1, 893) = 13.96, p < .001,Footnote 2 but not of child pause durations for the preceding phrase or subsequent phrase. For simplicity's sake, Figure 6 shows the effect of phrase length on pause durations in categorical terms, even though phrase length was expressed in the model as number of words, which ranged from 1 to 15 in the child data and 1 to 29 in the adult data. Specifically, Figure 6 shows that adult pause durations corresponded with phrase length, whether the phrase occurred before or after the pause. A trend for child pause durations to correspond with preceding phrase length was not significant.
The log-transformed pause duration (top) as a function of age group and preceding phrase length and (bottom) as a function of age group and subsequent phrase length. Phrase length was expressed as number of words in the model, but it is shown here in categorical terms.

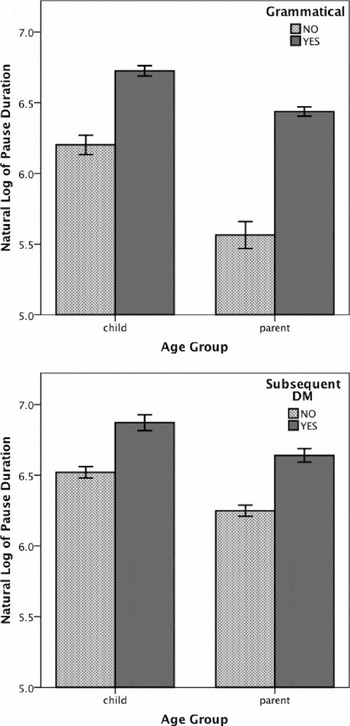
In contrast to phrase length, the more specifically linguistic variables of pause grammaticality and presence/absence of a discourse marker had significant effects on both child and adult pause durations. As shown in Figure 7, ungrammatical pauses were shorter than grammatical pauses for children, F (1, 976) = 13.38, p < .001, and adults, F (1, 793) = 22.69, p < .001; and pauses that preceded a discourse marker were longer than those that did not for children, F (1, 976) = 34.44, p < .001, and adults, F (1, 461) = 29.76, p < .001.
The log-transformed pause duration (top) as a function of age group and pause grammaticality and (bottom) as a function of age group and the presence or absence of a discourse marker (DM).

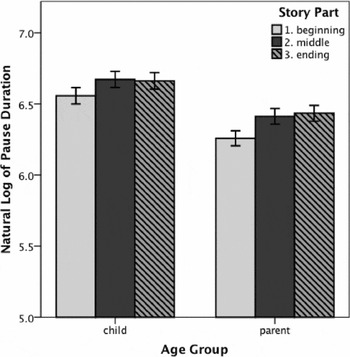
Finally, the high-level variable of story position had a significant effect only on adult pause durations, as shown in Figure 8. In adults’ storytellings, pauses were shorter at the beginning of the story than toward the middle and end of the story, F (1, 1077) = 6.11, p = .014. As with phrase length, the figure appears to show that story position affected child pause durations in the same way that it affected adult pause durations, but this effect was not significant in the presence of the other language variables in the child data.
The log-transformed pause duration is shown as a function of age group and story position.

In sum, children produced more disfluent and ungrammatical pauses than adults. Nonetheless, child and adult pause durations both varied in the same way with pause grammaticality and the presence/absence of a discourse marker. Unlike adult pauses, child pauses did not systematically vary with phrase length or with story position.
DISCUSSION
The results from the current study cast doubt on Sabin et al.'s (1979) appealing conclusion that pausing in child and adult speech is different. Absolute measures of pause frequency and duration indicated little difference between child and adult pausing behavior. The finding that language-standardized measures of pause frequency and duration revealed large group differences is consistent with developmental changes in the amount of language children produce at different ages and does not indicate a change in the amount of pause time they produce.
Although Sabin et al.'s (1979) incorrectly glossed their basic result to mean that pause time decreases with increasing age, their gloss has an intuitive appeal. This is presumably because developmental decreases in pause time are consistent with developmental increases in speech rate, developmental decreases in segment durations, and developmental increases in linguistic abilities. In addition, the idea that young children pause more and for longer than older children and adults reinforces the link between cognitive processing and pause time: just as cognitive processing capabilities are presumed to increase with age, pause time can be presumed to decrease. Again, the results from the current study suggest otherwise.
The counterintuitive finding that pause time in spontaneously produced narratives is similar in children and adults might call into question the link between cognitive processing and pause time were it not for the finding that pause time decreased with storytelling. Both children and adults showed a decrease in pause duration and in the variation of durations when retelling the same story a second time, suggesting that familiarity with the task and access to previously used language impacts pausing. In this way, the present results parallel those that were reported in the early literature on pausing (see, e.g., Goldman-Eisler, Reference Goldman-Eisler1968, p. 57), which showed a connection between general cognitive processing and pause time.
Because we have no further reason to question the link between pausing and cognitive processing in spontaneously produced narratives, the finding that pause time is similar in children and adults may instead mean that children allocate roughly the same cognitive resources to language production as adults when storytelling. In both children and adults, we can assume that the allocation of resources is minimal because language production is an automatic process, rather than a controlled one. Such a conclusion is certainly consistent with personal impressions of young children's torrential speech output. It is admittedly less consistent with the more disfluent and less complex speech that children produce relative to adults. For example, in this study, 5-year-olds were found to produce more unfilled pauses, word breaks, restarts, and self-corrections than adults; they also produced pauses in syntactically and semantically unexpected locations more frequently than adults; and the mean length of their pause-delimited utterances was shorter than those of adults.
The perceived incongruence between automatic language production and the immature language produced by 5-year-olds may stem from the assumption that child and adult targets are the same. How else can children continue to acquire more complex language, if they are not sensitive to—and so struggling with—the mismatch between their own output and adult language targets? Although this question is most often cast in terms of the input rather than in terms of the output (e.g., “the logical problem of language acquisition”), a single theory of language acquisition may be relevant for explaining both: children learn language implicitly through exposure to vast quantities of language. The linguistic representations that children build over time shift as they attend to different aspects of the input. No matter their current structure, only existing representations can be accessed for language production. Although access to the representations is as automatic in children as in adults, children's immature representations result in immature language.
Although the conclusion that cognitive resource allocation in language production accounts for the finding that global measures of pause frequency, duration, and the distribution of durations are similar in children and adults, it would appear to be inconsistent with the finding that phrase length had different effects on child and adult pause durations given that the effect of phrase length on adult pause durations is typically explained in terms of processing. If children and adults allocate similar resources to language production, then the finding that only adult pause durations varied systematically with preceding and subsequent phrase lengths is a bit surprising. But the reason that phrase length had no effect on child pause durations becomes clear when one considers the differences in the language that children and adults produced: the longest child pause-delimited utterance (15 words) was significantly shorter than the longest adult utterance (22 words), and the mean utterance length in children's stories was only half that of adults’ stories (3.2 vs. 6.3 words). Moreover, the median utterance length was more similar to the mean utterance length in children's stories compared to adults’ stories (3 vs. 5 words), and the variance in utterance length was much smaller in children's stories compared to adults’ stories (5.1 vs. 18.2 words). All of this indicates that children produced a narrower range of phrase lengths than adults, which is probably why phrase length was a less good predictor of the extensive variance in pause durations in children's speech compared to in adults’ speech.
Whereas the effects of phrase length on pausing are best understood in terms of processing, the effects of the other language variables on pausing may provide some insight into linguistic representation and knowledge. For example, it should be clear from the example story provided in the methods section that young children tell a story by chaining events rather than by embedding them into a larger structure. Because good stories proceed with the addition and integration of new characters and plot elements into an existing structure, pausing generally increases as a story continues. When narratives are not produced with an integrated structure, there can be no effect of story position on pausing, which is what was found for children in this study. Results on pausing in stories produced by older children suggests that by 9 years of age children may build more integrated narrative structure (Esposito, Reference Esposito, Faundez-Zanuy, Janer, Esposito, Satue-Villar, Roure and Espinosa-Duro2005; Esposito et al., Reference Esposito, Stejskal, Smékal, Bourbakis, Mele, Ramella, Santillo and Ventriglia2007).
Analyses on the effect of particular language variables on pause location and duration also provided some insight into the type of procedural knowledge that children must acquire with respect to pausing. For example, one of the most important language skills that children must learn with respect to pausing is when to do it. The current results indicate that this learning is not complete by age 5. The 5-year-olds in our study were more than two times as likely as adults to pause between an auxiliary and a main verb or between a preposition and its noun phrase and in other semantically and syntactically unexpected locations. The impression one arrives at from segmenting the audio files is that a substantial portion of children's ungrammatical pausing coincided with a sharp intake of breath. Insofar as Grosjean et al. (1979, p. 63) are correct to note that “breathing in (adult) speech is subservient to pausing . . . and not the other way around,” the present results on ungrammatical pausing may suggest that 5-year-old children are not completely adept at coordinating linguistic content with speech breathing. We plan to investigate this possibility further in future research.
Children must also learn that pauses help to convey prosodic information and discourse structure. Five-year-olds may already be fairly competent in this regard, although this was not directly shown in the current study. In particular, the measure we used to code pause grammaticality likely grouped instances of truly ungrammatical pauses with those that were being deployed for prosodic ends. For example, a pause that preceded a focused element would have been coded as ungrammatical if it occurred in an otherwise syntactically or semantically unexpected location (e.g., And then he fell into . . . the lake!). Assuming that at least some of the pauses that were coded as ungrammatical were produced in conjunction with other prominence markers, as the 7% of ungrammatical pausing in adults would suggest, then we can expect that children use pauses for prosodic ends.
As for discourse structure, the result that children pause for longer before a discourse marker than when no such marker is present suggests that children, like adults, know that pauses help to covey conceptual boundaries. Alternatively, the relationship between pause length and discourse markers might emerge from cognitive processing constraints. The presence of a discourse marker signals the addition of a new idea to the discourse. If the linguistic expression of entirely new information takes longer to plan for execution than the linguistic expression of established information, then pause durations will vary predictably with the signaling of new information (i.e., discourse markers). Whether the explanation for the relationship between pausing and discourse markers is based on structure or on processing time, the finding stands that 5-year-olds make adultlike use of pausing in the context of new ideas, and can clearly and appropriately signal the presence of these new ideas through a combination of pausing and discourse marking.
CONCLUSION
The current study was undertaken with the expectation that an analysis of pausing in child and adult speech would reveal large differences in behavior. This expectation was only upheld when language-standardized measures of pause frequency and duration were examined: measures of raw frequency and absolute duration indicated no significant differences between child and adult pausing. These findings might be interpreted to suggest that pausing is more closely tied to language planning and execution than to general cognitive processing except for the fact that retelling a story had a significant effect on absolute pause duration and on the variance in absolute pause durations. Altogether, then, the results on pause characteristics suggest that children and adults allocate similar cognitive resources to language production. Differences in the quality of these resources and in general language ability must account for young children's demonstrably simpler language compared to adults.
Although young children's language is simpler than adults’ language, the pattern of pausing in children's speech is quite similar to the pattern of pausing in adults’ speech. The few firm differences observed between children and adults in the analyses of pausing in context suggest that 5-year-old children are less adept than adults at pausing in linguistically appropriate locations. Future research will investigate in more detail the developmental changes that occur in the relationship between pausing and other correlates of prosodic and discourse structure during childhood.
ACKNOWLEDGMENTS
This research was supported by Grant R01HD061458 from NICHD. The content is solely the responsibility of the author and does not necessarily represent the official views of NICHD or of NIH. I am grateful to the 2009–2010 Speech and Language Lab testing team for their help with data collection, to Sergei Bogdanov and Lan Xue for statistical advice, and to Volya Kapatsinski for stimulating discussions on alternate interpretations of the data.