Introduction
Obesity is now a key public health challenge facing nations since in both children and adults it has increased dramatically over time (Grossmann & Mocan, Reference Grossman and Mocan2011). A discussion is still going on about the relationship between body mass, wealth and inequality, both in historical populations (e.g. Cuff, Reference Cuff1993; Henderson, Reference Henderson2005; Carson, Reference Carson2009, Reference Carson2013; Komlos & Brabec, Reference Komlos and Brabec2010, Reference Komlos and Brabec2011; Koch, Reference Koch2011; Sunder, Reference Sunder2013) and contemporary ones (Fine et al., Reference Fine, Colditz, Coakley, Moseley, Manson, Willett and Kawachi1999; Mantzoros, Reference Mantzoros1999; Cole et al., Reference Cole, Bellizzi, Flegal and Dietz2000; Ashley et al., Reference Ashley, Jeor, Schrage, Perumean-Chaney, Gilbertson, McCall and Bovee2001; Field et al., Reference Field, Coakley, Must, Spadano, Laird and Dietz2001; Flegal et al., Reference Flegal, Troiano and Ballard-Barbash2001, Reference Flegal, Carroll, Ogden and Curtin2010; Janečková, Reference Janečková2001; Cho et al., Reference Cho, Manson, Stampfer, Solomon, Golditz and Speizer2002; Koh-Banerjee et al., Reference Koh-Banerjee, Wang, Hu, Spiegelman, Willett and Rimm2004; Schulze et al., Reference Schulze, Manson, Ludwig, Colditz, Stampfer, Willett and Hu2004, Reference Schulze, Fung, Manson, Willett and Hu2006; Flegal, Reference Flegal2005; Farooqi & O’Rahilly, Reference Farooqi and O’Rahilly2007; Li et al., Reference Li, Rana, Manson, Willett, Stampfer and Colditz2008). In the USA at the end of the 19th century about 3.5% of white middle-aged men were obese, while a century later this proportion had increased by as much as 10 times (Helmchen & Henderson, Reference Helmchen and Henderson2004). It is estimated that worldwide in 2008 there were 205 million men and 297 million women who were obese (Finucane et al., Reference Finucane, Stevens, Cowan, Danaei and Lin2011). By 2030, assuming no constraints in the current trend of increasing obesity, a worldwide total of 2.16 billion people with overweight and 1.12 billion with obesity is predicted (Kelly et al., Reference Kelly, Youg, Chen and Reynolds2008).
Body Mass Index (BMI), used as an indicator of underweight, overweight and obesity in studies on contemporary populations of children and adults (Kozieł et al., Reference Kozieł, Welon, Bielicki, Szklarska and Ulijaszek2004, Reference Kozieł, Szklarska, Bielicki and Malina2006; Chrzanowska et al., Reference Chrzanowska, Kozieł and Ulijaszek2007; Hanć et al., Reference Hanć, Czapla, Szwed, Durda, Krotowska and Cieślik2015), can also be used successfully for historical ones (Costa, Reference Costa1993). Using 19th century US prison records of the height and weight of inmates, Carson (Reference Carson2013) studied the relationship between BMI, demographic, socioeconomic and wealth status and inequality. His research showed that farmers had greater BMIs than unskilled workers, as did blacks compared with whites. Here BMIs and health were related to the economic and social status of the studied groups. Jordan (Reference Jordan1993) used the BMI data of children from Victorian England to assess trends in their physical well-being. Henderson (Reference Henderson2005) raised the question of changes over time in BMI values considered as healthy: the range of the healthiest BMI values calculated for a sample of Americans born in the first half of the 19th century was narrower than that for those born during the first half of the 20th century. A rural–urban contrast in BMI has also been demonstrated: owing to a greater availability of nutrients, villagers had higher BMI values than city dwellers (Komlos, Reference Komlos1987, Reference Komlos1989, Reference Komlos1992). For example, the BMIs of West Point cadets from rural areas were higher than of those living in towns (Komlos, Reference Komlos1987). Changes in BMIs over time by gender and ethnicity were highlighted by Komlos and Brabec (Reference Komlos and Brabec2011).
Several recent studies have shown that BMI is a simple weight-to-height index, used as a predictor of the risk of various diseases such as diabetes, metabolic syndrome, cardiovascular disease, certain cancers and hypertension (Manson et al., Reference Manson, Colditz and Stampfer1990; Witteman et al., Reference Witteman, Willett, Stampfer, Colditz, Kok and Speizer1990; Cole et al., Reference Cole, Bellizzi, Flegal and Dietz2000; Janečková, Reference Janečková2001). Petkeviciene and colleagues (Reference Petkeviciene, Klumbiene, Kriaucionienie, Raskiliene, Sakyte and Ceponiene2015) reported a strong association between the high values of BMI in children and its increase with age, and a later risk in adulthood of hypertension and impaired lipid metabolism. The relationship between overweight and obesity and cardiovascular disease is also well-documented (e.g. Steinberger et al., Reference Steinberger, Jacobs, Raatz, Moran, Hong and Sinaiko2005; Cohen et al., Reference Cohen, Park, Signorello, Petel and Bogps2014). Cardiovascular disease is the most common cause of death and therefore BMI is also used as a good predictor of the risk of death (Cohen et al., Reference Cohen, Park, Signorello, Petel and Bogps2014; Adabag et al., Reference Adabag, Hucley, Lopez, Chen, Sotoodehnia and Siscovick2015). It has been noted that the higher the BMI the greater is the risk of death due to cardiovascular, renal and respiratory diseases, diabetes and liver cancer (Whitlock et al., Reference Whitlock, Lewington, Sherliker, Clarke, Emberson and Halsey2009). It has been shown, however, that the risk of death is smaller when BMI fluctuates between 20.0 and 24.9, but increases in undernourished/underweight people (Berrington de Gonzalez et al., Reference Berrington de Gonzalez, Hartge, Cerhan, Flint, Hannan and MacInnis2010). Koch (Reference Koch2011) found a positive association between BMI <20.0 and >27.0 and higher mortality risk. Other researchers have obtained similar results thereby emphasizing the relationship between BMI and mortality measures: a higher risk of mortality was observed when BMI was either extremely low or high (e.g. Costa, Reference Costa1993; Riley, Reference Riley1994; Henderson, Reference Henderson2005).
Little is known about how Polish BMIs varied with health and social inequality in historical populations. There is still little information about the relationship between the well-being, nutritional habits and BMIs of the 19th century population of the Polish lands. Research on historical Polish populations from the late 19th and early 20th centuries has been limited to analyses of determinants of body height as indicators of the prevailing socioeconomic conditions (Czekanowski, Reference Czekanowski1930; Kopczyński, Reference Kopczyński2005, Reference Kopczyński2006, Reference Kopczyński2007, Reference Kopczyński2011; Czapla & Liczbińska, Reference Czapla and Liczbińska2014), or to secular trends in body height (Nowak, Reference Nowak2011; Czapla & Liczbińska, Reference Czapla and Liczbińska2014). There have been no studies on a possible link between socioeconomic status and BMI by social group among the adult Polish population. The only pioneering work concerning BMI has been on young conscripts from the Prussian sector (Liczbińska et al., Reference Liczbińska, Czapla, Nowak and Piontek2016). There is a lack of research on the BMI of adults over 19 years. The aim of this paper was therefore to assess the impact of the socioeconomic status on the BMI of peasants and gentry in the Kingdom of Poland (then under Russian rule) in the late 19th and early 20th centuries. In addition, an attempt has been made to determine the time of onset of obesity in Poland and in Europe, on the basis of BMI.
The gentry and peasantry of the Kingdom of Poland
In the Polish lands under Russian rule, known as the Kingdom of Poland, landowners were divided into two categories: gentlefolk and so-called non-gentlefolk. The latter included townspeople – owners of landed estates and homes located in towns – and rent-paying peasants. The gentleman status included two types: a hereditary one and a personal one, the latter not involving the right to have a village, and serfs. The rights of the gentry derived from family history and traditions, seniority or obtaining the title. In this way, through a purchase or donation, the gentry united owners of landed estates as well as civil and military officials (Stankiewicz, Reference Stankiewicz1981). Throughout the 19th century the gentry represented the most privileged part of Polish society. With time the position of the so-called ‘petty gentry’ declined. Already in the 18th century the petty gentry was divided into three categories: (Reference Adabag, Hucley, Lopez, Chen, Sotoodehnia and Siscovick1) settled gentry, without subjects, and so-called minor/farmstead gentry; (Reference Ashley, Jeor, Schrage, Perumean-Chaney, Gilbertson, McCall and Bovee2) gentry settled on someone else’s land, or rent-paying gentry, and (Reference Berrington de Gonzalez, Hartge, Cerhan, Flint, Hannan and MacInnis3) gentry without land, making a living by working at someone’s court or manor (Chwalba, Reference Chwalba2000).
The verification of gentry status, meticulously conducted by the Russian authorities, deprived the rent-paying, servant and court-based gentry of almost all rights. Furthermore, throughout the 18th and 19th centuries the difference between the petty gentry on the one hand and landed, wealthy gentlefolk and the intelligentsia, on the other, kept deepening. The differences encompassed many spheres of life, including lifestyles and level of education (Chwalba, Reference Chwalba2000).
In turn, the basic criteria of belonging to the peasantry were not only the possession of land, but also compulsory work for a manor. What the rural population had in common were manorial duties, lifestyle and working conditions, customs and culture. By the nature of services performed for a manor, peasants were divided into serfs, or people obliged to provide corvée services (forced, free work done by peasants for a landowner, its amount determined by the master or by customary norms or regulations; developed in Europe in the feudal period), and rent-paying peasants, or those who paid an owner or a feudal lord in cash or in kind (Mączak, Reference Mączak1981). In some cases, the feudal lord demanded a certain number of days of corvée labour, apart from money payment.
The situation of the peasantry in the Kingdom of Poland derived from the economic system and social relations supporting the dominance of the gentry and aristocracy, and limiting peasants’ rights. In the Grand Duchy of Warsaw, serfdom was abolished by the so-called December Decree, which was an elaboration of Article 4 of its 1807 Constitution. On the other hand, Article 3 of the same Constitution supported serfdom by stipulating services performed so far as a condition for the use of land. A peasant was theoretically liberated from serfdom, but in practice serfdom was still maintained (Stankiewicz, Reference Stankiewicz1981). In the 19th century peasants differed little in terms of economic status from the poorest groups of gentry: manor/farmstead and rent-paying gentry (Chwalba, Reference Chwalba2000). The latter, despite their very low economic status, still had the title of nobility and the privileges resulting from it.
Methods
Characteristics of the sample population
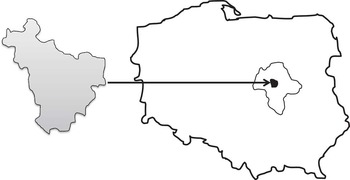
In this research use was made of data on the height and weight of the adult inhabitants of Płońsk county (Fig. 1) in the Kingdom of Poland in the late 19th and early 20th centuries. These archival measurement data were published in 1901 and 1906 in the form of appendices to articles written by Rutkowski in Anthropological, Archaeological and Ethnographic Materials (in Polish: Materiały Antropologiczno‑Archeologiczne i Etnograficzne; Rutkowski, Reference Rutkowski1901, Reference Rutkowski1906). The crude data were digitized by the authors of this paper. The material under study included height and weight measurements of 304 men: 200 peasants (individual data published by Rutkowski in 1901) and 104 gentlemen (individual data published by Rutkowski in 1906), and 275 women (200 from the peasantry and 75 from the gentry; individual data for both groups published by Rutkowski in 1906).
Płońsk county, Kingdom of Poland (left, grey shading), against the map of contemporary Mazowieckie voivodship (right, outlined by the thin line).

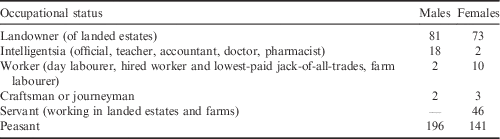
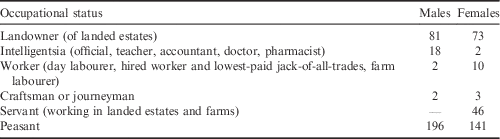
Data for both sexes and groups were combined and one data set was created. The archival data included information on the occupational status of individual men and women and are presented in Table 1. Social origin and tradition related to it was the basis of the split of the population studied into gentlefolk and peasants. The representatives of gentry and peasantry differed in terms of wealth and profession, not only between themselves, but also within their own groups. Hence, among the peasants, small farmers with 1–29 acres of land, labourers (without a regular occupation), craftsmen, servants, courtly service and hosts (former residents of royal or ecclesiastical estates) predominated. The category ‘gentry’ embraced village owners, impoverished gentlefolk, craftsmen, servants and the rural intelligentsia (doctors, officials, estate managers) (Rutkowski, Reference Rutkowski1901, Reference Rutkowski1906). The social structure given by Rutkowski (Reference Rutkowski1901, Reference Rutkowski1906) reflects the diversity of 19th century society in Poland. That is why Rutkowski’s classification was taken into account. The occupational status of the peasantry and the gentry was also adopted from Rutkowski (Reference Rutkowski1901, Reference Rutkowski1906). At the turn of the 19th and 20th centuries Rutkowski conducted anthropological research in the spirit of typological anthropology, fashionable at that time, performing somatometric and cephalometric measurements, studies of hair colour, iris colour and beard and skin colours. In the case of men from the peasantry there were no data on body weight for four individuals, and in the case of the gentry for one man. In the case of women there were no missing data on body height and body weight for the two groups. Individuals who were diseased and who by medical evaluation differed from proper development in terms of height and weight were excluded from the material (Rutkowski, Reference Rutkowski1901).
Characteristics of the study sample by occupational status and sex
Data and analysis
Measurements of height and weight were made by a physician using a centimetre measure and weight to an accuracy of one-tenth of a unit (Rutkowski, Reference Rutkowski1901). In the present study, re-analysis of these measurements using modern statistical methods and new analysis to capture a statistically significant effect of socioeconomic status on BMI was performed. For the men and women under study, the mean and standard deviation of height and weight were calculated. For each person BMI was calculated on the basis of their weight and height. The average BMI values and their standard deviations for peasants and gentlefolk were then calculated. Since individual body weights in the appendices to Rutkowski’s articles were given in Polish pounds, they were converted into kilograms before the BMI calculation, assuming, after Rutkowski (Reference Rutkowski1901), that the Polish pound was equal to 0.408 kg. The BMI classification coding system adopted was that published by the World Health Organization (WHO, 1995). Each individual was classified in the appropriate BMI category, on the assumption that BMIs <18.5 meant underweight, those between 18.50 and 24.99 meant normal weight, those between 25.00 and 29.99 denoted overweight, and those > 30.00 meant obesity.
Six categories of occupational status were distinguished based on individual information given after Rutkowski (Reference Rutkowski1901, Reference Rutkowski1906). Landowners represented the first category (0), intelligentsia the second (1), then workers (2), craftsmen (3), servants (4) and peasants (5). The group of servants was represented by women only. The differences in average height, weight and BMI and in the average age of individuals from the two studied social groups were tested using Student’s t-test. The statistical association between BMI and the social status of individuals (gentry and peasantry) was performed using the chi-squared test (χ 2). Four birth categories were created: the 1st category included individuals born before 1855 (1); the 2nd category included individuals born between 1856 and 1865 (2); the 3rd category included those born between 1866 and 1875 (3); and the last, 4th category included those born after 1876 (4). The ANOVA test and Tukey’s test (post hoc test) was used to assess the effect of birth cohort on the BMI of groups of peasantry and gentry, and to capture the impact of occupational status on the BMI of males and females. To assess the changes in BMI over time the linear regression model was used. Two levels of significance were adopted: p=0.05 and p=0.01. Calculations were performed using the package STATISTICA (STATISTICA, 2011).
Results
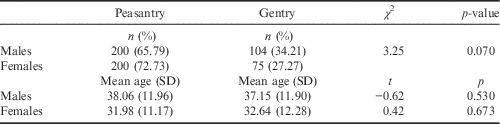
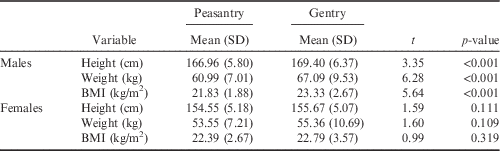
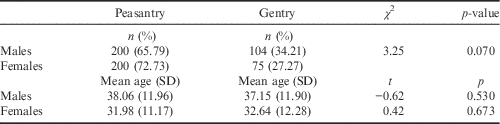
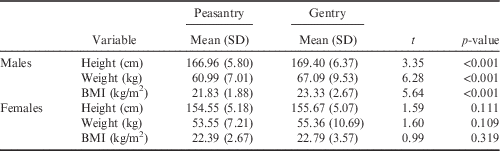
The groups of men and women of the peasantry and the gentry showed no significant difference in terms of sample size (χ 2=3.25, p=0.07). No statistically significant differences in the mean age of women and men in the two groups were noted either: these were 31.98 and 32.64 years for peasant women and gentlewomen, respectively (t=0.42, p=0.67), and 38.06 and 37.15 years for peasant men and gentlemen, respectively (t=−0.62, p=0.53) (Table 2). The gentlemen were characterized by a greater body height than the peasants (169.40 cm and 166.96 cm, respectively), a greater body weight (67.09 kg and 60.99 kg, respectively) and a higher BMI (23.33 kg/m2 and 21.83 kg/m2, respectively). Among the women, there were no statistically significant differences in mean height, weight and BMI by their social position (Table 3).
Mean ages and social status of study sample by sex
Mean body heights, body weights and BMIs of peasantry and gentry by sex
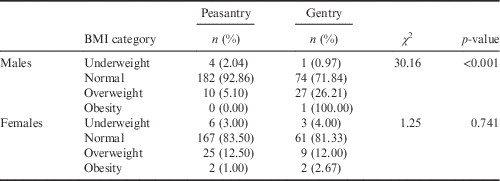
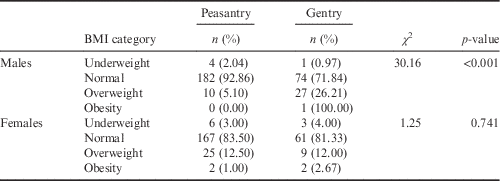
The χ 2 test showed that the frequency of underweight, overweight and obesity in males depended on their social status (χ 2=30.16, p<0.001); underweight occurred in gentlemen only rarely and more frequently in peasants (0.97% and 2.04%, respectively). By contrast, overweight was five times more common in gentlemen than in peasants (26.21% and 5.10%, respectively). There were no significant differences in the frequency of underweight, overweight and obesity in women for the two social groups (χ 2=1.25, p=0.741) (Table 4).
Frequency of underweight, overweight and obesity in peasantry and gentry by sex
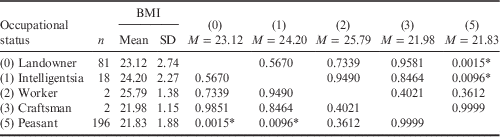
The ANOVA test shows a statistically significant impact of occupational status on the average values of BMI in men (F=9.83, p<0.001). Tukey’s test also confirmed differences between men by their occupational status. The difference in the BMI values between landowners and peasants was 1.29 kg/m2 (p=0.0015) and that between the intelligentsia and peasants was 2.37 kg/m2 (p=0.0096) (Table 5). The same analysis showed no difference in the average BMI of women by occupational status (F=0.37, p=0.8650).
Mean BMIs of males by occupational status (ANOVA and Tukey’s tests, HSD)
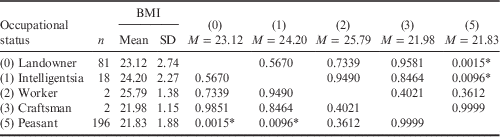
The ANOVA test was statistically significant: F=9.83, p<0.001. *Tukey’s test values indicate statistically significant differences between landowners and peasants (p=0.0015) and between intelligentsia and peasants (p=0.0096). M, mean value of BMI in groups selected by occupational status.
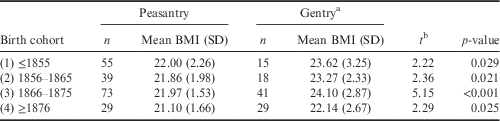
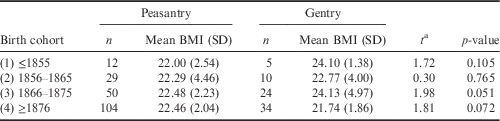
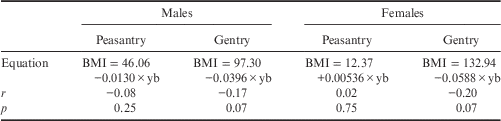
The mean BMI values for men and women from the peasantry and for men and women from the gentry by birth cohorts were compared using Student’s t-test. In each birth cohort there was a statistically significant difference in the BMI of men from the peasantry and that from the gentry (Table 6). The ANOVA test showed a significant influence of the birth cohort on the average BMI in the gentry (F=3.325, p=0.022); Tukey’s test confirmed statistically significant differences in BMI between the 3rd and the 4th birth cohorts for the gentlemen (cohorts: 1866–1875 and ≥1876) (Table 6). There was no statistically significant effect of birth cohort on the BMI of men from the peasantry (F=1.75, p=0.1574). Moreover, there was a lack of influence of birth cohort on the average value of BMI in women, irrespective of their social status (F=0.1440, p=0.9333 and F=2.4571, p=0.0702; in women from the peasantry and gentry, respectively) (Table 7). Women from the peasantry differed from those of the gentry only for the cohort born in 1866–1875: the former had a lower mean BMI than the latter (24.13 kg/m2 and 22.48 kg/m2, respectively) (Table 7). There were no statistically significant trends and correlations between BMI and birth cohorts of the groups studied, irrespective of their social status (Table 8).
Mean BMIs of males from the peasantry and gentry by birth cohort
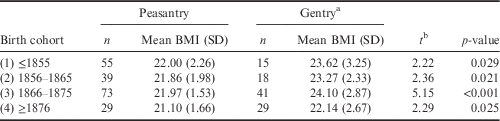
a The ANOVA test was statistically significant: F=3.325, p=0.022 in men from gentry. Tukey’s test values indicate differences between the 3th and 4th birth cohorts (p=0.0024).
b Student’s t-test.
Mean BMIs of females from the peasantry and gentry by birth cohort
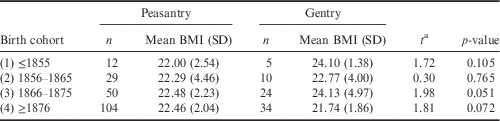
The ANOVA test was not statistically significant: F=0.1440, p=0.9333 and F=2.4571, p=0.0702, in women from peasantry and gentry, respectively.
a Student’s t-test.
Regression equations and correlation between BMI and year of birth for males and females by social status
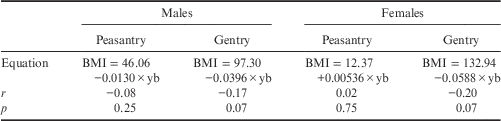
r=Pearson’s correlation coefficient; yb=year of birth.
Discussion
The main aim of this study was to evaluate the influence of socioeconomic status on the BMI of Płońsk county residents in the Kingdom of Poland in the 19th and early 20th centuries. The statistically significant differences in BMI between the representatives of the gentry and the peasantry were mostly found in men. The differences in mean BMI resulted not only from the social status of individuals from the peasantry and the gentry, but also from their occupational status, significantly influencing BMI in men: landowners and intelligentsia had significantly greater BMIs than peasants (23.12 kg/m2 and 24.20 kg/m2 vs 21.83 kg/m2, respectively). The average value of the BMI of workers (25.79 kg/m2) was not taken into account due to there being only two people from the profession in the material. The above differences are mainly due to differences in the standards of living, economic development and diversity in lifestyles of the two studied groups. Villages located in the Russian sector of divided Poland varied socially, which translated into differences in living standards between the peasants and gentlefolk. As pointed out by Kuchowicz (Reference Kuchowicz1966, p. 125), ‘the physical appearance of a peasant was much worse than that of a gentleman’. Moreover, ‘a typical gentleman was built differently than a peasant’. The researcher emphasized ‘the substantial height and good physical condition of an average gentleman’ (Kuchowicz, Reference Kuchowicz1966, p. 124). The gentlemen had a higher BMI than the peasants. In addition, more gentlemen were overweight, while more peasant males were underweight. These differences arise from differences in the economic status and style and quality of life of the Polish peasantry and gentry in the Kingdom of Poland.
Poverty, and the very low standard of living associated with it, were very common among peasants in 19th century Poland. For example, in some regions of Galicia, located in the Austrian sector, it was so difficult to find tall males from the peasantry that military recruitment commissions ultimately decided to lower the required height for conscripts (Tokarz, Reference Tokarz1909). Lower body weight, and frequent underweight and short height of peasants – two biological variables highly sensitive to socioeconomic factors – could have resulted from frequent exposure to famine. In the countryside food shortages were very common, especially after the winter and in the early spring before the growing season (a pre-harvest period termed przednówek in Polish; Budnik & Liczbińska, Reference Budnik and Liczbińska2015). The hardship of this period and its duration depended not only on the economic status of the peasants, but also on the abundance of the harvest in the previous calendar year. For peasants it was usually a period of forced fasting during which everything edible was consumed, including rotten food or plants that did not normally appear in the diet, such as various weeds (Kuchowicz, Reference Kuchowicz1966; Budnik & Liczbińska, Reference Budnik and Liczbińska2015). In some populations with a low level of agriculture there were even post-winter death surpluses reflecting the food shortages of that particular period (Puch, Reference Puch1993; Budnik & Liczbińska, Reference Budnik and Liczbińska2015). In rural areas famine was a very common occurrence, especially when harvests were poor due to plant pests, frequent rainfall, invasions of field pests, hot weather or very cold winters. Then peasants made up for food shortages with berries, forest fruits and so-called ‘starvation plants’, including knotweed and sorrel. Nettle leaves were also eaten, and during very heavy famines, roots of sweet rush. In times of food scarcity bread was made not with flour, which was generally lacking, but with, for example, ground peas, beech seeds or dried couch-grass roots (Kuchowicz, Reference Kuchowicz1966; Chwalba, Reference Chwalba2000). If there were cases of overeating in this social group, they usually took place during religious holidays and family celebrations such as baptisms or weddings, when populations that had been malnourished for months ate a large amount, almost to the limits, sometimes resulting in deaths (Kuchowicz, Reference Kuchowicz1966).
Noble cuisine, by contrast, not only abounded in various types of bread and meat, but also in cakes, pies, butter, cream, sugar and honey. At courts and in manors large quantities of meat were consumed, even half a kilo per person per day (the literature reports that at the court of the Polish King Sigismund III up to 2 kg of meat per person were eaten during meals; Michalewicz, Reference Michalewicz1965). This cuisine was also characterized by a high intake of alcoholic beverages. On average, 2–3 litres of beer per person were drunk, as well as various types of spirits and stimulants like coffee and cocoa. The dinner of a gentleman usually consisted of five or six courses, as did supper. Soups, several kinds of meat, a stewed dish made of sauerkraut, meat and mushrooms, and cakes were served (Kuchowicz, Reference Kuchowicz1966). Generally speaking, systematic overeating led to obesity and many diseases in very rich gentry. Already in the 18th century cases of gout were observed in this class, predisposed by the consumption of large amounts of alcohol, sweetened drinks and meat (Choi et al., Reference Choi, Atkinson, Karlson, Willett and Curhan2004; Weaver, Reference Weaver2008). Wealthy people commonly suffered from ‘the stone’, i.e. kidney stones, heart diseases and diseases of the circulatory system. Gentlemen also complained of various leg problems making it difficult for them to walk (Kuchowicz, Reference Kuchowicz1966).
Body mass index can provide information about the physical development of individuals (Carson & Hodges, Reference Carson and Hodges2014). In this study differences in BMI could have resulted from differences in lifestyle during the earlier stages of individual development in the studied group. Poor nutrition during childhood limits the biological potential of growth of body height, while improvement in life conditions in the later stages of life results in the accumulation of weight and a greater contribution of body weight to body height. In this study the lower BMI observed in the peasantry compared with the gentry could have resulted from their lower body height in the early stages of individual development and lower body weight. This demonstrates the still constant low socioeconomic status of this social group at that time. The gentry, by contrast, had a higher standard of living and good nutrition in childhood resulting in higher body height in the later stages of life.
In this study differences in BMI between the 1st and 4th birth cohorts for gentry men (1.48 kg/m2) and women (2.36 kg/m2) were observed; there was a statistically significant difference between the 3rd and 4th birth cohorts for gentlemen (1.96 kg/m2). No statistically significant trends in BMI were noted during the study period for women or men from the peasantry. It is difficult to compare these results with those of other studies from the same historical period since there is a lack of literature in this field of research, or it is very fragmentary (Liczbińska et al., Reference Liczbińska, Czapla, Nowak and Piontek2016). For example, Costa (Reference Costa2004) showed that in the United States BMI increased between 1860 and 1950. A different period under study and deep historical, cultural and economic differences between the US and Poland make it difficult to compare Costa’s results and those of the present study. Cutler and colleagues (Cutler et al., Reference Cutler, Gleaser and Shapiro2003) showed a positive trend in BMI at the beginning of the 20th century, not a result of a decline in physical activity but rather an increase in calorie consumption. In the gentlefolk, the lower BMI in the 4th birth cohort could be due to an increasing trend in body height in this group. This phenomenon was also observed in the Prussian sector and the Kingdom of Poland at the same time (Kopczyński, Reference Kopczyński2007; Nowak, Reference Nowak2011; Czapla & Liczbińska, Reference Czapla and Liczbińska2014). Individuals born in the last cohort were probably better nourished and taller than those born earlier, having as a result a smaller proportion of body weight to body height.
In the case of women, the average BMI in both the peasantry and gentry fluctuated around 22 kg/m2. It is believed that this result could support the fact that women from the gentry could marry men from the peasantry and as a result they appeared in the category of ‘peasants’, blurring the differences in biological characteristics between women from the peasantry and those from the gentry. Such marriages must have occurred if Rutkowski (Reference Rutkowski1906, p. 23) wrote that ‘a gentlewoman who marries a peasant considers herself unhappy’.
The obesity epidemic first affects people of high socioeconomic status from developed countries, followed by those in developing countries (Monteiro et al., Reference Monteiro, Conde and Popkin2004). There is an increase in the incidence of overweight and obesity among the poor in developed countries associated with access to low-cost, high-calorie foods. It seems that at the end of the 19th century the Kingdom of Poland had the status of a developing country in terms of economic development. This was, perhaps, the reason for the significant differences in the prevalence of overweight in gentlemen. There has been a rapid increase in the consumption of high-energy foods and therefore daily intake of calories, and this has led to an obesity ‘epidemic’ (positive energy balance) (Popkin et al., Reference Popkin, Nielsen and Siepa-Riz2002). It can be assumed that the diet of the gentry in 19th and early 20th century Poland was characterized by a similar excess calorie intake in relation to daily energy expenditure. In the peasantry, by contrast, due to their physical activity, different types of household duties and physically demanding everyday field work, the energy surplus in the form of excess weight did not significantly contribute to their body height. On the other hand, Caballero (Reference Caballero2007, p. 3) argued that ‘historically, human obesity was commonly associated with gluttony and lack of self-control at the table’. In the case of the gentlemen in historical Poland this has its justification, but today there are many additional complicating factors, unknown in the 19th century, such as the use of cars and public transport, and the increased availability of food, and in particular fast food and processed food, which influence obesity levels.
This study has confirmed that the phenomena of overweight and obesity, as well as the occurrence of a number of other health problems related to these, were known in the 19th century. However, it was not the ‘epidemic’ that we know today. The fragmentary studies on BMI in historical Poland and Europe do not allow for a more accurate analysis of this phenomenon. According to recent research, the trend of increasing overweight and obesity in some developed countries has been slightly inhibited (Ning et al., Reference Ning, Zhan, Yang, Yang, Tu and Gu2014). Unfortunately, because of economic inequalities in the modern world, there are still many countries, especially developing ones, experiencing a problem with overweight and obesity (Ng et al., Reference Ng, Fleming, Robinson, Thomson and Graetz2014). From the perspective of human biology they resemble the Polish gentry at the end of the 19th century.
In conclusion, differences in the BMI of gentlefolk and peasants in 19th and early 20th century Poland (higher in the former and lower in the latter) resulted from differences in economic status, and hence lifestyles, including diet. The impact of occupational status on BMI was more visible in men than in women: landowners and intelligentsia were characterized by greater BMIs than peasants. The gentry–peasantry differences in BMI also resulted from differences in physical activity: considerably lower in the former and higher in the latter. Woman from both the gentry and peasantry were likely to be more physically active since they ran the household or worked in the fields, which translated into smaller differences in body weight and BMIs. There were no clear trends in BMI changes over the period studied. The lower values of BMI in the 4th birth cohort compared with the 1st in the gentlefolk of both sexes in the late 19th century is probably the result of achievement of a greater body height (body height trend effect), along with a decrease in body weight and a gradual increase in awareness in this social group, which in turn might have caused greater attention to be paid to health and nutrition. Low BMI of men and women from the peasantry confirmed that the economic status of this social group was extremely low in the late 19th and early 20th centuries.
Acknowledgments
The authors wish to thank the journal editor Professor C. G. Nicholas Mascie-Taylor and an anonymous reviewer for their helpful and valuable remarks and advice, which improved the quality of this paper.