Introduction
Intrauterine growth restriction (IUGR) is an abnormal deviation from genetically determined growth in utero. Clinically, IUGR is defined as a fetal weight below the 10th percentile for a given gestational age.Reference Schroder1, Reference Battaglia and Lubchenco2 IUGR infants are at significant risk for lifelong morbidities that affect the pulmonary, cardiovascular, metabolic and neurologic systems.Reference Barker3 Despite these well-recognized morbidities persisting through life, investigations are still required to decipher how IUGR can permanently change the molecular makeup of an individual. As human studies pose various research limitations including difficulty in tissue access and a prolonged lifespan before disease manifestation, animal models that closely mimic human IUGR complications become invaluable tools to investigate mechanisms of disease.
Although multiple animal species have been used as models of IUGR, rodents, particularly rats, represent the vast majority of the IUGR studies in the literature.Reference Vuguin4 One of the first animal models described by WigglesworthReference Wigglesworth5 in 1964 involved the induction of uteroplacental insufficiency (UPI) via bilateral uterine artery ligation in pregnant rats. Our laboratory has traditionally used this well-characterized model to study the postnatal effects of IUGR.Reference Ogata, Bussey, LaBarbera and Finley6–Reference Lane, Ramirez and Tsirka8 In order to use transgenic technology that is mostly available in mice, we wanted to develop a non-genetic mouse model of IUGR. We hypothesized that infusion of U-46619, a thromboxane A2 (TXA2) analog, in pregnant C57BL/6J mice would produce IUGR offspring.
The rationale for using a TXA2 analog in our model is that certain conditions in pregnancy such as cigarette smoking, diabetes mellitus and preeclampsia can all accelerate TXA2 production.Reference McAdam, Byrne, Morrow and Oates9–Reference Tanbe and Khalil11 Excessive TXA2 causes maternal vasoconstriction and hypertension, an environment leading to UPI and fetal IUGR. An experimental mouse model in which the TXA2 receptor is overexpressed in the maternal vasculature resulted in growth-restricted offspring.Reference Rocca, Loeb and Strauss12 In addition, in a maternal rat model of synthetic TXA2 analog ONO-11113 administration, maternal vasoconstriction and resultant hypertension generated IUGR fetuses.Reference Hayakawa, Takemoto and Nakayama13
In the development of our mouse model, we first determined the maternal U-46619 dose necessary to produce growth-restricted offspring. Once the dose was determined, we studied multiple maternal and fetal/neonatal parameters to characterize this new mouse model. Of the fetal/neonatal characteristics, we focused on parameters that were known to be altered in other animal models of IUGR for comparison.Reference Ogata, Bussey and Finley14–Reference Lane, MacLennan, Hsu, Janke and Pham17 In particular, we focused on fetal metabolite and insulin levels. We also measured mRNA levels of hepatic total insulin-like growth factor-1 (IGF-1) and its variants, phosphoenolpyruvate carboxykinase 1 (PEPCK-1) and peroxisome proliferator-activated receptor-gamma coactivator-1 alpha (PGC-1α). We focused on these hepatic genes because IGF-1 is a critical regulator of fetal and postnatal growth,Reference Adamo, Neuenschwander, LeRoith and Roberts18 whereas PEPCK-1 is the main regulatory enzyme for gluconeogenesis,Reference Beale, Hammer, Antoine and Forest19 and PGC-1α is a co-activator in fatty-acid oxidation and gluconeogenesis.Reference Meirhaeghe, Crowley and Lenaghan20 In addition, IGF-1 is transcribed into four major mRNA variants made from alternative promoter usage of either exon 1 (producing variant I) or exon 2 (producing variant II), and alternative splicing excluding or including exon 5 to produce variants, which encode two different E peptide sequences (variants A and B, respectively).Reference Adamo, Neuenschwander, LeRoith and Roberts18 Lastly, we determined when catch-up growth occurred in the IUGR offspring by following postnatal weight gain through the first year of life.
Method
Study design overview
A total of 254 pregnant mice/litters were used to complete all studies. We first determined the maternal U-46619 infusion dose necessary to obtain IUGR offspring. As U-46619 is a potent vasoconstrictor, we measured maternal blood pressure (BP) before and after increasing doses of U-46619 from 0 to 2000 ng/h to demonstrate maternal absorption of U-46619. We counted the number of pups per litter and measured fetal 11-dehydroTXB2 levels at E19.5 to assess whether the TXA2 analog crossed the placenta to affect fetal growth directly.
From the dose determination study described above, we found that a U-46619 infusion dose at 2000 ng/h produced the most growth restriction without significant maternal mortality and morbidity. We measured maternal plasma 11-dehydroTXB2 levels at E15.5 when maternal hypertension was evident. We measured maternal and fetal plasma corticosterone levels at E18.5 to determine whether stress impacted fetal growth. We tracked maternal food intake from post-pump implantation until delivery. We measured fetal metabolite and insulin levels at E19.5 to assess fetal nutrient status at 2000 ng/h infusion. At term birth (postnatal day 1 = P1), we measured nose-to-anus lengths, organ weights and hepatic mRNA levels of genes important for growth and maintenance of adequate nutrient status (IGF-1, PEPCK-1 and PGC-1α). We also measured hepatic tumor necrosis factor-alpha (TNFα) levels to assess U-46619's direct effect on the fetal liver. Lastly, we measured postnatal weights from P1 to P357 to follow the growth trajectory of these IUGR pups over the first year of life.
Animals
All procedures were approved by the University of Utah Animal Care Committee and were carried out in accordance with the National Institutes of Health Guide for the Care and Use of Laboratory Animals. Wild-type C57BL/6J female mice were purchased from The Jackson Laboratory (stock number 000664, Bar Harbor, ME, USA) to mate with existing wild-type C57BL/6 males in our colony.
Micro-osmotic pump implantation
Timed matings of wild-type C57BL/6J male and female mice were set up. The presence of a vaginal plug the morning after mating denoted embryonic day (E) 0.5. At E12.5 (term gestation ∼20 days), pregnant females were anesthetized with an intraperitoneal injection of ketamine (40 μg/g) and xylazine (8 μg/g). Once adequate anesthesia was achieved, a 1-cm incision was made over the right hip. Micro-osmotic pumps (model 1007D, 0.5 μl/h, Durect Corporation, Cupertino, CA, USA) containing vehicle (0.5% ethanol for sham group) or 2–2000 ng/h of U-46619 (catalog no. 16450, Cayman Chemical, Ann Arbor, MI, USA) were implanted retroperitoneally through the incision. The incision was closed with nylon sutures. Mice recovered in their cages and were given ad libitum access to food and water for the remainder of the pregnancy.
For postnatal characterization at term (P1), pups were allowed to be delivered spontaneously, and birth weights and nose-to-anus lengths were recorded. Organs were harvested, weighed and rapidly frozen in liquid nitrogen and stored at −80°C until analysis. The sex of the pup was determined by intra-abdominal dissection and visualization of male or female reproductive organs, or by comparing the anogenital distance. To follow postnatal weight gain, we used unmanipulated wild-type C57BL/6J cross-foster dams (with timed matings set up at the same time as the experimental dams) to provide maternal care from after birth until weaning at postnatal day 21 (P21) to avoid potential confounding factors that may affect lactation and postnatal weight gain, such as maternal discomfort from an indwelling micro-osmotic pump or maternal inability for proper lactation because of previous surgery. Cross-fostering took place within 24 h of delivery of sham or IUGR pups, keeping litter sizes the same as the cross-fostered mothers’ own litter sizes to minimize maternal rejection. The average litter sizes between cross-foster dams and experimental dams were similar (∼7.5 pups per litter). Only sham pups that were above 1.266 g (the 10% for weight based on sham pup weights) and IUGR pups that were below 1.266 g were cross-fostered.
Maternal tail-cuff BP measurements pre- and post-U46619 administration
We used a tail-cuff system (Hatteras Instruments Model MC4000, Cary, NC, USA) that has been demonstrated to correlate strongly with intra-arterial BP in mice.Reference Krege, Hodgin, Hagaman and Smithies21 Non-pregnant 2–3-month-old C57BL/6J female mice (n = 10 females/TXA2 dose) were placed into restraining units mounted on a warmed surface at 38°C. Mouse tails were passed through a cuff and blood flow in the tail was evaluated photoelectrically producing real-time oscillating waveforms that were digitally sampled. Tail-cuff BP was defined as the cuff inflation pressure at which the waveform amplitude fell below a programmable percentage of its original amplitude for a specified number of waveform cycles. Mice were trained on a daily basis from Monday to Friday for 2 weeks before mating and micro-osmotic pump insertion in order to accustom the mice to the tail-cuff procedure. Each animal underwent two sets of 10 measurements per training day. For the inclusion of each set of measurements for the pre- and post-pregnancy data, we required the computer to identify BP successfully in at least 6 of the 10 trials per set. We used mean BP (MBP) measurements and heart rates on the 2nd and 3rd day after pump implantation for data analysis.
Maternal and fetal plasma 11-dehydrothromboxane B2 (11-dehydroTXB2) measurements at E15.5 and E19.5, respectively, via ACE™ competitive enzyme immunoassay
Dams at E15.5 and E19.5 were anesthetized with ketamine and xylazine. Dams at E15.5 were decapitated to collect blood into individual plasma collection tubes (six each for sham and IUGR groups). Each litter of E19.5 pups, delivered by Caesarian section, was also decapitated to pool blood into individual plasma collection tubes (4–10 litters per dose).U-46619 has a short half-life and is rapidly hydrolyzed nonenzymatically to form TXB2. TXB2 is further metabolized by 11-hydroxy-thromboxane dehydrogenase to form 11-dehydroTXB2,which has a longer circulating half-life ∼45 min.Reference Roberts, Sweetman and Oates22 All plasma samples were sent blinded to Cayman Chemical (Ann Arbor, MI, USA) for measurement of 11-dehydroTXB2 via the ACE™ competitive enzyme immunoassay.Reference Pradelles, Grassi and Maclouf23
Maternal and fetal plasma corticosterone measurements at E18.5 via competitive enzyme immunoassay
Dams at E18.5 were anesthetized with ketamine and xylazine and decapitated to collect blood into plasma collection tubes (n = 6 each for sham and IUGR groups). Pups from each litter were delivered by Caesarian section and decapitated to pool blood into plasma collection tubes. Plasma corticosterone levels were determined following Corticosterone High Sensitivity EIA (Immunodiagnostic Systems Inc., Scottsdale, AZ, USA) protocol at 1:250 dilution for maternal plasma and 1:100 dilution for pooled fetal plasma.
Fetal-serum metabolites at E19.5 via mass spectroscopy
Pooled fetal sera at E19.5, obtained from decapitation of each litter into serum collection tubes, were used for metabolite measurements (essential amino acids, nonessential amino acids, citric acid cycle (TCA) intermediates, lactate, glucose, cholesterol; n = 4 each for sham and IUGR litters). Initially, protein was removed from sera following the procedure of Ai et al. Reference A, Trygg and Gullberg24 Each deproteinized sample was suspended in 40 μl of O-methyl hydroxylamine hydrochloride in pyridine (40 mg/ml), sonicated for 5 min and incubated for 1 h at 34°C after which solid debris was removed. In all, 20 μl of this solution was then transferred to an amber autosampler vial and loaded onto an MPS 2 autosampler (Gerstel, Linthicum, MD, USA) where a second derivatization step ensued. An Agilent 6890 (Agilent, Santa Clara, CA, USA) gas chromatograph was used with the initial temperature held at 75°C for 2 min followed by a 40°C/min ramp to 110°C. A second 5°C/min ramp was used to a temperature of 250°C, followed by a final 25°C/min ramp to 330°C for 3 min. A Restek (Bellefonte, PA, USA) 30 m RTX-5MS column fitted with a 10-m guard column was used for metabolite separation. A Waters (Milford, MA, USA) GCT Premier TOF mass spectrometer was used for metabolite detection. Normal electron impact conditions defined as 70 eV were used to detect in the positive mode.
Fetal serum insulin measurement at E19.5 via ELISA
Fetal serum insulin levels were measured with Mercodia Ultrasensitive Mouse Insulin ELISA kit (10-1150-01, Winston-Salem, NC, USA) using pooled fetal sera obtained at E19.5 (n = 10 sham litters and five IUGR litters). Briefly, this ELISA is a solid phase two-site enzyme immunoassay based on the sandwich technique, in which two monoclonal antibodies are directed against separate antigens on the insulin molecule. In all, 50 μl of each serum sample in triplicates along with known concentrations of insulin standards (0.025, 0.075, 0.175, 0.450 and 1.0 ng/ml) were incubated with peroxidase-conjugated anti-insulin antibodies bound to microtitration wells. Unbound enzyme-labeled antibody was washed. Bound conjugate was then detected by reaction with 3,3′,5,5′-tetramethylbenzidine to give a colorimetric endpoint that was read spectrophotometrically at 450 nm.
RNA isolation, cDNA synthesis and real-time reverse-transcriptase polymerase chain reaction (RT-PCR)
Genomic-free total RNA was isolated from 30 mg of P1 (at birth) livers of sham and TXA2-induced IUGR animals using Nucleospin RNA II protocol (Clontech Laboratories, Mountain View, CA, USA). Total RNA was quantified with a Nanodrop spectrophotometer ND-1000 (Nanodrop Technologies, Wilmington, DE, USA), whereas RNA integrity was verified by RNA denaturing gel electrophoresis. cDNA was synthesized from 4 μg of total RNA using random hexamers of SuperScript III First-Strand Synthesis System (Invitrogen Corporation, Carlsbad, CA, USA). Using real-time RT-PCR as described previously,Reference MacLennan, James and Melnyk25 we examined P1 hepatic mRNA levels of total IGF-1 and its four variants (I, II, A and B), as well as PEPCK-1, and PGC-1α (eight per group representing eight separate sham and eight separate IUGR litters). All primers and probes for real-time RT-PCR were purchased as Taqman Assays-on-Demand with assay identification numbers of Mm00439560_m1 (total IGF-1), Mm01233960_m1 (IGF-1 variant I), Mm00439559_m1 (IGF-1 variant II), Mm00710307_m1 (IGF-1 variant A), Mm00439561_m1 (IGF-1 variant B), Mm00440636_m1 (PEPCK-1) and Mm00447183_m1 (PGC-1α) (Applied Biosystems, Foster City, CA). Each sample was run in quadruplicates. Relative quantitation comparing 2−ΔCt values was used to analyze changes in gene expression between sham and IUGR pups with GAPDH as a loading control. To validate GAPDH as an appropriate loading control, parallel serial dilutions between sham and IUGR cDNA were quantified as described previously.Reference Pham, MacLennan and Chiu26 We also ensured that the amplification efficiencies between the target genes and GAPDH were comparable.
Hepatic TNFα protein levels at P1 via Western immunoblotting
Livers of P1 sham and IUGR pups (six per group with pups originating from six separate sham and IUGR litters) were used to make whole-cell lysates by homogenizing in ice-cold RIPA buffer containing 50 mm Tris HCl, 150 mm NaCl, 0.5% DOC, 1% NP-40, 0.1% SDS and protease inhibitor tablet (Roche, Indianapolis, IN, USA). Samples were sonicated three times for 20 s and centrifuged at 10,000 rpm at 4°C for 10 min. Total protein concentration was determined by BCA Protein Assay (Pierce Biotechnology, Rockford, IL, USA) using bovine serum albumin (BSA) as standards. In all, 20 μg of protein and molecular weight markers were separated by gel electrophoresis with XT Criterion gels (Bio-Rad Laboratories, Hercules, CA, USA) at 200 V for 1 h. After electrophoresis, proteins were transferred to polyvinylidene fluoride membranes (Millipore Corporation, Billerica, MA, USA) overnight at 4°C. Post-transfer membranes were blocked in 3% BSA at RT for 1 h. Antibody against TNFα (ab9755, Abcam, Cambridge, MA, USA) at 1:600 in 3% BSA-TBST was incubated with membranes at RT for 1 h. Antibody against GAPDH at 1:5000 was used as a loading control. Hepatic GAPDH protein expression was determined to be unaltered in this IUGR model (data not shown). After multiple washes in TBST, membranes were probed with secondary antibody of horseradish peroxidase-conjugated anti-rabbit immunoglobulin G antibody at 1:10,000 at RT for 1 h. After washing, antibody signals were detected with Western Lighting enhanced chemiluminescence (PerkinElmer, Waltham, MA, USA) and quantified with Kodak Image Station 2000R (Eastman Kodak/SIS, Rochester, NY, USA).
Statistics
Data were expressed as means ± s.e.m. Individual birth weights of sham and IUGR pups (at 2000 ng/h) were also expressed in their 10th, 25th, 50th, 75th and 90th percentiles to illustrate the weight distribution. Mass spectroscopy data deconvolution and peak analyses were performed using MarkerLynx 4.1 software (Waters Corporation, Milford, MA, USA). Principle component analysis (PCA) and partial least squares discriminant analysis (PLS-DA) were performed using SIMCA-P 12.0 (Umetrics, Kinellon, NJ, USA). Biological marker candidates detected from PCA and PLS-DA were tested for significance by integrating the chromatographic area using a characteristic mass for the metabolite in question. Further statistical analysis was performed using Statistica Data Miner (StatSoft, Tulsa, OK, USA). For all data that required pooled sera, we used ANCOVA with litter sizes as covariables for data analysis because the number of pups varied per pooled sample. The rest of the data were analyzed with ANOVA with Fisher's protected least significance difference (PLSD) post hoc test. Statistical significance was declared at P < 0.05.
Results
U-46619 dose determination
Mean maternal MBP measurements, mean litter sizes and mean fetal plasma 11-dehydroTXB2 levels with increasing U-46619 doses from 0 to 2000 ng/h
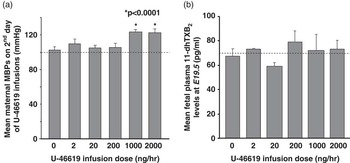
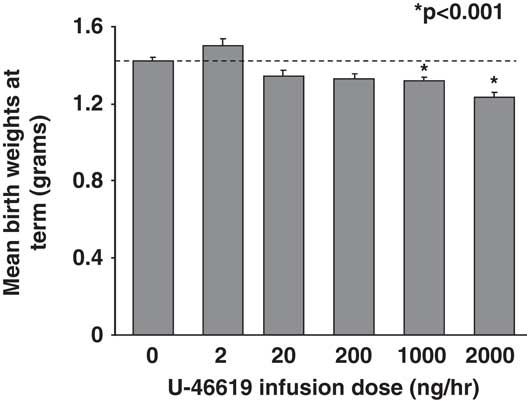
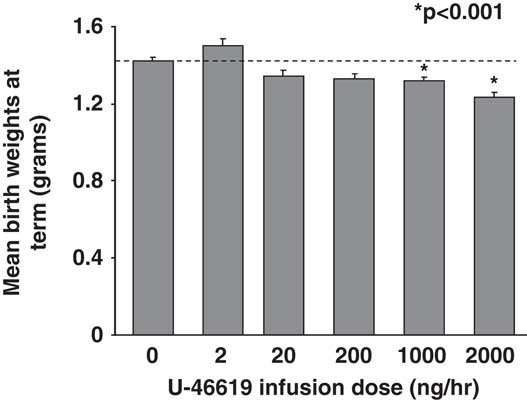
At E14.5, 2 days after vehicle- (sham) or U-46619-loaded micro-osmotic pump implantation, pregnant C57BL/6J mice showed a 20% increase in mean BPs (MBPs) over sham at 1000 and 2000 ng/h U-46619 infusions (Fig. 1a). MBPs remained similarly elevated on the 3rd day at E15.5 (data not shown). No seizures were observed in these pregnant dams. Mean litter sizes between sham and TXA2 pregnancies at all doses were similar with an average of 7.5 pups per litter. The sex ratio of female to male pups also did not differ between sham and IUGR litters. Mean fetal plasma 11-dehydroTXB2 levels were similar between sham pups and pups exposed to all doses of U-46619 (Fig. 1b). Mean birth weights at term gestation were significantly decreased in pups that received 1000 and 2000 ng/h of TXA2 infusions (Fig. 2). Compared with sham pups, 2000 ng/h of TXA2 infusion yielded the most growth restriction (Fig. 2). In addition, mean maternal food intake between sham and 2000 ng/h TXA2 mothers from post-pump implantation to delivery was comparable (5.035 ± 0.322 g/day in sham v. 5.436 ± 0.457 g/day in TXA2, nine dams per group).
(a) Mean maternal mean blood pressures (MBPs) of pregnant C57BL/6J female dams on 2nd day of varying U-46619 infusion doses. Graphs are depicted as mean ± s.e.m. (in mmHg, 10 dams per dose). Dotted line denotes the MBP before U-46619 infusions. *P < 0.0001 compared with sham, using ANOVA. (b) Mean pooled fetal plasma 11-dehydrothromboxane B2 (11-dhTXB2) levels (pg/ml) at E19.5 at varying U-46619 infusion doses. Graphs are depicted as mean ± s.e.m. (4–10 litters per dose). Dotted line denotes mean 11-dhTXB2 levels for sham pups.

Mean birth weights of combined genders at term birth with varying U-46619 infusion doses. Graphs are depicted as mean ± s.e.m. (in g, 11–13 litters per dose). Dotted line denotes mean birth weights for sham pups; *P < 0.001 compared with sham, using ANOVA.
Mean maternal plasma 11-dehydroTXB2 levels for 2000 ng/h U-46619 infusion at E15.5
Sham mothers at E15.5 had mean plasma 11-dehydroTXB2 levels of 4.11 ± 0.66 pg/ml, whereas TXA2 mothers with documented hypertension had mean plasma 11-dehydroTXB2 levels at 13.48 ± 3.16 pg/ml (P < 0.05, six dams per group).
Mean maternal and fetal plasma corticosterone levels for 2000 ng/h U-46619 infusion at E18.5
Sham mothers at E18.5 had mean plasma corticosterone levels of 11.34 ± 1.64 ng/ml compared with TXA2 mothers who had mean plasma corticosterone levels of 9.90 ± 2.44 ng/ml (not significant (NS), six dams per group). Corresponding pups at E18.5 born to these sham mothers had mean pooled plasma corticosterone levels of 1.60 ± 0.16 ng/ml, whereas those born from TXA2 mothers had mean pooled levels of 1.50 ± 0.26 ng/ml (NS, six litters per group).
Fetal/postnatal characterization
Individual pup weight distributions and mean gestational days in sham and 2000 ng/h TXA2 pups at birth
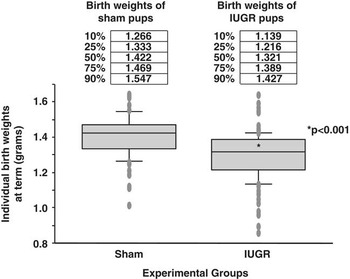
The median weights differed significantly between sham and IUGR pups infused at 2000 ng/h TXA2 (Fig. 3). We found that a birth weight of 1.266 grams defined the 10th percentile for weight for the sham litters, a traditional cutoff for small-for-gestational age (SGA) infants.Reference Battaglia and Lubchenco2 Using this cutoff, approximately one-third of the TXA2-induced pups at 2000 ng/h were defined as SGA. In addition, the mean gestational days between sham and 2000 ng/h of TXA2 was similar (20 ± 0.1 days in sham v. 19.9 ± 0.1 days in TXA2, 17 litters each).
Box plots of individual birth weights of combined genders at term for sham and IUGR pups at 2000 ng/h U-46619 infusion. The top, middle and bottom horizontal lines of each box depict the 75th, 50th and 25th percentiles, respectively, for birth weights (in g). The shortest horizontal lines above and below the boxes depict the 90th and 10th percentiles, respectively (10 litters for sham and 14 litters for intrauterine growth restriction). Raw birth weight values corresponding to the stated percentiles are shown above the box plots; *P < 0.001 compared with sham, using ANOVA.

Fetal serum metabolites in sham and 2000 ng/h TXA2 pups at E19.5
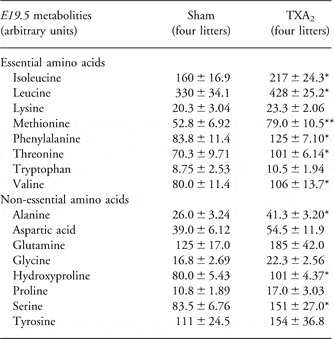
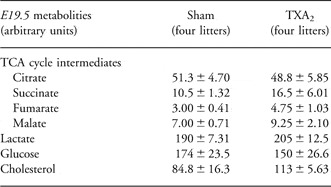
Six out of eight fetal (E19.5) serum essential amino acids examined, namely isoleucine, leucine, methionine, phenylalanine, threonine and valine, were increased in IUGR pups compared with sham pups (Table 1). Three out of eight nonessential amino acids (alanine, hydroxyproline and serine) were also increased (Table 1). However, we did not detect differences in TCA intermediates, lactate, glucose or cholesterol (Table 2).
Mean AUC of essential and non-essential amino acids for pooled serum samples of sham and IUGR pups at E19.5 after 2000 ng/h U-46619 infusion

AUC, areas under chromatograms; IUGR, intrauterine growth restriction.
Results are depicted as means ± s.e.m. *P < 0.05 and **P < 0.01 compared with sham, using ANOVA.
Mean AUC of TCA cycle intermediates, lactate, glucose and cholesterol for pooled serum samples of sham and IUGR pups at E19.5 after 2000 ng/h U-46619 infusion

AUC, areas under chromatograms; TCA, citric acid cycle; IUGR, intrauterine growth restriction.
Results are depicted as means ± s.e.m.
Fetal serum insulin levels in sham and 2000 ng/h TXA2 pups at E19.5
Pups whose mothers received 2000 ng/h TXA2 had significantly decreased fetal serum insulin levels compared with sham pups at E19.5 (0.968 ± 0.134 ng/ml in sham v. 0.493 ± 0.172 ng/ml in TXA2, five litters for sham and 10 litters for TXA2, P < 0.05).
Mean body/organ weights and nose-to-anus lengths in sham and 2000 ng/h TXA2 pups at birth
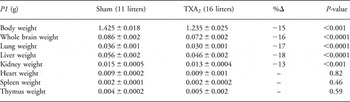
In addition to an overall decrease in body weights, pups whose mothers received 2000 ng/h of TXA2 had decreases in weights of the brain, lung, liver and kidney (Table 3). Weights of the heart, spleen and thymus of IUGR pups were similar to sham pups (Table 3). Nose-to-anus lengths were also similar between sham and IUGR pups (2.983 ± 0.023 cm in sham males and 2.972 ± 0.034 cm in sham females v. 2.960 ± 0.026 cm in TXA2 males and 2.921 ± 0.034 cm in TXA2 females, nine litters for sham and eight litters for TXA2).
Mean body and organ weights of sham and IUGR pups of combined genders at term birth after 2000 ng/h U-46619 infusion

P1, weight t term; IUGR, intrauterine growth restriction.
Results are depicted as means ± s.e.m. (n = 11 litters for sham and 16 litters for IUGR). Percentage decreases in weights in IUGR compared with sham are shown in %Δ column. P < 0.001 or P < 0.0001 compared with sham, using ANOVA.
Hepatic mRNA expression of IGF-1, PEPCK-1, PGC-1α in sham and 2000 ng/h TXA2 pups at birth
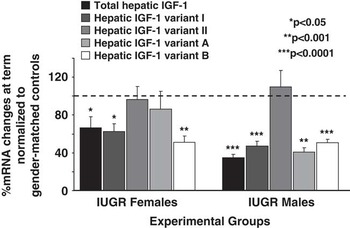
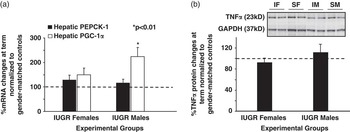
We have separated our mRNA analyses into females and males because sexually dimorphic gene expression is common in the liverReference van Nas, Guhathakurta and Wang27, Reference Smirnov28 and IUGR is known to elicit gender-specific responses. IUGR significantly decreased total hepatic IGF-1 mRNA expression by 44% in females and 65% in males (Fig. 4) compared with their sham counterparts. Of the variants examined, IUGR decreased variants I and B in females, whereas IUGR decreased variants I, A and B in males (Fig. 4). In addition, IUGR males had significantly increased PGC-1α mRNA level compared with sham males (Fig. 5a), with no change in mRNA levels of PEPCK-1 in either gender.
Quantification of total hepatic insulin-like growth factor-1 (IGF-1) and IGF-1 variants mRNA levels in intrauterine growth restricted pups at term birth after 2000 ng/h U-46619 infusion. Females and males are presented separately. Graphs are depicted as mean ± s.e.m. of %mRNA changes relative to gender-matched shams, which have been set as 100% (n = 8/group); *P < 0.05, **P < 0.001, ***P < 0.0001 compared with gender-matched shams, using ANOVA.

(a) Quantification of hepatic phosphoenolpyruvate carboxykinase 1 (PEPCK-1) and peroxisome proliferator-activated receptor-gamma coactivator-1 alpha (PGC-1α) mRNA levels in intrauterine growth restricted (IUGR) pups at term birth after 2000 ng/h U-46619 infusion. Females and males are presented separately. Graphs are depicted as mean ± s.e.m. of %mRNA changes relative to gender-matched shams, which have been set as 100% (n = 8/group). (b) Quantification of hepatic tumor necrosis factor-alpha (TNFα) protein levels in IUGR pups at term birth after 2000 ng/h U-46619 infusion. Females and males are presented separately. Graphs are depicted as mean ± s.e.m. of %protein changes relative to gender-matched shams, which have been set as 100% (n = 6/group). Representative TNFα and GAPDH blots are presented above the graph (IF, IUGR females; SF, sham females; IM, IUGR males; SM, sham males); *P < 0.01 compared with gender-matched shams, using ANOVA.

Hepatic TNFα protein expression in sham and 2000 ng/h TXA2 pups at birth
Hepatic TNFα protein levels between sham and TXA2 pups were comparable at birth (Fig. 5b).
Postnatal weight gain between sham and 2000 ng/h TXA2-induced IUGR pups
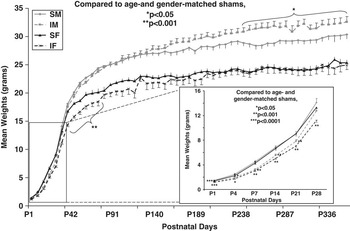
Figure 6 outlines the postnatal weight gain of sham and TXA2-induced IUGR pups from birth (P1) to 1 year (P357, five litters per age). We separated females and males to highlight gender differences in growth velocity. The boxed region within Fig. 6 shows that IUGR females and males weighed less than their age- and gender-matched shams from P1 to P21. However, at P28, IUGR males caught up in weights with sham males, whereas IUGR females caught up in weights with sham females at P77 (Fig. 6). From P238 (8–12 months) to the end of the first year, IUGR males weighed significantly more than their age-matched sham males.
Mean postnatal weights of sham and intrauterine growth restricted (IUGR) pups from birth (P1) to P357 after 2000 ng/h U-46619 infusion. Sham males (SM) are depicted as solid gray line; TXA2-induced IUGR males (IM) are depicted as broken gray line; sham females (SF) are depicted as solid black line; TXA2-induced IUGR females (IF) are depicted as broken black line. Line graphs show mean ± s.e.m. at each postnatal age (in g, five litters per age). Boxed area is a magnified view of weights at P1–P28 to highlight gender differences; *P < 0.05, **P < 0.001, ***P < 0.0001 compared with age- and gender-matched shams, using ANOVA.

Discussion
In this study, we have created a novel non-brain sparing IUGR mouse model using U-46619, a TXA2 analog, infusion. The basis for using a TXA2 analog is that TXA2 production is accelerated in many conditions of human pregnancies that can lead to IUGR. These conditions include cigarette smoking, diabetes mellitus and preeclampsia. Our model thus shares many characteristics with human IUGR pregnancies. Furthermore, creating an IUGR model in the mouse provides a powerful tool to study the impact of IUGR on transgenic mice. Although many genetically manipulated mouse models with resultant IUGR exist, this IUGR model has the potential to be induced in any mouse strain, avoiding the cost and labor associated with targeted gene manipulation. Another advantage of this model over other surgical models of IUGR is its relative ease and noninvasive nature of micro-osmotic pump implantation. In this regard, mice circumvent a laparotomy associated with other surgical models, which translates to shorter anesthesia time and better preservation of these pregnancies.
In our model, exogenous U-46619 infusion at 2000 ng/h in the last week of C57BL/6J mouse gestation produces maternal hypertension, with unaltered litter sizes and gestational lengths. Similar fetal thromboxane metabolite levels and similar fetal hepatic TNFα protein levels between sham and IUGR pups suggest that UPI most likely led to fetal growth restriction rather than a direct effect of U-46619 or its metabolites on fetal growth. We acknowledge that we have not directly measured uteroplacental blood flow to the fetuses in this study. We are in the process of collecting placental weights and will be pursuing placental histology to assess U-46619's effects on the placenta.
Our IUGR offspring have a 15% decrease in birth weight, compared with the traditional IUGR rat model in which birth weight is 20–25% lighter.Reference Joss-Moore, Wang and Campbell29, Reference Baserga, Hale and Wang30 Neither maternal nor fetal stress significantly contributed to this growth restriction as seen by similar E18.5 plasma corticosterone levels. Similar to the incidence of human SGA infants in IUGR epidemiological studies,Reference Eskenazi, Fenster, Sidney and Elkin31, Reference Pietrantoni and O'Brien32 approximately one-third of the IUGR mouse pups are below the 10th percentile for weight compared with weights in the sham population. In addition to the overall decrease in birth weight, whole-brain weight was also decreased, demonstrating a non-brain sparing IUGR model. This non-brain sparing effect is typical of a chronic in utero insult as opposed to the 2-day rat uterine artery ligation model in which brain sparing occurs. Other examples of non-brain sparing animal models with a more protracted in utero insult include chronic placental insufficiency induced by umbilico-placental embolization in the sheepReference Duncan, Cock and Loeliger33 and placental infection with cytomegalovirus in the mouse.Reference Li and Tsutsui34 In human pregnancies that are complicated by congenital infections, genetic disorders or other extrinsic conditions that are active early in pregnancy, non-brain sparing IUGR infants are commonly seen.
Metabolically, our TXA2-induced IUGR mouse pups have certain increased essential (the branched-chain amino acids of isoleucine, leucine and valine) and nonessential amino acid levels. They also have normal fetal glucose levels. Collectively, this metabolic profile is different from that of the IUGR rat model in which decreased fetal branched-chain amino acids and hypoglycemia are seen.Reference Ogata, Bussey, LaBarbera and Finley6 We speculate that these metabolite discrepancies exist because the inciting stimuli and duration of IUGR are different between the two models. Of interest is the fact that the fetal metabolic profile of our novel mouse model replicates closely to that seen in human pregnancies with TXA2 overproduction, particularly with pregnancy-induced hypertension (PIH). Whereas infants from other causes of IUGR are regarded as nutrient deficient, infants of PIH mothers show increased serum nutrients including glucose and amino acids.Reference von Versen-Hoeynck and Powers35, Reference Evans, Powers and Ness36 Whether such increased nutrients in the fetus represent increased transplacental transport, decreased fetal utilization or increased fetal catabolism are unclear at this stage.
A metabolic marker that is similar between the IUGR mouse and rat models is a decreased fetal serum insulin level. Insulin is one of the most potent hormones stimulating fetal growth. Because insulin is a central regulator of fetal growth, the β-cell in the pancreas can be seen as functioning to match fetal nutrient supply with hormonal signals for growth.Reference Barry, Rozance and Anthony37 Decreased insulin secretion in this situation may be viewed as a positive adaptive mechanism limiting fetal growth during relative nutrient restriction. Apart from insulin's growth promoting actions on the fetus, IGF-1 also plays an important role in the growth of the offspring.
IGF-1, by virtue of its homology to insulin and the similarity between the IGF-1 and insulin receptors, has been shown to elicit insulin-like metabolic effects.Reference Adamo, Neuenschwander, LeRoith and Roberts18 Indeed, IGF-1 measurements in human umbilical cord serum have been shown to be lower in SGA neonatesReference Foley, DePhilip, Perricelli and Miller38 and in our fetal rats that have undergone bilateral uterine artery ligation.Reference Unterman, Simmons, Glick and Ogata39 In addition, IGF-1 deficiency in knockout mice is associated with severe intrauterine growth failure.Reference Baker, Liu, Robertson and Efstratiadis40 Our IUGR mouse pups at birth showed reduced total hepatic IGF-1 mRNA levels. Such total IGF-1 mRNA decreases are consistent with those observed with the IUGR rat model.Reference Fu, Yu, Callaway, Lane and McKnight41 However, our IUGR male offspring showed a gender-specific variant A mRNA reduction compared with IUGR females. Variant expression is important to confer spatiotemporal and gender-specific tissue expression. As such, IGF-1 variant A in this model appears to be particularly sensitive to gender-specific perturbation of IUGR by TXA2 overproduction.
Apart from the additional IGF-1 variant reduction, IUGR male pups also show increased hepatic mitochondrial biogenetic PGC-1α mRNA level at birth compared with sham males and IUGR females. Such increase in PGC-1α mRNA have been observed in the IUGR rat model as well.Reference Lane, MacLennan, Hsu, Janke and Pham17 This mRNA change at birth may signify that the IUGR males have already reprogrammed their energy homeostasis to increase glucose metabolism during the period of placental insufficiency. We posit that coupling this hepatic change with an earlier catch-up growth at P28 would place these IUGR males at significant risk for the early development of metabolic syndrome in the postnatal period. This speculation is partly supported by the heavier weights observed in IUGR males from P238 compared with sham males. Thus, this model further resembles complications associated with human IUGR in which males are particularly susceptible to earlier onset of metabolic syndrome.Reference Varvarigou42–Reference Barker, Eriksson, Forsen and Osmond44
We acknowledge that this study has mainly focused on the offspring phenotype because of our laboratory's interest in mechanisms of fetal origins of adult disease. The complete characterization of the maternal phenotype is beyond the scope of this study. We have also only characterized the morphometric, biochemical and certain molecular phenotypes of the perinatal period. We speculate that the hepatic protein levels of IGF-1, PEPCK-1 and PGC-1α would correlate with the mRNA expression levels at this age. We further speculate that other genes relating to the ones examined such as IGF-binding proteins, IGF-2 and peroxisome proliferator-activated receptor isoforms would show altered expression in this model. Experiments aimed at elucidating these and many adolescent and adult complications of IUGR are under way to determine the ultimate phenotypes of this model.
We also recognize that certain limitations exist in our study. Even though the mouse is highly related to humans with similar genes, biochemical pathways, organs, and physiology, a major limitation of rodents is that offspring are born with an underdeveloped brain and endocrine/paracrine system that requires significant maturation during the weaning period.Reference Vuguin4 This is offset by a compressed developmental time course such that disease processes can be studied from birth to adulthood in a timely manner. Moreover, litter-bearing animal models may have a variable nutrient supply among the fetuses from the same litter compared with human singleton pregnancies. Nevertheless, the creation of this TXA2 analog-induced IUGR mouse model provides an opportunity to establish fetal growth restriction in transgenic mice to study any transgene of interest relating to fetal programming of adult disease.
In summary, using a pharmacological approach, we have generated a chronic IUGR mouse model that has the potential to be used in any mouse strain including transgenic mice. More importantly, by deriving maternal hypertension, we have created a common cause of IUGR in humans of both developing and developed countries. Even though other mouse models of IUGR exist, the vast majority of these models entail manipulating a specific geneReference Hensen, Braem and Declercq45–Reference Yoshida, Gan and Franke53 to cause IUGR. Other mouse models of IUGR without gene manipulation exist too. For example, via maternal cigarette smokingReference Esposito, Horn, Greene and Pisano54, Reference Gandley, Jeyabalan and Desai55 and ethanol exposure,Reference Kaminen-Ahola, Ahola and Maga56 ‘crowded uterine horn model’ via hemiovariectomy,Reference Coe, Kirkpatrick, Taylor and vom Saal57 maternal protein malnutritionReference Sutton, Centanni and Butler58 and maternal placental infection.Reference Li and Tsutsui34, Reference Bobetsis, Barros, Lin, Arce and Offenbacher59 All these models provide their own invaluable ways to study the mechanisms of pathophysiology relating to IUGR. Our novel model complements further by its close resemblance to human pregnancy complications that have TXA2 overproduction as its underlying etiology of IUGR and by its relative ease of surgical IUGR induction.
Acknowledgments
This study was supported by NIH 1R01DK080558-04 (to RHL) and by University of Utah Children's Health Research Career Development Award 5K12-HD001410-06 and Primary Children's Medical Center Foundation Innovation Research Grant (to CF). We thank Huifeng Jin for her technical assistance in tail-cuff blood pressure measurements and organ weight measurements.