1 Introduction
Poor public spending or regulatory decisions arise overwhelmingly from perverse political priorities or perceptions, or errors in forecast costs or benefits, not from poor choices of social discount rate (SDR) or mishandling of the cost of public funds. This is just as well, given the diversity of SDR conventions. Nonetheless, the criteria for comparing public spending and consumption benefits, with each other and over time, are still often important. A sound conceptual framework is also needed for reliable appraisal of many special situations.
Routine social discounting began in the 1960s and Jenkins et al. (Reference Jenkins, Kuo and Arnold2011, section 8.2) summarizes four strands of development over subsequent decades. The two main paradigms today, each with variants, are the Social Opportunity Cost (SOC) paradigm, based on the rate of return that would be expected on funds left in the private sector, and the social time preference (STP) paradigm, based on the estimated social preference for marginal consumption sooner rather than later. In recent years, systematic risk and the cost of public funds have emerged as major divides within the STP paradigm.
This article draws on many decades of literature, but especially on Harberger and Jenkins (Reference Harberger and Jenkins2015) and Burgess and Zerbe (Reference Burgess and Zerbe2011)—all leading advocates of the SOC paradigm and henceforth H&J 2015 and B&Z 2011—and on a U.S. Council of Economic Advisers Issue Brief (CEA, 2017). The CEA Brief itself draws on B&Z 2011 in presenting, in a U.S. context, a balanced picture of academic views. Burgess and Zerbe have also had a revealing exchange with advocates of STP discounting (Burgess & Zerbe, Reference Burgess and Zerbe2013; Moore et al., Reference Moore, Boardman and Vining2013a, Reference Moore, Boardman and Viningb, Reference Moore, Boardman and Vining2017). Burgess (Reference Burgess2018) provides a useful exposition of the SOC framework, including comparisons with the STP framework as it is sometimes (badly) applied.
The article draws also on experience of developing and applying SOC and STP regimes and the handling of systematic risk. It is written mainly from the perspective of finance ministries, but also from those of public spending and regulatory agencies and private sector suppliers to the public sector. For reasons developed later, this has led to views including the following as a basis for practical guidance within government.
(i) In developed economies, the consumption-equivalent cost of funding $1 of public spending cannot be precisely valued, but may often be closer to $2 than to $1. In this article, the term “marginal cost of (public) funds (MCF)” is used to describe a single, broadly defined ratio (≥1) of the value of all marginal public spending dollars to the value of consumption dollars.Footnote 1
(ii) When comparing public spending with consumption benefits, STP discounting needs to take due account of the MCF. If this is not done, SOC discounting will often be better practice.
(iii) For “like with like” comparisons over time of public spending with public spending, or consumption with consumption, STP discounting is appropriate.
(iv) Generally, for public service benefits, the social cost of systematic risk is probably very small.
Section 2 below outlines current SDR regimes. Section 3 is a short comparative review of the SOC and STP paradigms. Section 4 discusses the MCF. Section 5 discusses “like with like” comparisons and differences in framing between the two main paradigms. Section 6 addresses risk. Section 7 presents analytical and operational conclusions. Appendices discuss the derivation of an STP rate and some special cases.
All annual percentage rates are in real terms.
2 Current paradigm choices
Social discounting regimes are listed here under five headings. Some authorities apply different regimes to different policy contexts.
2.1 SOC regimes
Some authorities, notably New Zealand and the federal governments of Australia and Canada, apply SOC discount rates, typically of 7 or 8%, although with low real interest rates SOC estimates may be as low as 6% (New Zealand Treasury, 2016). In the 1960s and 1970s, SOC rates were seen simply as the rate of return to private sector investment, but in several countries this has developed into a wider concept.Footnote 2 The U.S. federal government has, since 1992 (Office of Management and Budget [OMB], 1992, section 8b[1]), specified for cost–benefit analysis a default a rate of 7%, based on the return to business capital.Footnote 3
2.2 STP regimes
Most European-wide institutions and some European countries apply conventional STP discount rates, typically in low single figures. The U.S. OMB long specified such a rate for regulatory appraisal where the impact is on consumers rather than business investment, although the current guidance is simply that all regulatory impact assessment should use discount rates of 3 and 7% OMB (2017, p. 11). The rate of 3% originally followed from the assumption that “the rate that the average saver uses to discount future consumption is a measure of the social rate of time preference [for which] the real rate of return on long-term government debt may provide a fair approximation.”
2.3 Risk free interest rate regimes
CEA (2017) refers to “the common practice of using Treasury rates as a proxy for the SRTP,” but this oversimplifies. OMB (1992, section 8c) specifies for “cost-effectiveness, lease purchase, and related analyses” a discount rate equal to the government borrowing rate for an appropriate term. However, risk free interest rates (RFIRs) in SDRs appear most often as an element in “high-risk premium” regimes as summarized below.
2.4 “High-risk premium” regimes
This covers regimes that attribute to most publicly financed investment explicit, “high” risk premiums for covariance of consumption benefits with income and/or with equity markets. This may be added to an RFIR or to a conventional STP rate. The Norwegian Expert Committee (2012) endorsed the convention (for years 0–40) of an RFIR, taken as 2.5%, plus a market-based risk premium of 1.5%, with adjustment for projects with especially high or low systematic risk. The Netherlands Government (Werkgroep discontovoet, 2015) recommended an RFIR, taken as zero, as a proxy for STP, to which is added a financial-market-based risk premium of 3%. France (Ni, Reference Ni2017) applies a “low” STP rate of 2.5% (declining after 2070), to which is added a premium of up to 2%, depending on the type of project, for covariance with income, derived from the Consumption CAPM.
2.5 Pragmatic regimes
Some bodies face institutional constraints on promoting a formal analytical framework. The World Bank, for example, has for many years specified a real rate of 10% or higher for project appraisal.Footnote 4
3 The STP and SOC paradigms
The STP paradigm defines the SDR as the weight that the current population gives or should give to future populations’ marginal consumption or income. When an STP discount rate is used to compare public spending dollars with consumption dollars, public spending dollars need to be multiplied by an MCF as defined in Section 1 to make them commensurable with consumption dollars.
The SOC paradigm applies a SDR equal to the rate of return from the funds being left in the private sector.Footnote 5 This return naturally incorporates time preference elements, reflecting the preferences of investors.
These two frameworks stem from the 1950s and 1960s and Sections 3, 4, and 5 address long-evolving issues from that period. Later, mainly from the 1980s, financial economists argued that the equity risk premiums in private financing apply also to public financing. These arguments have obvious logical overlaps with the historic SOC/STP debate. They are, however, a different strand of literature applying predominantly to RFIR or STP regimes and therefore deferred to Section 6.2.
The SOC and STP paradigms have some common features.
Both B&Z 2011 and H&J 2015 note how, if a public expenditure weighting is included in the STP approach, the STP and SOC approaches can for many CBAs give a similar division of projects into those with positive and negative net present values (NPVs). H&J 2015 (p. 9) make this point as follows, where a shadow price of investible funds (SPIF)—similar to the MCF as defined above–is applied to public investment dollars to make them commensurable with consumption dollars: “We … consider as close allies those who [like H&J] opt for a weighted average [SOC] discount rate of ω with a SPIF of one, and those who opt for a [STP] discount rate of r with a SPIF of ω/r. The real enemies of sound economics are those who press for the use of low discount rates like r, without due recognition of the costs entailed when forgone investments would have had rates of marginal productivity much higher than r.”
SOC and STP regimes also both normally work in real as opposed to nominal values. Most regimes apply the same SDR to nearly all cases. And both approaches generally avoid assuming systematic, exogenous changes in future growth rates or other aggregate economic variables.Footnote 6
Harberger (Reference Harberger2007) introduced into the SOC paradigm the concept of the marginal dollar of taxation as “a necessary supplement … [to] … the conventional [SOC] assumption of capital market sourcing.” This distinguishes between projects that are self-financing, say by user charges, and those that are not. It assumes that, with no cost recovery, a project would accumulate debt, with tax raised to recover the financing of this debt. This would incur an MCF, described by Harberger as the “shadow price of public funds.” STP regimes would typically treat such public revenue fairly similarly, as negative public spending.
Many practitioners of both paradigms might agree on the basic mechanics of public finance. Public spending in developed economies is generally funded mainly via some form of consolidated fund, funded in turn mainly by taxes and borrowing. Therefore, the same value for the MCF applies to net public spending on nearly all of a government’s projects and programs and equally to capital and current public spending.
The capital/current distinction is central to public expenditure planning and management. But this is separate from the question of whether the social cost of funding $1 million of public capital spending (or overspending) differs from that of funding $1 million of public current spending (or overspending). In the STP literature, the same weight for capital and current spending is usually explicit.Footnote 7 In the SOC literature, this is generally seen in a similar way. Sjaastad and Wisecarver (Reference Sjaastad and Wisecarver1977, p. 516), a thoughtful paper cited with approval by B&Z 2011, notes that “there can be no doubt that current public expenditure must be charged not only with current consumption forgone, but also with unrealized potential future consumption due to displacement of current investment in other sectors.”
Most SOC and STP regimes are applied within the same general conventions of cost–benefit analysis, such as valuing non-marketed costs and benefits in terms of people’s “willingness to pay.”
B&Z 2011 comment on the survey by Weitzman (Reference Weitzman2001) of professional economist opinion of the appropriate SDR for very long-term benefits, the responses to which lay mainly in low single figures. B&Z 2011 (pp. 11–12) cast doubt on this work as a basis for public policy. Many STP advocates would share some of these doubts.Footnote 8
It is also widely accepted across both paradigms that discounted present values of costs and benefits are rarely the last word in project or policy appraisal: there will generally be other significant factors to feed into decision-making.
The paradigms do, however, approach the issues very differently.
The STP paradigm estimates a value of STP from first principles. As outlined in Appendix A, this draws heavily on empirical data, but also includes (usually very small) elements that entail judgments within the authority setting the rate. For estimating NPVs, the paradigm needs a value for the MCF as defined in Section 1.
The SOC paradigm estimates the rate of return that would be yielded by money left in the private sector instead of being spent by the public sector. This draws mainly on hard data, typically from national accounts, with no institutional judgments such as those in an STP rate. An SOC rate is applied as a “social cost of capital” for public financing.Footnote 9 The paradigm is therefore framed in such a way that “STP” and the “consumption equivalent value of $1 of public spending” does not arise. Viewed from within the STP framing, the SOC paradigm implies a very high rate of STP and there are problems as discussed below with respect to its implicit MCF, but for many practical CBAs, these qualifications are unimportant.
It is sometimes suggested (as in CEA, 2017) that use of the Ramsey equation in deriving a STP rate implies a growth model with restrictive assumptions. The memory of Frank Ramsey, as an early pioneer of growth theory, deserves the fame brought by this use of the equation. However, as illustrated in Appendix A, the equation in this context is no more than a pragmatic way of assembling the elements of STP. Its use implies no restrictive assumptions beyond constant values for those elements (except in certain cases, where the equation may be further developed).
A more substantial and long-standing argument is that the SOC paradigm promotes projects that produce a potential Pareto improvement, but the STP paradigm does not. B&Z 2011 (p. 3) says: “The SOC approach is justified by the straightforward principles of applied welfare economics—demand price measures marginal benefit, competitive supply price measures marginal cost, … The discount rate … must cover the productivity that is forgone as a consequence of displaced investment and the [effects on] newly induced savings and … incremental foreign funding. Any lower rate than the weighted average represented by the SOC will fail this test. … Any higher rate will forego desirable projects.” (emphasis added).
It is argued that use in the STP paradigm of a SDR that includes professional, politically approved judgments (and hence a social welfare function specified by the policymaker) separates it fundamentally from the SOC paradigm. If the difference extended to rejection of the concept of “STP,” there could be no resolution, but the gap seems generally not to be quite that wide.
From a practitioner’s perspective, it seems that the advice of economists in government, whichever paradigm they support, generally aspires to social welfare maximization, including where appropriate potential Pareto optimality. It also seems that there is wide acceptance of a “consumption rate of interest,” even if not about how it should be derived.
Both paradigms nonetheless face difficulties.
For realistic values of SOC and STP rates, the text emphasized above does not sit easily with “like with like” comparisons (e.g., of public spending with future expenditure savings), as discussed in Section 5 below.
On the other hand, for many CBAs (comparing public spending with consumption benefits), an SOC rate will probably give a better ranking of projects than an STP rate alone, used without a satisfactory MCF weighting to public spending relative to consumption.
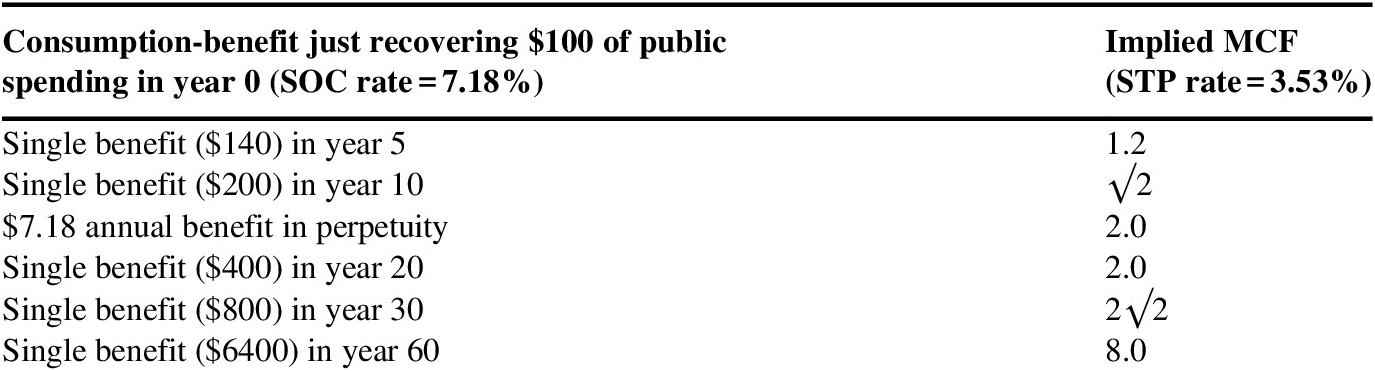
However, the simplicity of combining the two criteria of time preference and the cost of public funds (arising from the distortionary effects of taxation) into a single instrument as a rate of return presents problems, even for CBA. In particular, the implicit value of the MCF (the ratio of the value of public spending dollars to the value of consumption dollars) becomes a function of the time interval between the public spending and when it is “recovered” in consumption benefits. Table 1, stylized for arithmetical simplicity, illustrates this for a hypothetical SOC discount rate (7.18%) that discounts by 50% over 10 years and STP rate (3.53%) that discounts by 50% over 20 years. The first column lists alternative benefits that, discounted at 7.18%, would just recover the initial $100 of public spending. The second column is the implied value of publicly spending dollars relative to consumption dollars, given by the present value of the consumption benefit (discounted at the STP rate of 3.53%), divided by $100.Footnote 10
Implied MCFs for a given SOC discount rate.

The very high-implied MCF in the bottom row, for a very long interval before “recovery” of the initial spending, is discussed in Section 5. However, for these, not unrealistic SOC and STP values, the implied MCFs for benefits concentrated over a few decades after an initial investment (or arising evenly over time in perpetuity) are broadly consistent with other, more direct valuation evidence discussed in Section 4.3.
4 The marginal cost of public funds
It is widely accepted that raising $1 of taxation, or government debt, costs more than the loss of $1 of consumption. The term MCF in this article denotes the ratio of the (broadly defined) social cost of public spending dollars to the value of consumption dollars.
4.1 The MCF in the SOC paradigm
In the SOC paradigm, the opportunity cost of public spending is the (weighted average) rate of return that would be yielded by dollars left in the private sector. This rate is applied to public projects and policies as a cost of capital. In the 1960s and 1970s, it was often seen as the rate of return to private sector investment. However, as CEA (2017) records (drawing on B&Z 2011), Harberger and others developed from the 1970s a “blended approach,” having regard to not only pre-tax marginal returns to capital but also post-tax marginal returns to savers and the marginal cost of foreign financing. Public revenue may be handled separately, as noted in Section 3.
CEA (2017) summarizes, drawing in part on H&J 2015, many problems facing such a derivation, all of which are addressed by leading SOC practitioners and not rehearsed here.Footnote 11
The SOC rate of return is a measure of the social cost of public funds. However, as noted in Section 3, valuing the MCF in this way does not produce a unique MCF.
4.2 The MCF in the STP paradigm
With STP discounting in CBA (comparing public spending dollars with consumption dollars), the MCF needs to be addressed, as discussed later, but is often overlooked.
One reason for this neglect is doubtless that bodies promoting a CBA can face an incentive to omit it, in searching for high NPVs or BCRs. Finance ministries may be wary of exposing to debate such a sensitive and challenging concept. They might also fear that explicit quantification would reduce their own freedom of maneuver with spending bodies. But a major obstacle to wider recognition of the MCF by STP practitioners must be that its explicit valuation is so difficult.
4.3 Valuing the MCF
This MCF, defined here as the ratio of the value of public spending dollars to the value of consumption dollars, will include some “opportunity cost” of lost returns from diverted private sector investment, but may also include many direct, distortionary costs of marginal taxation. Several strands of analysis contribute to its valuation.
One of its elements is often derived by estimating the “triangles” of lost consumer and producer surplus arising from taxation. This generally values the social cost of a marginal $1 of taxation as $1.2 to $1.3 of consumption.Footnote 12
However, government fundraising affects the economy in many other ways, via corporate and individual location decisions, remuneration structures, tax avoidance activities, and much else, beyond even the effects conventionally considered in the SOC paradigm.
Barrios et al. (Reference Barrios, Pycroft and Saveyn2013) reviews the literature on the marginal cost of taxes. Its own analysis suggests an MCF for labor taxes in the region of two.Footnote 13 Feldstein (Reference Feldstein1997), appealing for more work on the issue, derived a rough estimate of more than two, based on experience of the U.S. tax reductions under President Reagan. Feldstein (Reference Feldstein1999), in a more rigorous work still appealing for more research, again concluded that “the relative deadweight cost caused by increasing existing tax rates is substantially greater [than $1.30 per $1 of revenue] and may exceed $2 per $1 of revenue.” Threshold benefit/cost ratios in STP regimes (consumption benefits divided by public spending) revealed by the boundary between proposals accepted and rejected are a crude measure of the MCF, but limited evidence suggests that such implicit MCFs are not inconsistent with Feldstein and Barrios et al.
There are, however, other views. Even the view that the MCF is more than one is not uncontentious. Jacobs (Reference Jacobs2018) presents an analysis on the basis of which the Netherlands government recently decided to set MCF = 1 in social cost–benefit analyses, apparently on the grounds that the distortionary costs of taxation are for practical purposes offset by taxation’s role in reducing inequality. Moore et al. (Reference Moore, Boardman and Vining2013b) also argue that: “… as a first approximation, the main effect of engaging in a government project will be to reduce private consumption, not investment, making shadow pricing largely unnecessary.” Creedy and Passi (Reference Creedy and Passi2017), from a New Zealand Treasury perspective, also suggest that taxes on consumption impose no significant further social cost.
It is sometimes suggested that the distortionary effects of public fund raising might be de minimis at the margin; but it might be expected that, on the contrary, adverse impacts per marginal dollar exceed those of the average dollar.
It is occasionally suggested by practitioners that public agency budget constraints may arise from enduring political short termism, rather than the cost of public fundraising. But for policy or project appraisal, the reasons for the budget constraint are immaterial. It is the constraint itself that creates the MCF.
Some governments have explicit MCF values. However, it appears (O’Callaghan & Prior, Reference O’Callaghan and Prior2018) that these values are always equal to or between 1.2 and 1.3, or sometimes 1.0. It seems likely that, in most developed economies, the MCF is often closer to 2 than to 1 and that these much lower figures reflect political constraints. Application of an analytically defensible operational figure for such a complex and politically sensitive concept may rarely if ever be feasible.
As noted above, one way to handle the MCF in CBAs with an STP discount rate is to rank options by benefit/cost ratio of consumption benefits divided by public spending.
5 “Like with like” comparisons and problems of framing
The first two paragraphs of Section 3 outline how the STP and SOC paradigms frame the cost of public funds and time preference. The “like with like” simplification, discussed below, illustrates sharply how such different framing can affect perceptions of how social discounting should be applied. This is followed by a wider discussion of the framing issue.
5.1 “Like with like” comparisons
It is not uncommon for comparisons to be made between alternative streams of public spending. In this case, within the STP framing, options can be compared on the basis of their NPVs alone, with no MCF adjustment, as set out algebraically in the box below.
The issue first emerged in the late 1960s. It is recorded as a small item in Arrow and Kurtz (Reference Arrow and Kurtz1970, p. xxv). Feldstein (Reference Feldstein1970) developed the issue, but that article, among “Notes and Memoranda” in a British Journal, drew little comment at the time. Feldstein does, however, well summarizes the issue’s breadth of practical application, noting that: “in an important special class of expenditure decisions the problem of evaluating the social opportunity cost of funds transferred from the private sector can be ignored; in these cases only the social time preference rate is relevant.” This class of decisions is described as “the choice among alternative techniques of producing a given output when project expenditures are equal or proportional to the social costs of the resources used. The most obvious examples include the degree of capital intensity, the planned durability of equipment, the timing of replacements and maintenance, the choice of fuels and materials, and other specific aspects of the choice of technique.”
Such examples are not uncommon. In some developed economies, they may be more common than CBA. The fields of public policy, such as transport and environmental spending, where consumption-equivalent valuation of the main benefits is often feasible, are still fairly limited, and even within those fields “like with like” options still need to be compared.
The “like with like” simplification.
Suppose that the opportunity cost of $1 of public spending is a stream of forgone consumption with an internal rate of return of 8 %. And suppose that the present value in consumption dollars of this return on $1 of public spending, discounted at an STP rate r, is $mcf.
At a base date t 0, the NPV, in consumption dollars, of a public expenditure cost of $C in year t 1, followed by a public expenditure cost saving of $B in year t 2, would be.
 $ mcf\times \left\{{\frac{B}{\left(1+r\right)}}^{t_2-{t}_0}-{\frac{C}{\left(1+r\right)}}^{t_1-{t}_0}\right\}. $
The value of mcf may be unknown. But it can be assumed for most practical purposes that it is constant over time. It therefore does not affect the ranking of alternative options of this kind, whatever the values and time distributions of B and C.
The simplification assumes no constraints on what alternative uses could or would be made of marginal public funds, except that, in general, what is assumed for year t 1 can also be assumed for any year t 2.
Within the STP framing, this seems fairly straightforward, but not so within the SOC framing.
The simplification was described later, with less understanding than in Feldstein (Reference Feldstein1970), in Bradford (Reference Bradford1975). B&Z 2011 responds to Bradford, explaining that: “Bradford ( Reference Bradford1975) argued that for projects whose costs displace investment in the same proportion as the benefits induce investment, the appropriate discount rate is the STP rate with no need to shadow price benefits or costs. However, his result depends upon two critical assumptions.”
One of the two critical assumptions ascribed to Bradford is that “investments in the private sector are not feasible options for the government, because otherwise scarce resources should be invested in such projects rather than in any project that can pass muster only at the STP rate.” But this is not an assumption in the “like with like” simplification, which includes no constraints on feasible options for government (except that they do not change over time in a significant and reliably forecastable way).
The second critical assumption ascribed to Bradford is that “private sector … saving is not governed by optimizing behavior but rather by a simple rule of thumb whereby a constant proportion of (disposable) income is saved independent of the rate of return.” Bradford states this in its Introduction, but again this does not fully recognize the power of the simplification. Marginal public spending may have long-term impacts on variables such as growth rates, interest rates, and savings rates. These will affect the MCF. They are not, however, relevant to the “like with like” simplification (unless, as above, they change over time in a significant and reliably forecastable way).
Feldstein (Reference Feldstein1970) addresses the MCF only in terms of displaced private saving and investment, as was the normal convention at that time. This cost is now seen in wider terms, as noted in Section 4.1. However, this wider perception of the MCF is still likely to remain constant or change only slowly over time.Footnote 14 And changes will generally be impossible to forecast with useful precision.
B&Z 2011 also suggest that “Even if private sector investments are off limits for the government, whenever there is public debt outstanding debt reduction is always an option and the rate of return on debt reduction is the SOC rate.” This illustrates the difficulty of working through the simplification with the cost of public funds expressed as a rate of return.
The question posed is: “How can it be cost effective for the government to spend $C in year 0 to save just over $C(1 + r) dollars of public spending in year 1, where r is an STP rate, when it could use the $C dollars in year 0 to reduce government debt, which would yield a rate of return at a (much higher) SOC rate?” The answer is that a $C(1 + r) saving in year 1 could also be used to yield the SOC rate. The stream of potential benefits lost by spending $C and that from saving $C(1 + r) a year later, discounted to any baseline year at r, have the same present value (of opposite signs). If the saving exceeds $C(1 + r), there is a net benefit.
This can be strongly counterintuitive if the cost of public spending and time preference are not separated.
“Like with like” comparison, where all the costs and benefits are financial, is similar in the public and private sectors, but not exactly the same. The private sector is likely to use an appropriate financial cost of capital. But an SDR is not a “social cost of capital” to the government, in the way that a private enterprise faces debt and equity obligations that it has to service. The public sector will ideally compare like with like over time at a STP rate. This will normally be a little higher than the government’s financial cost of capital. This reflects the costs of debt beyond the interest cost, as noted in Appendix A.1, which for a substantial investment will also be considered in a private enterprise.
5.2 Problems of framing
Common features of the SOC paradigm include a presentational focus on “investment” rather than “public spending” and on the SDR as a “cost,” in much the same way as the application a financial “cost of capital” discount rate in private sector appraisal.Footnote 15 The paradigm’s insistence on framing the cost of public funding as a rate of return rather than a ratio (of the value of public spending dollars to the value of consumption dollars) is very firm.
This framing works well for many CBAs, where an initial public investment is followed by a stream of benefits concentrated over a few decades. It works less well for “like with like” comparisons as discussed above, or for unusual patterns of cost and benefit (such a nuclear plant, with high construction costs followed by a stream of benefits, followed in turn by high decommissioning and waste disposal costs), or for the very long term (where as illustrated in Table 1 the implied MCF ratio becomes implausibly high).
Burgess (Reference Burgess2018) defends SOC discounting over the very long term, arguing that it would be wrong to sacrifice $50 million today to obtain a $1 billion benefit in 50 years because, used instead to pay down government debt, the $50 million would deliver (after compounding at 7% per year) a $1.47 billion benefit. But this is debatable. It is plausible that the funding of an increase in public spending costs a loss of consumption over subsequent years with an internal rate of return of 7%. It is also plausible that some of this loss continues indefinitely. But it cannot continue to grow indefinitely at an exponential rate faster than the economic growth rate. Nor does it seem plausible that the social cost of funding a public expenditure depends materially on the timing of the benefits that the expenditure generates. Such concerns (as well as separate arguments for declining long run rates) perhaps explain why STP discounting is now the norm for very long-term analysis.
A less significant anomaly arises in the comparison of public expenditures (discounted at an SOC rate) with non-pecuniary benefits (discounted, as approved in the SOC paradigm) at an STP rate. Public expenditure dollars will in this case, year by year, be given less and less weight relative to consumption dollars. This is not easily justified.
6 Risk
6.1 Downside risks
The most conspicuous risks in public and private sector projects are those of cost and time overruns, or poor technical performance or demand. However, risks of this kind will normally be reflected only weakly if at all in public or private sector discount rates. They need to be addressed in other ways.
More relevant to discount rates are non-project-specific risks, such as wars or other disasters. These are implicitly included in private sector and hence SOC discount rates and to some extent in “risk free” bond or bill rates. With an STP rate, they need to be explicitly addressed.
The importance of “rare disasters” has been studied extensively by Barro (Reference Barro2009, Reference Barro2015) as a potential contributor to the equity risk premium and to public sector discount rates. In France, this work contributes to SDR risk premiums. A more pragmatic handling of such risks is discussed in Appendix A.2.
Barro’s work on social discounting is an extension of a wide, long standing debate, discussed below, on social discounting and the covariance of public service benefits with financial markets or with consumption.
6.2 Systematic risk
Sections 3, 4, 5, and 6.1 complete this article’s main comparative review of the SOC and STP paradigms. Section 6.2 enters different (financial and behavioral) economics territory and draws on the literature on systematic risk in regimes using STP or RFIR discounting.
It does feed across to the SOC paradigm in one way, but this is recorded here for passing interest, not as a contribution to the SOC/STP debate. One element of an SOC discount rate is the loss of returns from private sector investment, including a significant element of returns to equity. But most return to equity is premiums to compensate investors for the systematic variability risk that they face. This is not the loss of a net social benefit. It would, however, seem doubly unhelpful to criticize the SOC paradigm on this account. There are distorting effects of taxation and disbenefits of government debt that fall outside the conventional SOC derivation and it seems that included and excluded impacts together conspire to give SOC rates that are satisfactory for many CBA cost and benefit time profiles. In any case, as discussed in Section 6.4 below, the issue is already subject to extensive and inconclusive debate.
6.3 Social discounting and covariance with income
From the early days of cost–benefit analysis (CBA), it was recognized that in some projects (such a development project providing more food specifically in times of poor harvests), the covariance between benefits and beneficiaries’ incomes may be important (Little & Mirrlees, Reference Little and Mirrlees1974). But this was for many years seen as something that was rarely important in public project appraisal in developed economies. Arrow and Lind (Reference Arrow and Lind1970) notoriously commented that “It is sometimes argued that the returns from public investments are highly correlated with other components of national income through the business cycle. However, if we assume that stabilization policies are successful, then this difficulty does not arise.” This dismissed the issue too casually.
Nonetheless, systematic variabilities in public service benefits rarely affect individual users’ financial wealth. No less important from a behavioral perspective, their welfare impacts are generally not consciously perceived.
If expressed as a discount rate premium this conventional “risk aversion” to costs or benefits that vary in proportion to income, is given by ησ 2, where σ is the proportional standard deviation of the income growth rate and the elasticity η is as defined in Appendix A.2.
Gollier (Reference Gollier2013, table 3.2) presents values of σ for five developed countries for 1969–2010, ranging from 1.74% (USA) to 2.21% (Japan). These figures, together with a range of values for η of 1–2, imply a discount rate adjustment for such costs or benefits of no more than about 0.05–0.1%. Percentage fluctuations of twice that of income would imply a discount rate premium of no more than about 0.1–0.2%. Incorporation of such costs into an STP rate is noted in Appendix A.2.
6.4 Social discounting and financial market risk premiums
A steady flow of literature in the late 1980s and 1990s, mainly from the UK where private financing of public infrastructure was slowly increasing, and largely from business schools (e.g., Brealey et al., Reference Brealey, Cooper and Habib1997), argued that, in a competitive market, the financing cost revealed by the market is the social cost of financing the activity in question: public financing could not reduce this. Thus publicly financed projects should be appraised as if they were privately financed and the consumption-equivalent benefits were financial returns to the investors. The argument still continues more widely. CEA (2017) cites Lucas (Reference Lucas2014). Explicit systematic risk premiums based on financial market data are used by several governments in setting SDRs, as noted in Section 2. However, the argument is generally asserted as self-evident, with no explanation of where such an equity risk premium might fall on a publicly financed activity. Most authorities applying STP regimes appear to see equity risk premiums as mainly specific to private equity financing.
In recent years, the argument has leant increasingly on the consumption capital asset pricing model (CCAPM); e.g., Gollier, Reference Gollier2013). However, the CCAPM beta, like the CAPM beta, is conventionally multiplied by the financial market risk premium.Footnote 16 As the consumption beta of public service benefits can be high, this can lead to substantial estimated risk premiums.
An important development from 30 years ago in the analysis of financial markets is Epstein-Zin/Weil preferences (Epstein & Zin, Reference Epstein and Zin1989; Weil, Reference Weil1990). This framework, by using a recursive specification for utility as a function of consumption over time, separates risk aversion from time preference and is widely used in monetary and macro analysis, as in Pariès and Loublier (Reference Pariès and Loublier2010) and by Barro (Reference Barro2015), as cited in Section 6.1 above. It derives an estimate of the intertemporal elasticity of substitution, which under certain assumptions is the reciprocal of the elasticity of marginal utility of consumption used, as described in Appendix A.2, in the conventional derivation of STP. However, values derived in this way vary widely.
Equity risk premiums are much higher (the “equity premium puzzle”) than would be implied by conventional “risk aversion” to the decline of marginal utility with income. Benartzi and Thaler (Reference Benartzi and Thaler1995) proposes a behavioral explanation of the puzzle, based on equity investors’ “loss aversion.”Footnote 17 This cost would not generally apply to public financing. Indeed, there appears to be no plausible explanation of the puzzle that would also apply to public financing.
Debate on the contribution of financial market data to costing systematic risk in publicly financed projects continues, but many finance ministries may continue to doubt its practical relevance.
7 Conclusions
Section 7.1 summarizes the main technical arguments of this article. Section 7.2 reflects on future prospects and the complexities of implementation.
7.1 Analytical conclusions
Conclusions (i), (ii), and (iii) summarize how the MCF is defined in this article.
(i) The distinction between capital and current public spending is important in public expenditure management. But in a developed economy, the social cost of $1 of public funding does not generally depend on the dollar’s subsequent public expenditure accounting classification.
(ii) A marginal dollar of taxation generates a stream of lost consumption. When discounted at the rate of STP, this provides a ratio (≥1) of the value of public spending dollars to the value of consumption dollars. This ratio is described in this article as the MCF. The stream of lost consumption may continue to grow in perpetuity, but it cannot grow indefinitely at a rate higher than the growth rate of the national economy. Thus so long as the STP rate exceeds the expected long-term growth rate (as will almost always be the case), the present value of the MCF is finite.
(iii) Valuing this MCF precisely in this way for operational use may often not be feasible. It can, however, generally be taken as a working assumption that the MCF will be constant over time.
Conclusions (iv), (v), and (vi) are practical implications.
(iv) In “like with like” analysis, where public spending is being appraised against public expenditure savings (or consumption against consumption), the costs and benefits differ only in their timing. It follows that the STP discount rate is appropriate for ranking such options. (This is long established, but counterintuitive if time preference and the social cost of public funds are not separately identified.)
(v) STP discounting is also appropriate for time preference in CBA, where public spending is being appraised against benefits valued in consumption-dollars. However, if public spending dollars carry more weight than consumption dollars, it is misleading, with STP discounting, to add them together to obtain an NPV. One mechanism for incorporating the MCF in CBA with STP discounting is to rank options by their benefit/cost ratios, with net spending from the constrained budget as the denominator.
(vi) The SOC discounting alternative of applying a higher discount rate and calculating NPVs compares many CBA options satisfactorily, and probably better than STP discounting without due regard for the MCF.
Conclusion (vii) addresses the relevance to STP discounting of the equity market-risk premium.
(vii) A strand of literature has long argued that the equity risk premiums observed with private financing apply also to the social cost of public financing. A recent variant, accepted by some finance ministries, applies the Consumption CAPM. The consumption betas of public service projects can be high and multiplying these by a financial market risk premium (as in the CCAPM) can imply a high cost of systematic risk. There does not however appear to be persuasive evidence that a financial market risk premium is relevant to public financing. When estimated instead from a conventional index of relative risk aversion the premium is normally no more than a small fraction of a percentage point.
Conclusions (viii) and (ix) address the main merits and problems of SOC and STP regimes.
(viii) The SOC paradigm has the strong advantage (for many CBAs) that it is simpler to apply than an STP regime. It is also much easier to present to most audiences. And it can be derived from hard, official data. However, even if a SOC as an annual percentage rate is accurately estimated, the implied MCF (the consumption-equivalent value of $1 of public spending) depends upon the time profile of the relevant costs and benefits. An SOC discount rate can therefore be satisfactory for many CBAs, but less so if the benefits are concentrated over more than a few decades following an initial public investment. SOC discounting is not well suited to “like with like” analysis, nor the analysis of many special cases: it will for example overstate the case for private financing of public services.Footnote 18
(ix) STP discounting is appropriate for “like with like” comparisons over time. It is also adaptable to the analysis of special cases such as those illustrated in Appendix B. But it has the serious disadvantage of requiring, for CBA, explicit recognition of the MCF. This can be handled by the use of benefit/cost ratios, with constrained funding in the denominator. However, SOC advocates are correct in claiming that STP regimes often overlook the MCF.
7.2 Future prospects and implementation
SDRs in developed countries are typically set by sporadic reviews, whose outcome may depend on the background of the most influential contributors and be subject to political and institutional pressures or constraints. They often expose unresolvable disagreements. Some economists are confident that an SOC framing is socially optimal, others that STP is the optimal basis, although not always with clarity on handling the MCF. Strong convictions can be held on issues such as the legitimacy of a rate that includes an element of ethical judgment, the cost of systematic risk in public service benefits, or the magnitude of other components of an STP rate. It seems unlikely that much consensus on such issues will soon emerge. International practice is thus likely to remain very varied. There is, however, scope for wider understanding across this field of political economy, which is more complex (and interesting) than is often recognized.
As a practical approach to social discounting, under exceptional political and institutional constraints, the U.S. Office of Management Budget guidance is a thoughtful and structurally sophisticated, if sometimes brutally pragmatic example. Its internal contradictions and crude approximations and compromises suggest multiple authorship and severe institutional constraints. But it may be as sound as could be achieved in that context.
However, for a developed economy with a strong central finance ministry, the best compromise between analytical rigor and practicality might often be an STP SDR, with provisions to ensure that CBA options (comparing public spending with consumption benefits) are compared in terms of their ratios of consumption benefits to public spending, and not as NPVs. An STP rate would be straightforward for “like with like” analysis, and amenable to assessing special cases such as those involving both private financing and public funding.
If this is not feasible, the US OMB case offers examples for intermediate regimes, such as using an SOC discount rate for routine CBA, an STP rate for “like with like” analysis, and a government borrowing rate, or an STP rate, for comparing public and private financing of a public service.
There is a case for more research on the social cost of covariance of public service project consumption benefits with income. This needs, however, to bridge financial, welfare, and behavioral economics. The case for more research on the MCF (beyond the impacts of specific taxes) seems weak despite its importance, because of the extreme diversity of taxes and their impacts, and the political dimension.
Appendix A The estimation of STP
A.1 Social versus personal time preference
The literature on direct measurement of personal time preference is confused (Frederick et al., Reference Frederick, Loewenstein and O'Donoghue2002). Nonetheless, financial markets, especially government debt, are taken by some governments as a measure of STP. This is “revealed preference” data, which some experts see as an inherently superior basis for policymaking, as opposed to data that includes professional or ethical judgment. It is also relatively easy to measure and to present. However, the literature, including CEA (2017), notes a number of concerns. These include the wide variations in people’s borrowing and saving rates, the distinction between personal and intergenerational preferences, the absence of long-term risk-free market rates, and the strong effects on market interest rates, sometimes over long periods, of factors unrelated to people’s time preference for consumption.
Also, the holding of financial assets increased security and flexibility, for an individual, a firm, or a nation, and conversely for debt. Thus, risk-free borrowing rates may be at best downwardly biased estimates, or lower limits, for STP.
A.2 The conventional estimation of STP
STP is most conventionally expressed as the sum of two components in the Ramsey equation: STP = δ + ηg, where δ is time preference for utility, g is the growth rate of per capita income, and η is the elasticity of marginal utility.Footnote 19
STP for marginal utility, δ.
The element δ is generally seen as the sum of small elements for risk and perhaps a “pure time preference.”
On risk, Martin Rees, the UK Astronomer Royal, has written that “I think the odds are no better than fifty-fifty that our present civilisation on Earth will survive to the end of the present century” Rees (Reference Rees2003). This would imply a contribution to the SDR of 0.8% per year. Practitioners might also consider two further risks.
(i) Potential impacts that are unlikely to have been otherwise considered during even a well-conducted appraisal—such as the termination of German nuclear power generation following the 2011 Fukushima tsunami.
(ii) Income-covariant risk, as discussed in Section 6.2.
These three factors combined may suggest a premium in δ for risk in the region of 1%, with little reason to add the complexity of differentiation between types of project.
On pure time preference, CEA (2017) records that “Expert disagreement … is especially fierce.” Many academic authorities see no ethical case for giving less weight to expected future marginal utility. Economists in government tend to see the issue more in terms of the likely informed preferences of the population they are serving, perhaps implying a slow decline over time as increasingly distant future populations command less empathy.Footnote 20
The decline in marginal utility of consumption as per capita income increases.
The term cu″(c)/u′(c), where c is consumption and u(c) is utility, defines (normally with sign reversed to make it positive) the elasticity of marginal utility of consumption. This meaning, here denoted by η, seems appropriate for deriving an STP discount rate.
However, the term is best known in textbooks as the Arrow-Pratt measure (or index, or coefficient) of relative risk-aversion. It is also presented as an index of inequality aversion and as the reciprocal of the elasticity of intertemporal substitution.
These concepts all have uses. Atkinson et al. (Reference Atkinson, Dietz, Helgeson, Hepburn and Hakon2009) usefully discusses the first three. But the relevance of each depends on the context. Human preferences seem too complex to justify supposing that a value chosen for one concept in one context provides a robust estimate for all others. The literature often presents the term in the STP context as a measure of risk aversion or of inequality aversion, implying some value judgment. But practitioners appear mostly to see it as no more than a value-free estimate of the elasticity of marginal utility.
Many methods have been used to estimate η. Some of the more plausible are well presented in Groom and Maddison (Reference Groom and Maddison2019). Estimates have generally converged over recent decades to between 1 and 2.
Appendix B Some special cases
Some cases may be handled more readily within an STP than an SOC framework.
B.1 The very long term and climate change
A compelling argument for applying a declining SDR over the very long term is that, if the weighted average present value of a dollar is calculated forever more-distant future years, for a plausible range of rates, the effective discount rate falls ever closer to the lower end of the range. Netherlands guidance, however, maintains a constant discount rate over time, explaining that the RFIR element in their “high-risk premium” SDR is today exceptionally low, and that “the same factor that causes the risk-free interest rate to fall could also explain an increase in the [market] risk premium” (van Ewijk & Tang, Reference van Ewijk and Tang2003, Werkgroep discontovoet, 2015).
An account of the complex history of academic debate on the long term is set out in Gollier and Hammitt (Reference Gollier and Hammitt2014). That article also sets out a “high-risk premium” approach to the SDR, with, however, numerical conclusions similar to those of a conventional STP approach.
Very long-term climate change analysis rarely if ever explicitly incorporates an MCF. However, these analyses are rarely comparing public spending with consumption benefits and their concerns are often with orders of magnitude. It may be a modest exception with respect to systematic risk. Dietz et al. (Reference Dietz, Gollier and Kessler2018) derive for projected, very long-term variances in income and climate change impact a relatively high-risk premium of about 0.6%.
In practice, many long-term issues may be better presented to policymakers in terms of scientific and political analysis than by present values.
The discount rate can, however, have a large impact on “the cost of carbon” when this is derived from future damage costs (as in the USA), rather than (as now in the UK) the marginal abatement costs of achieving a chosen level of decarbonization.
B.2 Social discounting of project-specific private financing
Private financing costs in social CBA are normally subsumed in the market prices of goods and services. They do, however, need to be explicitly addressed where:
(i) a new regulation would require significant investment by the private sector;
(ii) a comparison is made between public and private financing of a public service.
In the first case, the private financing costs over the accounting life of the project can be broadly estimated and discounted at an STP rate. If the private weighted average cost of capital exceeds the STP rate, this will give a social cost greater than the asset capital cost. This technique is now used by UK regulators (Joint Regulators Group, 2012).
The second case involves three percentage rates: a public cost of capital, a private cost of capital, and an STP rate. A rigorous approach would apply the logic described for regulatory analysis to both public and private financing costs. It is, however, unlikely that any government could routinely maintain such a complex regime.
One simpler approach is to discount the real cash costs of both the private financing option and the public finance alternative at a government-borrowing rate. This would follow recent U.S. OMB guidance. It was also advocated by UK Treasury accountants in the early 1970s, when the general discounting regime was SOC. This will bias the comparison slightly against private financing. Alternatively, discounting these same costs at an STP rate will normally bias in favor of private financing.
B.3 Discounting health (and other changing relative prices)
Some impacts increase in real unit value predictably over time. Some may be valued accordingly and discounted in the normal way. Or it may be simpler to maintain “today’s” real value and to discount at a lower rate, as noted in Werkgroep discontovoet (2015) for environmental benefits or travel time. This may be preferable especially if monetary valuation is contentious, as perhaps with the quality adjusted life year (QALY). It may be simplest to work in costs per QALY and to discount QALYs at an appropriately reduced rate.
However, a lower discount rate for benefits than for costs can seem to imply that a project should always be postponed. It has long been noted that, if the earlier option has a higher BCR than other options for spending at that time, it should still take priority (Parsonage & Neuberger, Reference Parsonage and Neuberger1992). Nonetheless, the paradox, named after Keeler and Cretin (Reference Keeler and Cretin1983), is still used as one argument against discounting financial costs and QALYs at a lower rate.
Health economics has also generated other arguments for discounting health costs and/or benefits at rates different from those applied to public spending programs generally. One still inconclusive debate is portrayed in Claxton et al. (Reference Claxton, Paulden, Gravelle, Brouwer and Culyer2011) and a “non-conventional” approach is developed in Paulden and Claxton (Reference Paulden and Claxton2012). However, the case for social discounting conventions for health differing from those for other public spending programs remains contentious.
Acknowledgments:
This article draws on invaluable comments and advice from Professors Ben Groom and Simon Dietz of the London School of Economics and from Hugh Batrouney, previously of the Department of Economic Development, Jobs, Transport, and Resources in Victoria, Australia. It also owes much to the advice of two referees. However, the views expressed and errors and omissions are those of the author alone.