Implications
The livestock model LiGAPS-Beef (Livestock simulator for Generic analysis of Animal Production Systems – Beef cattle) is designed to estimate potential (i.e. theoretical maximum) and feed-limited production of beef cattle, and to identify factors that define and limit cattle growth in different beef production systems across the globe. This paper evaluates LiGAPS-Beef and demonstrates that its estimates for growth of cattle are reasonably accurate for beef production systems in Australia, Uruguay and the Netherlands. LiGAPS-Beef also identifies when the bio-physical factors genotype and climate define growth, and when feed quality and quantity limit growth. Hence, the model may contribute to insights in how to increase beef production in a sustainable manner.
Introduction
Population growth and increasing wealth will drive future demand for food products in general, and for animal-source food in particular. This is likely to put more pressure on scarce land, water and energy. Moreover, using land and resources for agriculture also results in negative impacts on the environment (Godfray et al., Reference Godfray, Beddington, Crute, Haddad, Lawrence, Muir, Pretty, Robinson, Thomas and Toulmin2010). Sustainable food production, therefore, requires enhanced resource use efficiency and mitigation of environmental impacts (Herrero and Thornton, Reference Herrero and Thornton2013). A pathway to supply food to an increasing world population is sustainable intensification, which is defined as reducing environmental impacts while simultaneously increasing the production of food per unit land (Godfray et al., Reference Godfray, Beddington, Crute, Haddad, Lawrence, Muir, Pretty, Robinson, Thomas and Toulmin2010).
Regions with high scope for sustainable intensification are those displaying a large yield gap. The latter is defined as the difference between the potential (i.e. theoretical maximum) or limited production and the actual production (Van Ittersum et al., Reference Van Ittersum, Cassman, Grassini, Wolf, Tittonell and Hochman2013). Quantification of potential and limited production in crops is generally conducted with mechanistic crop growth models (Van Ittersum et al., Reference Van Ittersum, Cassman, Grassini, Wolf, Tittonell and Hochman2013). These models are based on concepts of production ecology, and their use is well-established in crop science (Van Ittersum and Rabbinge, Reference Van Ittersum and Rabbinge1997; Jones et al., Reference Jones, Hoogenboom, Porter, Boote, Batchelor, Hunt, Wilkens, Singh, Gijsman and Ritchie2003; Keating et al., Reference Keating, Carberry, Hammer, Probert, Robertson, Holzworth, Huth, Hargreaves, Meinke, Hochman, McLean, Verburg, Snow, Dimes, Silburn, Wang, Brown, Bristow, Asseng, Chapman, McCown, Freebairn and Smith2003). Such models also identify the factors that define and limit crop growth. This identification provides insight in the options to mitigate yield gaps and to improve production or resource use efficiency (Van Ittersum et al., Reference Van Ittersum, Cassman, Grassini, Wolf, Tittonell and Hochman2013). Still, models based on concepts of production ecology have not been developed for livestock production, except for LIVSIM (LIVestock SIMulator; Rufino et al., Reference Rufino, Herrero, Van Wijk, Hemerik, De Ridder and Giller2009).
For this reason, we developed a mechanistic livestock model for beef cattle, LiGAPS-Beef (Van der Linden et al., Reference Van der Linden, Van de Ven, Oosting, Van Ittersum and De Boer2018a and Reference Van der Linden, Van de Ven, Oosting, Van Ittersum and De Boer2018b). LiGAPS-Beef aims to simulate potential and feed-limited growth and production of beef cattle in different farming systems across the world, and to identify the biophysical factors that define and limit growth. Beef production of a bovine animal is simulated by interconnected sub-models dealing with thermoregulation, feed intake and digestion, and energy and protein utilisation. Beef production at the herd level is assessed by upscaling from individual animals (i.e. the animal level) to a herd.
Model evaluation quantifies the accuracy of model results, and is essential for credibility and confidence that a model is appropriate for the aim it was designed for. Model evaluation is conducted by comparing results from model simulations with independent experimental data that have not been used for model calibration (Bellocchi et al., Reference Bellocchi, Rivington, Donatelli and Matthews2010). This process is also referred to as validation or model comparison, but here we adopt the term model evaluation. In a companion paper, model evaluation was already performed for the thermoregulation and the feed intake and digestion sub-models separately (Van der Linden et al., Reference Van der Linden, Van de Ven, Oosting, Van Ittersum and De Boer2018a).
The aim of this paper is to evaluate the complete model LiGAPS-Beef to investigate whether it simulates beef production in different systems across the world accurately, and whether it identifies the factors that define and limit growth and production of beef cattle. LiGAPS-Beef has been designed to simulate beef herds, and includes both productive animals (calves sold to fatteners or sold directly for slaughter) and reproductive animals (cows). Although LiGAPS-Beef has been designed to simulate beef production at the herd level, model evaluation was conducted at the animal level, because availability of data at the herd level was too limited to conduct a proper and meaningful evaluation.
Material and methods
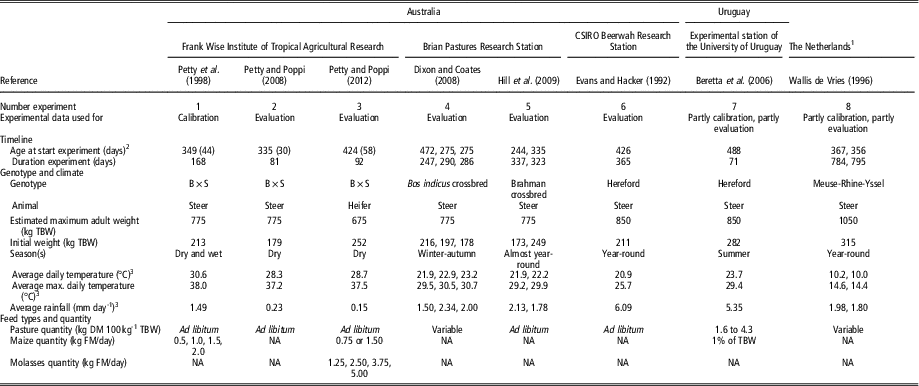
A detailed description of LiGAPS-Beef is provided in a companion paper (Van der Linden et al., Reference Van der Linden, Van de Ven, Oosting, Van Ittersum and De Boer2018b). Data for calibration and evaluation of LiGAPS-Beef were obtained from eight experiments in contrasting beef production systems, which have been reported in the scientific literature (Table 1). Six of the selected experiments were conducted in Australia (experiments 1 to 6), one in Uruguay (experiment 7) and one in the Netherlands (experiment 8). In each of these experiments, drinking water was assumed to be available ad libitum, and diseases and stress were assumed to be absent. Weighing occurred once per 2 weeks (experiments 1, 2, 3 and 7) up to once per 2 months (experiment 8). In addition, animals were treated with medicines in most experiments to prevent prevalent diseases. Mineral deficiencies were assumed to be absent in the experiments. If cattle were fasted prior to weighing, we assumed that 10% of total BW (TBW) was lost during the fasting period, which is equal to the full rumen content in LiGAPS-Beef.
Model input used for calibration and evaluation of LiGAPS-Beef (Livestock simulator for Generic analysis of Animal Production Systems – Beef cattle)

B×S=¾ Brahman × ¼ Shorthorn; TBW=total BW; NA=not applicable; DM=dry matter; FM=fresh matter.
Experiments are numbered for reference in the text.
1 The experiment in the Netherlands is not conducted at a research station. The second value in this column indicates data for Karshoek, if deviating from the other two nature areas.
2 Values between brackets indicate the duration of the adaptation phase (days) before the start of the experiment.
3 Only for the experimental period; the adaptation period is not included.
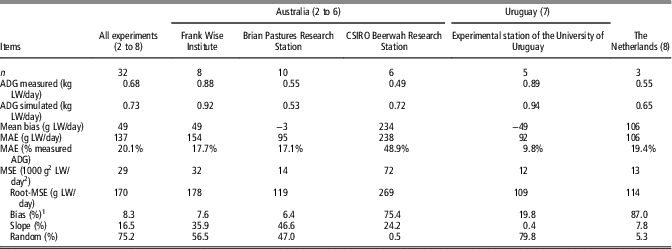
The eight experiments contain data on 38 treatments, which were split up in a data set for calibration (seven treatments) and a data set for evaluation (31 treatments). Each of the three countries and each of the three breeds used in the experiments was represented in the data set for calibration. During calibration, unknown and uncertain parameters were adjusted to equal the simulated and measured average daily gain (ADG). Model evaluation was conducted by comparing the simulated and measured ADGs. Model performance is reflected in the mean absolute error (MAE, equation (1)), the mean square error (MSE) and the root mean square error (RMSE) (equation (2)) (Bennett et al., Reference Bennett, Croke, Guariso, Guillaume, Hamilton, Jakeman, Marsili-Libelli, Newham, Norton, Perrin, Pierce, Robson, Seppelt, Voinov, Fath and Andreassian2013). The MSE was decomposed into the bias, slope and random components (Bibby and Toutenburg, Reference Bibby and Toutenburg1977), expressed as errors in central tendency, errors due to regression and errors due to unexplained variance, respectively.
 $$\hskip-11pt{\rm MAE}{\equals}{{\mathop{\sum}{\left| {{\rm O}-{\rm S}} \right|} } \over {\rm n}}$$
 $${\rm RMSE}{\equals} \sqrt {{{\mathop{\sum}{\left( {{\rm O}-{\rm S}} \right)^{2} } } \over {\rm n}}} $$
where O is the observed value, S the simulated value and n the number of observations. Factors that define growth are cattle genotype, or breed, and climate via heat and cold stress (Van de Ven et al., Reference Van de Ven, de Ridder, van Keulen and van Ittersum2003; Van der Linden et al., Reference Van der Linden, Oosting, Van de Ven, De Boer and Van Ittersum2015). Feed quality and quantity are factors that can limit growth in LiGAPS-Beef due to a lack of digestive capacity, energy deficiency or protein deficiency (Van der Linden et al., Reference Van der Linden, Van de Ven, Oosting, Van Ittersum and De Boer2018b). The defining factors determine the simulated ADGs under potential production in LiGAPS-Beef, whereas the defining and limiting factors jointly determine the simulated ADGs under feed-limited production (Van der Linden et al., Reference Van der Linden, Van de Ven, Oosting, Van Ittersum and De Boer2018b). Identification which of these factors contribute most to yield gaps is key to reveal options for yield gap mitigation (Van Ittersum et al., Reference Van Ittersum, Cassman, Grassini, Wolf, Tittonell and Hochman2013). Resemblance of the reported and the simulated factors that define and limit growth provides evidence that LiGAPS-Beef can identify these factors. In the next sections, we describe the experiments conducted, the input data and model settings used to simulate the conditions in the experiments and the calibration procedures for each of the three countries.
Beef production in Australia
Experiments 1 to 3 were conducted at the Frank Wise Institute of Tropical Agricultural Research (Table 1). The Frank Wise Institute is located in the Ord river irrigation area in Western Australia (15.65°S, 128.72°E). The cattle breed was crossbred ¾ Brahman × ¼ Shorthorn (B×S). In experiment 2, steers were implanted with the hormonal growth promotant Compudose 200, which is known to increase growth by 25% (Frisch and Hunter, Reference Frisch and Hunter1990a), whereas in experiment 3 heifers were implanted with the hormonal growth promotant Synovex-H, which is known to increase growth by 26% (Frisch and Hunter, Reference Frisch and Hunter1990b). The climate is characterized by a dry and a wet season, with average temperatures of 26.2°C and 31.7°C, respectively (Petty et al., Reference Petty, Poppi and Triglone1998). Experiment 2 was conducted in the dry season. A treatment that mimicked the conditions of the wet season with irrigation was excluded from experiment 2, as this treatment might have influenced feed intake (Petty and Poppi, Reference Petty and Poppi2008). Cattle grazed irrigated pastures with leucaena (Leucaena leucocephala cv. Cunningham) and pangola grass (Digitaria eriantha cv. Steudel) in each of the experiments. Experiments 1 and 3 investigated effects of feed quality through supplementation of cracked maize, and experiment 3 also investigated supplementation of molasses. Feed was amply available during experiments 1 to 3 (Petty et al., Reference Petty, Poppi and Triglone1998; Petty and Poppi, Reference Petty and Poppi2012).
Weather data used for model simulations were obtained from the nearby Kimberley research station (15.65°S, 128.71°E). Maize was assumed to have a dry matter (DM) content of 85%. The maximum amount of energy for compensatory growth, determined by the animal genotype, was increased by 25% for steers in experiment 2 and 26% for heifers in experiment 3 to account for the effect of hormonal growth promotants. LiGAPS-Beef was calibrated by using all measured ADGs from experiment 1. The maximum adult weight and birth weight of B×S cattle were estimated during calibration. Since some pasture characteristics were unknown, the following parameters were calibrated to minimize the RMSE between simulated and measured ADGs: heat increment of feeding, fill units, soluble non-structural carbohydrates and the digestible NDF content. The ADGs from experiments 2 and 3 were used as independent data sets for model evaluation (Table 1).
Experiments 4 and 5 were conducted at the Brian Pastures Research Station, near Gaynah, Queensland (25.66°S, 151.75°E). Crossbred Bos indicus steers grazed on pastures with leucaena in experiment 4 (Dixon and Coates, Reference Dixon and Coates2008). Steers grazed on pastures with a mix of grasses, on pastures with grass and legumes, and on pastures with stylo (Stylosanthes seabrana) in experiment 5 (Hill et al., Reference Hill, Coates, Whitbread, Clem, Robertson and Pengelly2009). Feed availability was insufficient during some periods in experiment 4, whereas ample feed was available in experiment 5. The crossbred B. indicus cattle in experiments 4 and 5 were assumed to correspond to the B×S cattle used in experiments 1 to 3. Weather data were obtained from the Brian Pastures Research Station. Estimated intake by Dixon and Coates (Reference Dixon and Coates2008) was adopted as maximum feed intake in experiment 4, and feed intake was assumed to be ad libitum in experiment 5 (Hill et al., Reference Hill, Coates, Whitbread, Clem, Robertson and Pengelly2009). Feed quality over time (DM digestibility and CP) was adopted from Dixon and Coates (Reference Dixon and Coates2008) for experiment 4, and from Hill et al. (Reference Hill, Coates, Whitbread, Clem, Robertson and Pengelly2009) for experiment 5. Calibration was not conducted for experiments 4 and 5, so all measured ADGs were used for model evaluation (Table 1).
Experiment 6 was conducted at the CSIRO Beerwah Research Station in Queensland (26.83°S, 153.08°E) (Evans and Hacker, Reference Evans and Hacker1992). Hereford cattle grazed on pastures with six different grasses, including four varieties of Setaria sphacelata (var. splendida, and cvv. Nandi, Narok and Kazungula), pangola grass (Digitaria eriantha spp. pentzii), and kikuyu grass (Pennisetum clandestinum cv. Whittet). Feed availability exceeded animal requirements (Evans and Hacker, Reference Evans and Hacker1992; Hacker and Evans, Reference Hacker and Evans1992). Cattle were weighed after a period of 16 h without feed and water. The Hereford cattle in this experiment were assumed to be genetically the same as the Hereford cattle in experiment 7 (Uruguay). Weather data were obtained from the Beerwah Forest Station (26.86°S, 152.98°E). Data on feed quality dynamics (DM digestibility) were complete for steers grazing from September 1972 up to August 1973 in Evans and Hacker (Reference Evans and Hacker1992). Hence, simulations were conducted only for this period. All measured ADGs from experiment 6 were used for model evaluation (Table 1).
Beef production in Uruguay
Experiment 7 was conducted at the experimental station of the Agronomy Faculty of the University of Uruguay, which is located in Paysandú (32.33°S, 58.03°W). We used data for the year 2002. Hereford steers grazed improved pastures with fescue (Festuca arundinacea) and clover (Trifolium repens and T. pratense). Experiment 7 was conducted in summer, when ADG is lower than in winter (Beretta et al., Reference Beretta, Simeone, Elizalde and Baldi2006). Feed quality for half of the cattle was improved by supplementing cracked maize at 1% of the TBW per day, whereas the other half did not receive maize. The amount of pasture available was 3, 6 and 9 kg DM per 100 kg TBW, which resulted in a 2×3 factorial design with six treatments (Beretta et al., Reference Beretta, Simeone, Elizalde and Baldi2006).
Weather data used for model simulations were recorded at the experimental station. Estimated pasture intake by Beretta et al. (Reference Beretta, Simeone, Elizalde and Baldi2006) was adopted as maximum feed intake for experiment 7. The model was calibrated with the ADG of a single treatment with a pasture availability of 3 kg DM per 100 kg TBW per day without maize supplementation. The maximum adult weight and birth weight of Hereford cattle were estimated during calibration. Since some pasture characteristics were not available, the following characteristics were calibrated: heat increment of feeding, fill units, soluble non-structural carbohydrates and the digestible NDF content. The fill unit intake was multiplied with a factor accounting for the available biomass (Jouven et al., Reference Jouven, Agabriel and Baumont2008), and the energy requirement for grazing was calculated from the available biomass (Freer et al., Reference Freer, Moore and Donnelly1997). The other five treatments in Beretta et al. (Reference Beretta, Simeone, Elizalde and Baldi2006) were used for model evaluation.
Beef production in the Netherlands
Experiment 8 was conducted in three nature areas in the Netherlands: the Renkumse Benedenwaarden, a riverine nature area (51.97°N, 5.72°E); the Doorwerthse Heide, a heathland area (52.00°N, 5.78°E); and Karshoek, a mixed heathland-riverine nature area (52.53°N, 6.53°E). Experiment 8 was conducted with steers of the Meuse-Rhine-Yssel breed, and lasted for more than two years (Table 1). Analysis of bone material indicated that mineral deficiencies (Na and P) limited growth of cattle grazing permanently on the heathland. These cattle were excluded from the analysis, since LiGAPS-Beef does not account for mineral deficiencies (Van der Linden et al., Reference Van der Linden, Van de Ven, Oosting, Van Ittersum and De Boer2018b). The riverine and mixed heathland-riverine areas were each grazed by a group of steers. Another group of steers was kept in the riverine area during summer, and in the heathland area during winter (Wallis de Vries, Reference Wallis de Vries1996). Vegetation in the riverine area was dominated by perennial ryegrass (Lolium perenne), creeping bentgrass (Agrostis stolonifera) and couch grass (Elymus repens). Vegetation in the heathland area was dominated by heather (Calluna vulgaris) and wavy hairgrass (Deschampsia flexuosa). Cattle TBW, pasture intake and pasture quality were measured every 2 months during the experiment (Wallis de Vries, Reference Wallis de Vries1996).
Weather data used for model simulations were taken from nearby stations in Wageningen (51.97°N, 5.67°E) and Enschede (52.27°N, 6.90°E). Measured pasture quality and intake were used as model inputs. The reported feed intake was set as the maximum feed intake in LiGAPS-Beef. The maximum adult weight and birth weight of Meuse-Rhine-Yssel cattle were estimated during calibration. In addition, the energy requirements for locomotion and grazing in nature areas are expected to be higher than in the other experiments. LiGAPS-Beef was calibrated, therefore, by adjusting the parameter for net energy requirements for physical activity, which includes locomotion and grazing. Calibration was conducted in such a way that the simulated and measured TBW of animals in the riverine area were the same in the 7th month after the start of experiment 8. A period of 7 months was considered to be adequate for calibration of the model. The ADG in the rest of the experiment in the riverine area and in the two other nature areas were used for model evaluation.
Results
Model calibration
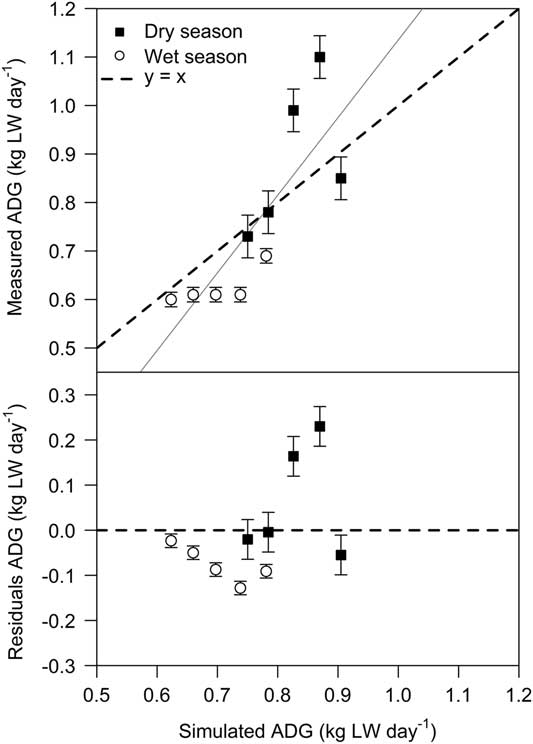
Calibration resulted in an MAE of 85 g live weight (LW)/day, or 11.3% of the mean measured ADGs in Australia in the dry and wet season (Figure 1). The RMSE was 109 g LW/day, or 14.4% of measured ADGs. The bias component of the MSE was 0%, the slope component was 22% and the random component 78%. The intercept of the regression line did not differ significantly from zero (P=0.17) and the slope did not differ significantly from one (P=0.09). The model underestimated ADG for two treatments with maize supplementation (1.0 and 1.5 kg fresh matter (FM) maize/head per day) in the dry season, but overestimated ADG for the highest level of maize supplementation (2.0 kg FM maize/head per day). Simulated and measured ADGs were equal for both Uruguay and the Netherlands, because calibration was conducted in such a way that the simulated ADG matched the measured ADG of a single experimental treatment (Supplementary Material S1, Figs S30 and S36).
Simulated and measured average daily gain (ADG) of beef cattle for the calibration dataset in Australia (experiment 1). Measured data are from Petty et al. (Reference Petty, Poppi and Triglone1998). Bars indicate standard errors. LW=live weight.

General model evaluation
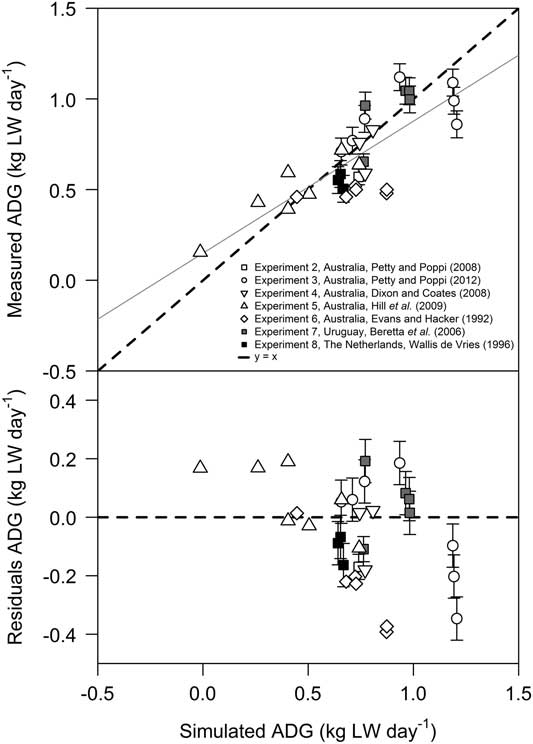
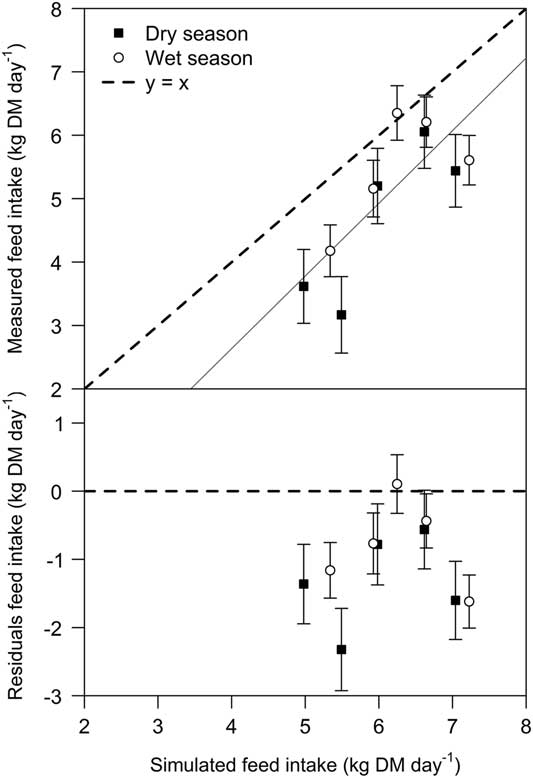
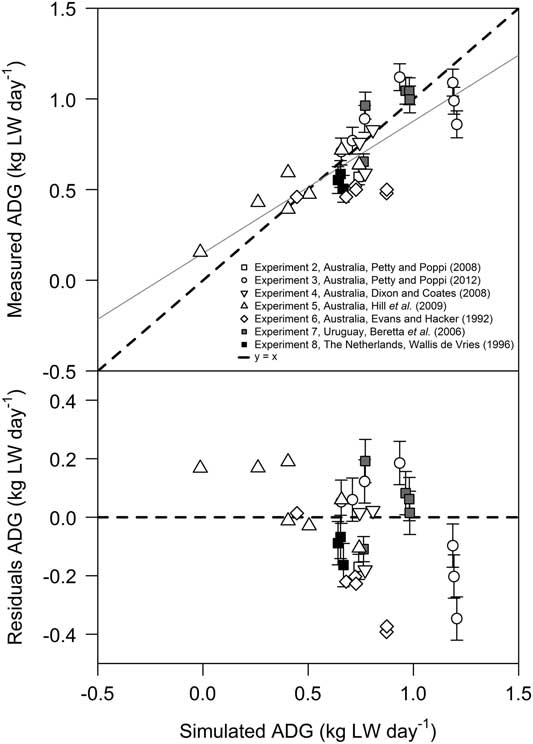
Model evaluation based on the independent datasets from Australia, Uruguay and the Netherlands resulted in an MAE of 137 g LW/day, or 20.1% of the mean measured ADG (Figure 2, Table 2). The RMSE was 170 g LW/day, or 25.0% of the mean measured ADG. The random component of the MSE accounted for 75% of the variation (Table 2). The regression line had an intercept not significantly different from zero (P=0.077), but its slope (0.73 kg LW/kg LW) was significantly different from one (P=0.008). So far, model evaluation was conducted only for ADGs, but it can be extended to feed intake, if measured in experiments. Evaluation of ad libitum simulated and measured pasture intake for the dry and wet season in experiment 1 indicated that LiGAPS-Beef overestimated measured pasture intake, especially at low intake levels (MAE = 1.05 kg DM/day, or 20.6% of the mean measured intake) (Figure 3). The bias component accounted for 71% of the MSE, the slope component for 1%, and the random component for 28%. The intercept and slope of the regression line between simulated and measured feed intake were not significantly different from zero (P=0.37) and one (P=0.34).
Simulated and measured average daily gain (ADG) of beef cattle in Australia, Uruguay and the Netherlands. Only independent experimental data sets for model evaluation are included. Bars indicate standard errors. LW=live weight.
Simulated and measured feed intake of beef cattle for the experiment of Petty et al. (Reference Petty, Poppi and Triglone1998), which is conducted in Australia (experiment 1). LiGAPS-Beef (Livestock simulator for Generic analysis of Animal Production Systems – Beef cattle) was calibrated with data on average daily gain from this experiment (Table 1). Bars indicate standard errors.

Statistical evaluation of LiGAPS-Beef (Livestock simulator for Generic analysis of Animal Production Systems – Beef cattle) simulating the average daily gain (ADG) of cattle in Australia, Uruguay and the Netherlands

LW=live weight; MAE=mean absolute error; MSE=mean square error; Bias=MSE decomposed into error due to overall bias of prediction; Slope=MSE decomposed into error due to deviation of the regression slope from unity; Random=MSE decomposed into error due to the random variation.
Values between brackets refer to the numbers of the experiments (Table 1).
Country-specific model evaluation
Australia
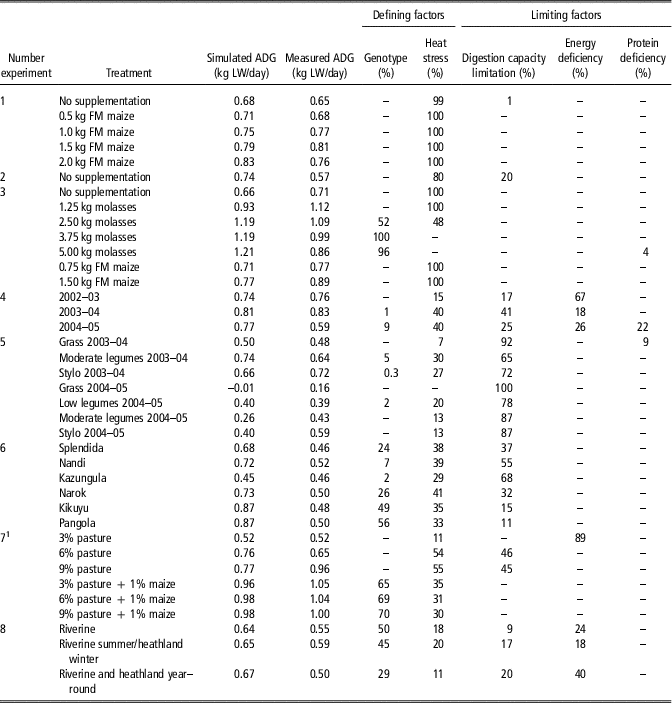
The MAE of simulated ADGs for B×S cattle in experiments 1 to 3 was 154 g LW/day, which equals 17.7% of the mean measured ADG (Table 2). Simulated ADGs were lowest if cattle had access to pasture only, without supplementation of maize or molasses. Increasing maize supplementation in experiments 1 and 3 resulted in increasing simulated ADGs (Table 3). Supplementation with 1.25 and 2.50 kg molasses per head per day in experiment 3 increased both simulated and measured ADGs compared to no supplementation. Providing more than 2.50 kg molasses did not increase simulated ADGs much further (Table 3). Heat stress was the factor that defined growth during large parts of experiment 3 according to LiGAPS-Beef, except if molasses was fed at 2.50 kg/head per day or more (Table 3). For these amounts of molasses, the genotype was a factor that defined growth, especially at supplementation of 3.75 kg molasses/head per day or higher. Protein deficiency only occurred in experiment 3 with 5.00 kg molasses (Table 3).
Defining and limiting factors for growth and beef production of cattle during the experiments in Australia, Uruguay and the Netherlands, expressed as a percentage of the experimental period

ADG=average daily gain; LW=live weight; FM=fresh matter.
Digestion capacity limitation and protein deficiency can occur simultaneously. Numbers of experiments refer to those presented in Table 1.
1 Pasture (dry matter) and maize (fresh matter) availability is expressed as a percentage of the total BW per day.
The average MAE for experiments 4 and 5 was 95 g LW/day, which equals 17.1% of the mean measured ADG (Table 2). Simulated ADGs were in line with the measured ADGs in experiment 4 (Table 3, Figure 2). Measured ADGs were underestimated in four out of seven treatments in experiment 5, especially in the year 2004–05 during summer and early autumn. Heat stress and digestion capacity limitation were the major factors influencing growth in experiments 4 and 5 (Table 3). Energy deficiency was also identified as a limiting factor in experiment 4, especially in the year 2002–03, while in 2004–05 protein deficiency was identified as a limiting factor too. The average MAE for experiment 6 was 238 g LW/day, which equals 48.9% of the mean measured ADG (Table 2). The ADGs were overestimated considerably in this experiment, except for cattle grazing pastures with Kazungula. The factors influencing growth most in experiment 6 were heat stress and digestion capacity limitation in pastures with Nandi and Kazungula, whereas the genotype, heat stress and digestion capacity limitation influenced growth most in pastures with other tropical grasses (Table 3).
Uruguay
The MAE of simulated ADGs in experiment 7 was 92 g LW/day, which equals 9.8% of the mean measured ADG (Table 2). The simulated ADG was lowest with a pasture availability of 3% of the TBW without maize supplementation. The simulated ADGs with a pasture availability of 6% and 9% of the TBW were similar (Table 3). Maize supplementation increased the simulated ADGs compared to ADGs without supplementation, irrespective of the amount of pasture available. The genotype and heat stress defined growth with maize supplementation, whereas heat stress and either digestion capacity limitation or energy deficiency also influenced growth without maize supplementation (Table 3).
The Netherlands
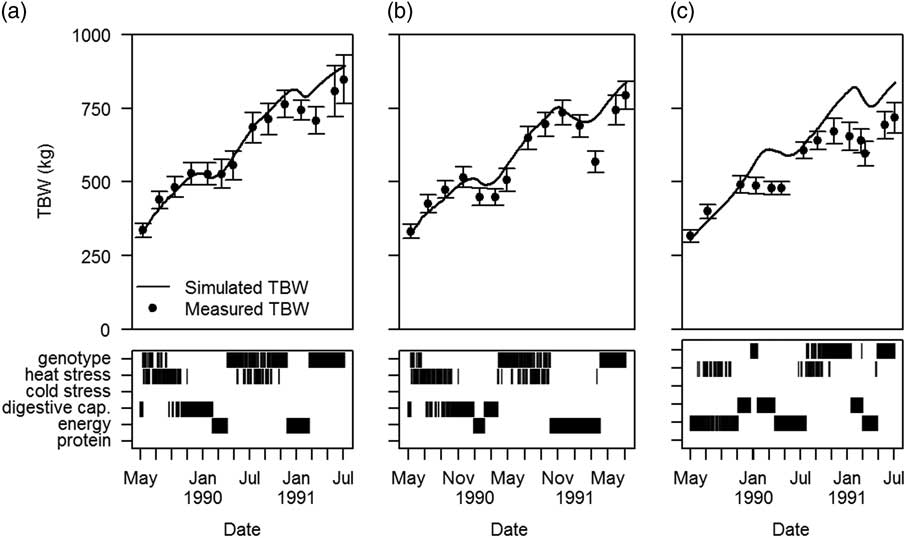
The MAE of simulated ADGs in experiment 8 was 19.4% of the mean measured ADGs (Table 2). Both simulated and measured ADGs were low or negative during winter, and high during spring and summer (Figure 4). The maximum ADG between two measurements was 2.30 kg LW/day for cattle grazing in the riverine area during summer and in the heathland area in winter. Simulations indicated that the genotype generally defined growth from late spring until late summer or early autumn. Heat stress occurred during summer, whereas digestive capacity limitation and energy deficiency generally occurred during winter (Figure 4). Cold stress was not a defining factor for growth during winter.
Simulated (lines) and measured (dots) total BWs (TBWs) and the factors defining and limiting growth of Meuse-Rhine-Yssel cattle grazing in a riverine area (a), a riverine area during summer and a heathland area during winter (b) and a connected riverine/heathland area (c). Bars indicate confidence intervals. Measured data are from Wallis de Vries (Reference Wallis de Vries1996).

Discussion
General model evaluation
Evaluation of LiGAPS-Beef with independent data indicates that the MAE was 20.1% of the measured ADGs (Table 2). Fixed and universal criteria to judge the MAE are rarely found in literature, since the question whether a models’ accuracy is good enough depends on its aim. We deem the current accuracy of LiGAPS-Beef as acceptable, especially because the evaluation data set contained very contrasting beef production systems from three countries. The cattle model LIVSIM is based on concepts of production ecology also (Rufino et al., Reference Rufino, Herrero, Van Wijk, Hemerik, De Ridder and Giller2009). To our knowledge, MAEs of LIVSIM are not available, so the MAEs of LiGAPS-Beef and LIVSIM cannot be compared. Because ADGs are estimated fairly well with LiGAPS-Beef in different beef production systems, it seems plausible that the factors that define and limit growth are captured reasonably to good as well. The models’ ability to identify those factors will be discussed further in the section on country-specific model evaluation.
The error due to random variation was 75% of the MSE (Table 2). Hence, a large percentage of the MSE cannot be explained by improving the fit between measured and simulated ADGs. This result could be caused by natural variation among animals and measurement errors. For example, feeding cattle 2.0 kg FM maize per day in experiment 1 resulted in a lower measured ADG than feeding 1.0 or 1.5 kg FM maize (Table 3). This result seems to be conflicting with our knowledge of animal nutrition. The three highest simulated ADGs overestimated growth for cattle fed molasses in experiment 3, and contribute to the low slope (Table 3). In addition, the lowest two simulated ADGs underestimated growth for experiment 5 (Table 3, Figure 2). The reasons for the overestimation and underestimation are not clear, as will be discussed in the section on country-specific model evaluation.
LiGAPS-Beef was calibrated for ADGs in experiment 1, but not for feed intake, since ADGs are generally measured more precisely than feed intake. Although the simulated and measured intake did not differ significantly from each other, the relative MAE of feed intake was 20.6%. Measurements of feed intake in grazing animals often lack precision, which may explain part of the MAE. Using different measurement techniques for feed intake can result in different estimates of pasture intake, even in the same experiment (Undi et al., Reference Undi, Wilson, Ominski and Wittenberg2008). Furthermore, we assumed that ADG in experiments was not affected by growth limiting factors, such as drinking water, vitamins and minerals, and by growth reducing factors (diseases and stress). Chemical analysis of bones indicated that mineral deficiencies limited growth of cattle in the heathland area in experiment 8 (Wallis de Vries, Reference Wallis de Vries1996). Although this treatment was excluded from the analysis, mineral deficiencies might have played a role in other treatments and experiments, albeit at a lesser extent. The same holds for vitamins, drinking water, diseases and stress, but the extent to which they might have affected ADG seems fairly limited, given the fit between simulated and measured ADGs (Table 2, Figure 2).
Country-specific model evaluation
Australia
LiGAPS-Beef estimated ADGs reasonably well for most treatments in experiments 2 to 6. Nevertheless, simulated ADGs of cattle fed with high levels of molasses were higher than measured ADGs in experiment 3. Increasing supplementation of molasses resulted in a decrease in measured ADGs (1.12 to 0.86 kg LW/day) in experiment 3 (Petty and Poppi, Reference Petty and Poppi2012), but simulated ADGs showed an inverse trend (0.93 to 1.21 kg LW/day) (Table 3). Acidosis might not explain the negative relation between molasses supply and ADG, as Brahman crossbred steers fed with high proportions of molasses (50% and 75%) showed no severe decrease in rumen pH (Tuyen et al., Reference Tuyen, Tolosa, Poppi and McLennan2015). Causes for decreasing ADGs under high molasses supply are not yet fully understood, and model users should thus be careful when simulating high molasses supplementation with LiGAPS-Beef. Model simulations indicated that heat stress was the major factor defining growth in experiments 1 to 3, except at high levels of molasses supplementation in experiment 3 (Table 3). This result is in agreement with notions of Petty et al. (Reference Petty, Poppi and Triglone1998) that a restricted heat release under hot conditions might have limited feed intake and ADG.
Simulated ADGs corresponded fairly well with measured ADGs in experiments 4 and 5 (Table 3). After winter and spring, compensatory growth was observed during summer and early autumn (Hill et al., Reference Hill, Coates, Whitbread, Clem, Robertson and Pengelly2009). Compensatory growth was simulated fairly well for the year 2003–04 in experiment 5. The simulated energy deficiency in experiment 4 is explained by low feed availability. A low feed availability was reported to be a limiting factor in experiment 4 as well (Dixon and Coates, Reference Dixon and Coates2008). Protein deficiency was simulated to occur only from August to October 2004. Dixon and Coates (Reference Dixon and Coates2008) also indicated that the CP content of pasture was likely to be limiting growth in September and October 2004, due to a small proportion of leucaena in the diet. Heat stress and feed quality (digestion capacity limitation) were identified as the factors influencing growth most in experiment 5, which is in line with expectations.
Model simulations mostly overestimated the measured ADGs in experiment 6 (Table 3). Evans and Hacker (Reference Evans and Hacker1992) found that ADGs were higher in 1971–72 than in 1972–73, and that ADGs were higher in 1972–73 than in 1973–74. This could not be explained by feed availability, mineral deficiencies, or unusual climate conditions and neither by feed digestibility. Since ample feed was available, cattle production was assumed to be directly related to feed quality, provided growth rates were below the potential growth rates (Evans and Hacker, Reference Evans and Hacker1992). Simulations indeed identified the genotype as the most defining factor in experiment 6 during 2% to 56% of the experimental period, and feed quality during 11% to 68%, but heat stress also covered 29% to 41% of the experimental period (Table 3).
Uruguay
Simulated ADGs were 0.76 and 0.77 kg LW/day for cattle without maize supplementation and a pasture availability of 6 and 9% of TBW in experiment 7 (Table 3). Measured ADGs (0.65 and 0.96 kg LW/day) differed considerably. An explanation for this difference is that the quality of pasture actually consumed increases with increasing pasture availability, as this offers more opportunities for diet selection (Zemmelink, Reference Zemmelink1980, Beretta et al., Reference Beretta, Simeone, Elizalde and Baldi2006). In our simulations, however, pasture quality was assumed to be the same for all simulations in Uruguay, because it was not measured for the individual treatments in Beretta et al. (Reference Beretta, Simeone, Elizalde and Baldi2006). Simulated and measured ADGs were similar with maize supplementation, irrespective of pasture availability (Table 3). This result is in line with the expectation that maize supplementation reduces the dependency of cattle on pasture (Beretta et al., Reference Beretta, Simeone, Elizalde and Baldi2006).
The Netherlands
In experiment 8, TBW dynamics were generally within the confidence intervals in the riverine area and with grazing in the riverine area during summer and in the heathland during winter (Figure 4). For the latter area, the ADG between the third and second last measurement was 2.3 kg LW/day, which seems exceptionally high. To our knowledge, such ADGs are not likely. Cattle were not fasted prior to weighing in experiment 8 (Wallis de Vries, Reference Wallis de Vries1996). Large changes in TBW may be explained, therefore, by varying rumen contents of cattle during weighing. Model simulations did not identify cold stress as a defining factor for growth during winter in experiment 8. This result may be explained by the relatively high TBWs of cattle and consequently the relatively high BW to body surface ratio, which allows animals to resist cold periods better. Digestive capacity and energy deficiency were limiting cattle growth in winter (Figure 4). This result is not surprising, as feed quality and available feed quantity are expected to be low in nature areas during winter.
Validity domain of LiGAPS-Beef and its future applications
While the overall model performance was acceptable, performance in the three countries resulted in mixed outcomes. For example, the relative MAE was largest for cattle in the CSIRO Beerwah Research Station, Australia, but the relative MAEs for cattle in other experimental stations in Australia were below the MAE across all experiments (Table 2). These mixed outcomes suggest that further model evaluation is required to delineate the validity domain of LiGAPS-Beef. The current model provides an appropriate basis for further model evaluation. Further model evaluation with different breeds, climates, and feeding strategies than used in this research will yield insights in the model performance under a variety of conditions. These insights can be used subsequently to further delineate the validity domain of LiGAPS-Beef and to identify required model improvements.
Whether the performance of a model is sufficient depends on the research aim and context. Our results suggest that LiGAPS-Beef meets the aim it was developed for, and that its performance is acceptable. First, LiGAPS-Beef assessed feed-limited production in different systems reasonably well (MAE=137 g LW/day, or 20.1% of mean measured ADG). Second, the defining and limiting factors for growth simulated by the model complied with the defining and limiting factors reported from experiments on several occasions. This holds promise for LiGAPS-Beef to be of generic value to identify the bio-physical factors that define and limit growth most. Based on these factors, one can subsequently identify promising options to narrow yield gaps. A next step would be to explore the effect of bio-physical improvement options on yield gaps. Such options must then also be assessed in the context of economics (e.g. input and output prices), social considerations (e.g. labour requirements, education), environmental legislation and animal welfare. Subsequently, the most promising and feasible improvement options could contribute to sustainable intensification of beef production systems.
Conclusions
LiGAPS-Beef has been designed to assess potential and feed-limited growth and production of cattle in different beef production systems across the world, and to identify the biophysical factors that define or limit growth. This paper evaluated the performance of LiGAPS-Beef for beef production systems in Australia, Uruguay and the Netherlands. These systems were characterized by different cattle breeds, climates and feeding strategies. Simulated ADGs matched measured ADGs from independent experimental data sets at the animal level reasonably well to good (MAE =137 g LW/day, or 20.1% of mean measured ADG; RMSE =170 g LW/day, or 25.0% of mean measured ADG). Results of LiGAPS-Beef indicate that the factors heat stress, energy deficiency and protein deficiency influenced growth most, which complied well to those reported from experiments. In conclusion, LiGAPS-Beef provides an appropriate basis for assessing potential and feed-limited production, and for identifying the factors that define and limit growth and production. This opens opportunities to use LiGAPS-Beef as a tool for yield gap analysis and simulation of improved practices to mitigate yield gaps.
Acknowledgements
This research is part of the Wageningen University & Research strategic programme ‘Mapping for sustainable intensification’, 2012–2016, funded by strategic funds of Wageningen University & Research, and the PE&RC and WIAS graduate schools of Wageningen University. The authors thank Lindsay Bell (CSIRO, Toowoomba, Australia) for his comments on an earlier version of this paper and for providing weather data. The authors acknowledge Dennis Poppi (University of Queensland, Australia) for his advice. The authors are grateful to Virginia Beretta (Universidad de la República, Uruguay), Oswaldo Ernst (Universidad de la República, Uruguay) and Michiel Wallis de Vries (Wageningen University & Research, the Netherlands) for provision of (additional) data.
Declaration of interest
The authors declare they have no conflicts of interests.
Ethics statement
None.
Software and data repository resources
The source code of LiGAPS-Beef is freely accessible at https://doi.org/10.18174/442973. Updates and model applications will be published on the model portal of the Plant Production Systems group of Wageningen University, the Netherlands (http://models.pps.wur.nl/ligaps-beef).
Supplementary material
To view supplementary material for this article, please visit https://doi.org/10.1017/S1751731118002641