I. INTRODUCTION
SnO2 is a wide band-gap and high dielectric constant (high-k) n-type semiconductor often used in transparent electrodes, Reference Klein, Körber, Wachau, Säuberlich, Gassenbauer, Harvey, Proffit and Mason1 chemical sensors, Reference Korotcenkov and Cho2 and catalysts. Reference Wu and Ng3 SnO2 is easily doped to high carrier concentrations and has lately garnered much interest for optoelectronic devices such as light-emitting and laser diodes. Reference Liu, Chen, Wang, Cao, Pan, Yang, Wang and Zou4–Reference Lee, Shin, Kim, Kim and Ju6 Furthermore, researchers have found many ways to synthesize high quality nanoparticles and nanowires from SnO2 optimized for use in these applications. Reference Das and Jayaraman7 However, the optical and dielectric properties of nanomaterials are difficult to accurately measure. Any technique using a photon source has a spatial resolution much larger than a single nanoparticle, yielding data that is an average of many nanoparticles. This makes it challenging to understand subtle changes in properties between nanoparticles, especially locally within a single nanoparticle. Furthermore, nanomaterials are typically grown in optically rough, porous thin films which scatter light and lack good boundary conditions with which to carry out the necessary calculations for accurately determining the absorption coefficient and dielectric function.
Valence electron energy-loss spectroscopy (VEELS) is increasingly being used to study absorption in the optical energy regime due to recent advances in instrumentation that have drastically improved energy resolution to routinely better than 200 meV and approaching 10 meV with highly specialized equipment. Reference Krivanek, Lovejoy, Murfitt, Skone, Batson and Dellby8 With proper experimental setup and analysis, VEELS can yield information on the dielectric function, absorption coefficient, band gap, mid-gap defect states, and density of states (DOS) spatially resolved to a few nanometers. Reference Wang, Li and Egerton9–Reference Rafferty and Brown11
Rutile (cassiterite) SnO2 has a tetragonal unit cell (a = b = 4.737 Å, c = 3.185 Å) which makes it an anisotropic uniaxial material with different optical properties when excitation is parallel (E‖c) to or perpendicular (E⊥c) to the optic axis [001]. Despite several simulations Reference Borges, Scolfaro, Leite Alves and Da Silva12–Reference Canestraro, Roman and Persson15 of the dielectric and energy-loss functions, to our knowledge only one quality measurement exists in the 0–20 eV range. This was performed by Feneberg et al. using spectroscopic ellipsometry (SE) from a synchrotron light source on a bulk single crystal with a (110) surface to allow access to both excitation directions. Reference Feneberg, Lidig, Lange, Goldhahn, Neumann, Esser, Bierwagen, White, Tsai and Speck16 Cox et al. used an electron beam in early energy-loss spectroscopy and produced depth-profiled spectra, albeit with a much worse energy resolution than the current contribution. Reference Cox and Hoflund17 Their interpretation did not take surface and bulk plasmons into account, which may explain their observations of changing peak intensities at 13.5 and 19 eV when changing the sampled depth, which they attributed to the presence of SnO at the surface. Their polycrystalline film did not allow for measurements of anisotropy.
Much debate still exists concerning the nature of the band gap and the highest and lowest valence and conduction bands, respectively. Despite calculations showing that the smallest fundamental direct gap at Γ (3.6 eV) is dipole-forbidden, experimental measurements show absorption onsets in a range of 3.6–3.8 eV. Reference Chetri and Choudhury18–Reference Reimann and Steube20 Many studies suggest absorption is taking place from lower-lying valence bands only 0.1–0.3 eV from the valence band minimum (VBM). Reference Nagasawa and Shionoya21,Reference Robertson22 However, a recent study by Schleife et al. claims to resolve the discrepancies by applying first-principles calculations to show that the direct gap is highly anisotropic and becomes dipole-allowed just outside the VBM in k-space. Reference Schleife, Varley, Fuchs, Rödl, Bechstedt, Rinke, Janotti and Van de Walle13
The current contribution is the first report of dielectric and energy-loss functions of SnO2 nanowires using VEELS. It will be shown that VEELS can produce comparable measurements to optical techniques but with much higher spatial resolution and the flexibility to probe individual nanoparticles.
II. EXPERIMENTAL METHODS
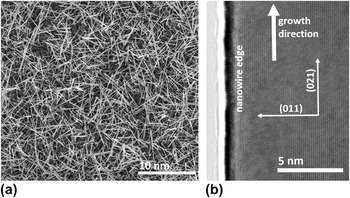
SnO2 nanowires were grown by a high-temperature gold-catalyzed vapor–liquid–solid (VLS) mechanism as previously reported. Reference Miller, Williams, Akbar, Morris and Mccomb23 Nanowires were typically 5–30 μm long and 10–100 nm in diameter, as shown in Fig. 1(a). As reported previously, the nanowires typically grew in a direction normal to the {201} or {301} planes corresponding to a 〈101〉 growth direction, similar to other studies. Reference Mathur and Barth24–Reference Kar, Stroscio, Meyyappan, Gosztola, Wiederrecht and Dutta26 These growth directions are conducive to surface faceting on the {010} and {101} planes, which are energetically favorable. Figure 1(b) shows a high-resolution transmission electron microscopy (HRTEM) image of the {101} planes parallel to the nanowire edge.
(a) SEM image of SnO2 nanowires as grown on a silicon substrate; (b) HRTEM image of the edge of a SnO2 nanowire showing the single-crystal structure and the atomic planes measured as (011) parallel to the edge and (021) perpendicular to the nanowire growth axis.

Scanning transmission electron microscopy (STEM) samples were obtained by sonicating the nanowires into a dispersion in methanol and then pipetting 2–3 drops onto a 3 mm copper or nickel grid coated with a lacey carbon film, followed by drying at 140 °C. All VEELS measurements were taken using a Gatan image filter (GIF; Gatan Inc., Pleasanton, California) on a monochromated FEI Image-corrected Titan3™ G2 60-300 S/TEM (FEI Company, Hillsboro, Oregon) operated at 60 kV. The highest-quality spectra were obtained by collecting a spectrum image (SI) map on a rectangular region at the center of a nanowire at 600–1000 pixels/s. The spatial resolution of valence-loss spectra is on the order of a few nanometers, depending on both the incident electron energy and the actual energy-loss. Reference Egerton27,Reference Egerton28 Spatial maps did not show noticeable differences across any single nanowire, so no full SIs are shown here. This study shows the ability to collect data at a spatial resolution suitable for analyzing individual nanowires. Spectra were collected at α = 9.3 and β = 21.9 mrad unless otherwise noted, where α is the convergence semiangle of the beam on the sample and β is the collection semiangle of the transmitted beam entering the aperture before the detector. The zero loss peak (ZLP) in each pixel was calibrated to 0 eV before the spectra were summed. The typical energy resolution (FWHM of the ZLP) was 150 ± 25 meV, except at small collection angles (<5 mrad) where resolution was sacrificed to improve signal (225–275 meV). The ZLP was removed using the reflected tail method and plural scattering was removed using the Fourier-log algorithm. Reference Egerton29 Kramers–Kronig analysis (KKA) was performed to obtain the real and imaginary parts of the dielectric function, the energy loss function, and the optical absorption coefficient. The index of refraction for KKA analysis was taken as n = 2.1, which is an average of several values reported in the literature. Reference Park and Kim19,Reference Tsokkou, Othonos and Zervos30,Reference Goldsmith, Çetinörgü and Boxman31 These VEELS measurements were all carried out at 60 kV primarily to minimize or eliminate Čerenkov radiation losses in the low energy region of the spectra. At 60 kV accelerating voltage, no Čerenkov radiation losses are expected if the index of refraction of the material is less than n = 2.25. Reference Stöger-Pollach32 Since n = 2.1 in SnO2, no Čerenkov radiation is expected.
III. RESULTS AND DISCUSSION
A. Obtaining the dielectric function and absorption coefficient using Kramers–Kronig analysis
Egerton 2011 describes the procedure for extracting the dielectric function from the collected spectrum. Reference Egerton29 After removal of the ZLP and plural scattering, the single scattering distribution S(E) is described by:
 $$S\left( E \right) = {{{I_0}t} \over {\pi {a_0}{m_0}{v^2}}}{\mathop{\rm Im}\nolimits} \left[ {{{ - 1} \over {\varepsilon \left( E \right)}}} \right]\ln \left[ {1 + {{\left( {{\beta \over {{\theta _E}}}} \right)}^2}} \right]\quad ,$$
where I 0 is the zero-loss intensity, t the specimen thickness, v the speed of the incident electron, β the collection semiangle, and θE = E/(γm 0 v 2) is the characteristic scattering angle for an energy loss E. Then, since the dielectric function is causal, Re[1/ε(E)] is calculated from Im[−1/ε(E)] by the Kramers–Kronig transformation: Reference Egerton29
 $${\mathop{\rm Re}\nolimits} \left[ {{1 \over {\varepsilon \left( E \right)}}} \right] = 1 - {2 \over \pi }P\int_0^\infty {{\mathop{\rm Im}\nolimits} \left[ {{{ - 1} \over {\varepsilon \left( E \right)}}} \right]{{E'{\rm{d}}E'} \over {{{E'}^2} - {E^2}}}} \quad ,$$
where P represents the Cauchy principal part of the integral, avoiding the pole at E = E′. The dielectric function is then obtained from: Reference Egerton29
 $$\varepsilon \left( E \right) = {\varepsilon _1}\left( E \right) + i{\varepsilon _2} <$$><$$>= {{{\mathop{\rm Re}\nolimits} \left[ {{1 \mathord{\left/ {\vphantom {1 {\varepsilon \left( E \right)}}} \right. \kern-\nulldelimiterspace} {\varepsilon \left( E \right)}}} \right] + {\rm{i}} \thinspace {\mathop{\rm Im}\nolimits} \left[ { - {1 \mathord{\left/ {\vphantom {1 {\varepsilon \left( E \right)}}} \right. \kern-\nulldelimiterspace} {\varepsilon \left( E \right)}}} \right]} \over {{{\left\{ {{\mathop{\rm Re}\nolimits} \left[ {{1 \mathord{\left/ {\vphantom {1 {\varepsilon \left( E \right)}}} \right. \kern-\nulldelimiterspace} {\varepsilon \left( E \right)}}} \right]} \right\}}^2} + {{\left\{ {{\mathop{\rm Im}\nolimits} \left[ { - {1 \mathord{\left/ {\vphantom {1 {\varepsilon \left( E \right)}}} \right. \kern-\nulldelimiterspace} {\varepsilon \left( E \right)}}} \right]} \right\}}^2}}}\quad ,$$
Furthermore, the optical absorption coefficient is a simple function of the real and imaginary parts of the dielectric function and can be calculated as a function of energy using ε1(E) and ε2(E): Reference Egerton33
 $$\mu \left( E \right) = \left( {{E \over {\hbar c}}} \right){\left[ {2{{\left( {\varepsilon _1^2 + \varepsilon _2^2} \right)}^{{1 \over 2}}} - 2{\varepsilon _1}} \right]^{{1 \over 2}}}\quad .$$
B. Energy-loss function of SnO2 nanowires
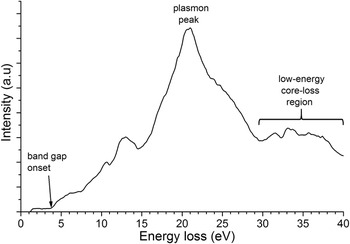
The energy loss function (ELF) shown in Fig. 2 was obtained from a 35 nm diameter SnO2 nanowire at a random off-zone orientation at conditions α = 9.29 mrad and β = 21.88 mrad. The ELF shows a gradual band edge onset near 3.8 eV. A Lorentzian was fitted to the highest intensity peak in the spectrum with a peak center of 21.0 eV and is attributed to the bulk plasmon. The primary contribution of the peak at 12–15 eV is expected to be the surface plasmon. The semicore Sn N4,5 transitions are observed at 31 and 33 eV.
A representative SnO2 valence electron energy-loss spectrum at a random off-zone orientation, with the ZLP and plural scattering removed. A residual background is present until the band gap onset near 3.8 eV.

C. Comparison to SE data
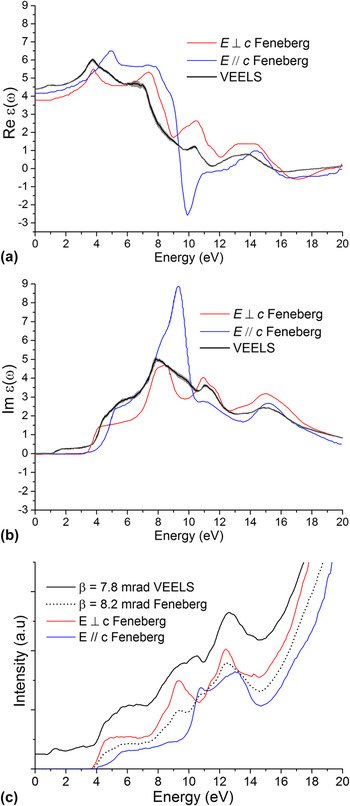
Figures 3(a) and 3(b) show the real and imaginary parts of the dielectric function as a mean obtained from KKA of six different SnO2 nanowires at a random off-zone orientation and sufficiently large collection angle, overlaid with the perpendicular and parallel components as measured by Feneberg et al. Reference Feneberg, Lidig, Lange, Goldhahn, Neumann, Esser, Bierwagen, White, Tsai and Speck16 using SE on a large single crystal of SnO2. The gray shaded area around the black curve denotes the standard error calculated from six nanowire measurements. These plots show that the VEELS data represents a good average of the two directionally-resolved optical measurements both in peak locations and the magnitude of ε1 and ε2 as a function of energy. The data from Feneberg et al. were digitized and calculated into an energy-loss function using KKA as shown in Fig. 3(c). The “magic angle” is the collection angle where the contributions of the parallel and perpendicular components to the acquired spectrum should be equal. Thus, spectra collected at this angle (calculated to be 8.2 mrad at 60 keV Reference Egerton29 ) should be independent of orientation of the specimen. Reference Daniels, Brown, Scott, Nichells, Rand and Brydson34 The dashed curve in Fig. 3(c) has been interpolated using the two directionally-resolved curves to represent mixing of the two measurements at this “magic angle”. This plot shows again that the measured energy-loss function using VEELS is a relatively good average of the two optical measurements.
The real (a) and imaginary (b) parts of the dielectric function as measured in VEELS compared to SE data from Feneberg 2014. Reference Feneberg, Lidig, Lange, Goldhahn, Neumann, Esser, Bierwagen, White, Tsai and Speck16 (c) VEELS energy-loss function taken at 7.8 mrad compared to energy-loss function calculated from the dielectric function using the Feneberg data and a “magic angle” spectrum calculated from a 50/50 mix of the two directional spectra, which corresponds to a collection angle of 8.2 mrad under the VEELS operating conditions.

D. Measuring the parallel and perpendicular parts of the dielectric function
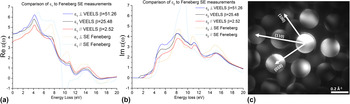
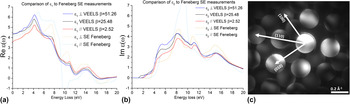
An attempt was made to collect spectra corresponding to the perpendicular and parallel components of the dielectric function for direct comparison with the optical data from Feneberg et al (Fig. 4). This procedure has been previously reported in studies on 2D materials such as TiO2 nanoplatelets, graphene, and carbon nanotube edges. Reference Liberti, Menzel, Shaffer and McComb35–Reference Najafi, Hitchcock, Rossouw and Botton37 Spectra were collected at α = 5.5 mrad and collection angles varied between β = 2.5–52 mrad from an SnO2 nanowire oriented along the [001] zone axis [Fig. 4(c)]. Ideally, a very narrow collection angle β will exclude most of the inelastically scattered signal in the directions perpendicular to the c-axis, namely the [100] and [010] basal plane, allowing only forward-scattered signal which is parallel to the c-axis (E‖c). Conversely, a large collection angle β will include the parallel signal but be dominated by the inelastic scattering in the basal plane directions and correspond to the (E⊥c) dielectric function. Unfortunately, there was very little difference in the dielectric function from spectra collected from 2.5 to 52 mrad, as shown in Fig. 4. However, convergence corrections are needed when the collection angle becomes smaller than the convergence angle. Reference Egerton29 The minimum collection angle of 2.5 mrad then is corrected to the effective collection angle β* = 5.2 mrad at 10 eV. Reference Egerton29 The instrumentation can be pushed to smaller collection angles but at great loss of signal, making the spectra unreliable for precise interpretation. Since β* is not much smaller than the “magic angle” (β = 8.2 mrad), a real E‖c measurement is challenging using the current instrumentation. Additionally, Schattschneider et al. explain that a sufficiently fast electron will yield a greater contribution of excitations transverse to the direction of motion due to relativistic contraction of the electric field of the fast electron in the direction of motion. Reference Schattschneider, Hébert, Franco and Jouffrey38 This further complicates measurement of the parallel component due to the enhanced signal of the perpendicular component. It is apparent that instrumentation advances may be necessary to allow directionally-resolved measurements in SnO2 nanowires.
Real (a) and imaginary (b) parts of the dielectric function from VEELS on the [001] zone using varied collection angles compared to the directionally-resolved optical spectra from Feneberg 2014 Reference Feneberg, Lidig, Lange, Goldhahn, Neumann, Esser, Bierwagen, White, Tsai and Speck16 ; (c) Converged-beam diffraction pattern of a SnO2 nanowire on the [001] zone axis at 58 mm camera length.
E. Optical properties of SnO2 nanowires
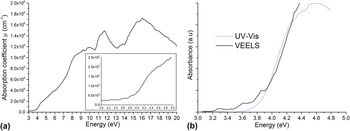
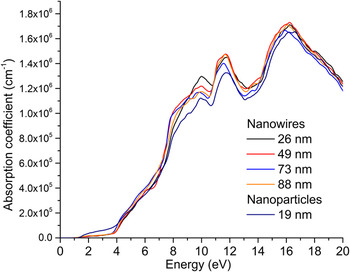
It is not trivial to measure the optical absorption coefficient, µ, of nanostructures using optical excitation techniques such as SE or UV-Vis. Murphy et al. 2007 shows the intensive calculations and assumptions required to produce an estimated value when dealing with an optically rough or light-scattering thin film. Reference Murphy39 The primary challenges of these optical techniques are defining precise boundary conditions for the film and properly accounting for light scattering and reflectance. Furthermore, optical techniques do not have the spatial resolution to measure changes in µ between individual nanoparticles or locally within a single nanoparticle. Figure 5(a) shows µ calculated from the VEELS spectrum of a single SnO2 nanowire via Eq. (4). The optical absorption coefficient in the optical region (inset) is near 1 × 105 cm−1, which is in good agreement with studies using optical techniques on SnO2 nanocrystalline thin films. Reference Canestraro, Roman and Persson15,Reference Zarrinkhameh, Zendehnam, Hosseini, Robatmili and Arabzadegan40,Reference Sundaram and Bhagavat41 The absorption coefficient spectra were also calculated for several individual nanowires and commercial SnO2 nanoparticles ranging in thickness from 19 to 88 nm, shown in Fig. 6. Although some small variations can be seen between the various spectra, no trends were observed as a function of thickness.
(a) Optical absorption coefficient as calculated from ε1 and ε2 obtained from VEELS with optical region expanded (inset); (b) comparison of absorbance spectrum from UV–Vis and absorption coefficient obtained from VEELS.

Optical absorption coefficient of SnO2 nanowires and nanoparticles of varying thickness, as denoted in the legend.

UV-Vis spectroscopy was carried out on a flat silicon wafer with as-grown SnO2 nanowires comprising an open-network thin film on the surface. The spectra were converted from diffuse reflectance to absorbance using the Kubelka–Munk formulation. Reference López and Gómez42 This spectrum is proportional to the optical absorption coefficient but an absolute value cannot be extracted. This UV-Vis spectrum is compared to the actual absorption coefficient calculated from VEELS, shown in Fig. 5(b). Since the two have different units, they were scaled in arbitrary units to have the same slope of band edge onset. The UV-Vis shows a band gap of 3.83 eV, which is expected from literature values. Reference Chetri and Choudhury18,Reference Roman, Valaski, Canestraro, Magalhães, Persson, Ahuja, da Silva, Pepe and da Silva43,Reference Baco, Chik and Md Yassin44 The residual background signal in the VEELS spectrum below the band gap provides a difficulty in the analysis of the band gap value. Shifting of the spectrum due to background subtraction will change the point on the energy axis to which the edge onset would extrapolate. However, the absorption coefficient should be near-zero below the band gap. In this case, a small constant background subtraction was applied to reduce the value to zero at 3 eV. The comparison plot in Fig. 5(b) shows a good agreement in the band edge onset between the two techniques. The band edge onsets of the various particles in Fig. 6 as calculated via the Tauc method Reference Tauc, Grigorovici and Vancu45 for a direct forbidden band gap (power n = 1.5) were 3.77 ± 0.1 eV. Unfortunately, no trends were observed based on thickness or morphology.
F. Comparison to theoretical calculations
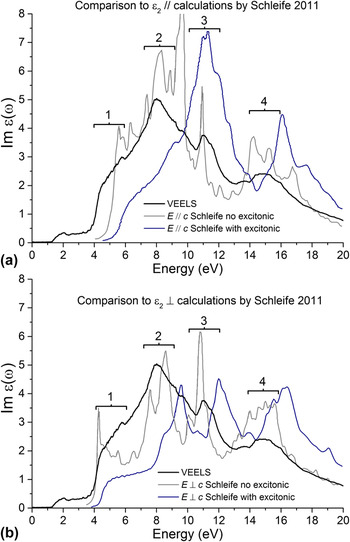
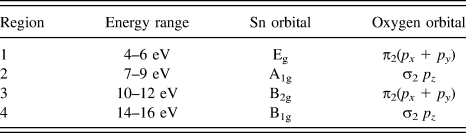
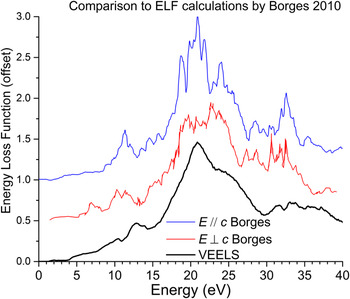
Several studies have previously calculated the dielectric function Reference Schleife, Varley, Fuchs, Rödl, Bechstedt, Rinke, Janotti and Van de Walle13 and energy-loss function Reference Borges, Scolfaro, Leite Alves and Silva46 of SnO2 up to 20 eV. A recent study by Schleife et al. Reference Schleife, Varley, Fuchs, Rödl, Bechstedt, Rinke, Janotti and Van de Walle13 used the G 0 W 0 formalism based on hybrid functional theory to calculate the parallel and perpendicular parts of the dielectric function and furthermore use the Bethe–Salpeter equation (BSE) to produce spectra including and excluding excitonic/Coulombic effects. These are compared to the VEELS spectra in Fig. 7. Although the VEELS data is not directionally-resolved, in both cases it matches more directly with the calculations that exclude excitonic effects. It is possible that either the calculations overestimated the role of excitonic effects or that they do not strongly affect the VEELS measurements. In Fig. 7 we see four primary regions: a strong shoulder near 5 eV, an intense peak at 8 eV, a smaller peak at 11 eV, and a broad peak centered at 15 eV. According to further DFT calculations by Liu et al. 2010, Reference Liu, Liu and Feng47 these peaks correspond to transitions above the band gap of electrons who’s initial state is in one of a series of bonding orbitals as listed in Table I. These bonding states correspond to the first four valence band states below the band gap, with the highest energy band first, going progressively deeper into the valence band. Another recent study by Borges et al. Reference Borges, Scolfaro, Leite Alves and Silva46 used density functional theory in the generalized gradient approximation (DFT-GGA) to estimate the energy-loss function and other optical values in both orientations to 40 eV as shown in Fig. 8. Although the calculations have many sharp peaks, the overall shape again roughly agrees with the VEELS measurements from the 10–12 eV peak, the plasmon peak at ∼21 eV, the shoulder at ∼23 eV, and the core-loss peaks at 30–35 eV. These measurements may help theoreticians refine future calculations in this material system.
Comparison of the imaginary part of the dielectric function as measured in VEELS to that calculated by Schleife et al. Reference Schleife, Varley, Fuchs, Rödl, Bechstedt, Rinke, Janotti and Van de Walle13 in the parallel (a) and perpendicular (b) directions.

Primary features in the imaginary part of the dielectric function and their initial state bonding orbital assignments as proposed by Liu et al. 2010. Reference Liu, Liu and Feng47

Energy-loss function from VEELS compared to that calculated by Borges et al. Reference Baco, Chik and Md Yassin44 using density-functional theory for both parallel and perpendicular directions, offset by 0.5 each for visibility.

IV. CONCLUSIONS
Valence electron energy-loss spectroscopy has been utilized to measure the optical properties of individual SnO2 nanowires for the first time. Kramers–Kronig analysis of the single-scattering distribution has allowed direct comparison to optical data and several theoretical calculations. The dielectric function closely matches a recent SE measurement up to 20 eV. The optical absorption coefficient of individual nanowires was calculated and also agrees well with optical studies on large single crystals. These absorption coefficient curves were also used to calculate the band gap of each particle. However, no obvious trends were observed between nanowires of different diameters or in commercial SnO2 nanoparticles. Furthermore, this work provides the first experimental comparison to several theoretical studies employing density functional theory to predict energy loss up to 40 eV. Unfortunately, an attempt at producing directionally-resolved measurements parallel and perpendicular to the optic axis [001] were unsuccessful. The overall agreement between the presented measurements with the optical data and theoretical studies demonstrates the capabilities of this high-spatial resolution technique for future studies that seek to analyze differences in optical properties between individual semiconducting oxide nanoparticles.
ACKNOWLEDGMENTS
This work was funded by a NASA Space Technology Research Fellowship and a Facilities Grant from the Institute for Materials Research (IMR) at The Ohio State University.