

Much of what we know about prejudice against female political leaders is derived from analyses of survey questions asking respondents to assess the capabilities of women politicians against those of their male counterparts or to express a preference for leaders of a specific gender. Various versions of an item that asks whether “men make better political leaders than women” are widely used in research exploring the consequences and causes of gender bias in politics. This item is the sole measure of prejudice against women politicians to be included regularly in the World Values Survey, in several other highly regarded cross-regional surveys of public opinion, and in many surveys fielded by the Pew Research Center.
Drawing insights from research on prejudice against other groups, I investigate the extent to which these types of explicit questions accurately assesses bias against female political leadership. Work in other fields indicates that gender and politics scholars who rely on overly direct questions about support for female leadership will systematically underestimate the prevalence of pro-male bias. Scholars using explicit measures may also be inaccurately identifying which types of individuals are more supportive of gender equality because of the uneven influence of social desirability bias across demographic and political groups. This study's central argument is that many individuals will admit their hostility toward women leaders only when they do not realize that they are doing so or when their concerns can be communicated in a way that does not run counter to social norms. To assess this argument, I analyze individual-level response patterns to two survey questions: one that explicitly asks about gender preference and one that includes elements to reduce social desirability bias. While most of my analyses use results from a national survey administered by the Pew Research Center, I verify the robustness of the findings with a supplemental analysis of residents from North Carolina.
Both the national and state-level surveys include two measures of gender bias. The first uses the explicit wording found in many Pew surveys. It asks respondents whether men, women, or both equally make better political leaders. The second measure uses similar wording, but it has three key differences. First, it is introduced with a face-saving frame that reminds respondents that relatively few women hold high-level elected office. Second, its response categories permit individuals to acknowledge their bias without directly stating that they prefer male leaders or that they “agree” that men are better. Specifically, bias is captured by whether a person thinks that one of the “reasons” that women are underrepresented in government is because “generally speaking, males make better leaders.” Finally, the alternative measure is presented as one item in a block of questions exploring potential causes of female underrepresentation, thus cognitively masking its purpose. In combination, these three features should reduce social desirability effects and lead to more accurate responses, especially for respondents who are unusually disinclined to admit bias openly.
MEASURING GENDER BIAS AGAINST FEMALE POLITICAL LEADERS
Across the social sciences, researchers use surveys to measure individuals’ stereotypes about female leadership. Scholars studying gendered attitudes and behaviors in the United States often rely exclusively on questions that directly and explicitly probe for pro-male bias by asking respondents whether leaders of a specific gender are preferable (Dolan Reference Dolan2010, 73; see also Kahn Reference Kahn1996; Kenski and Falk Reference Kenski and Falk2004; Lawless Reference Lawless2004; Rosenthal Reference Rosenthal1995; Sanbonmatsu Reference Sanbonmatsu2002). In other cases, scholars pose narrower questions about which gender is best suited to deal with issues connected to specific domestic and foreign policy domains or to effectively carry out the duties that particular political offices require (e.g., Hedlund et al. Reference Hedlund, Freeman, Hamm and Stein1979; Lawless Reference Lawless2004). Other researchers ask respondents to directly compare the abilities of generic male and female politicians in the major parties (Dolan Reference Dolan2010; Sanbonmatsu and Dolan Reference Sanbonmatsu and Dolan2009) or to identify which gender is superior with respect to various leadership qualities, such as being decisive, compassionate, or tough enough for political office (Hayes Reference Hayes2011; Pew Research Center 2015).
Researchers focusing on attitudes toward female politicians outside the United States also depend on explicit questions about gender preference. The World Values Survey and several regional surveys—including the Afrobarometer, AmericasBarometer, Arab Barometer, and Eurobarometer—ask how much respondents agree that “generally speaking, males make better political leaders than women do.” This question is the only indicator in these surveys’ standard questions from which researchers can readily operationalize prejudice against female political leadership. Accordingly, the item has been used in investigations of attitudes and behavior across a wide range of regional and cultural settings (e.g., Alexander Reference Alexander2012, Reference Alexander2015; Espírito-Santo Reference Espírito-Santo2016; Holman, Merolla, and Zechmeister Reference Holman, Merolla and Zechmeister2011; Kerevel and Atkeson Reference Kerevel and Atkeson2015; Morgan and Buice Reference Morgan and Buice2013; Paxton and Hughes Reference Paxton and Hughes2014; Setzler Reference Setzler2015; Valdini Reference Valdini2013).
Many other scholars use the World Values Survey “males make better political leaders” question as a key component of gender equality indices. Here, the item serves as a proxy for a society's level of mass support for increasing female access to power (e.g., Alexander and Welzel Reference Alexander and Welzel2011; Ben-Nun Bloom Reference Ben-Nun Bloom2016; Seguino Reference Seguino2011). Perhaps the most impactful scholarship employing the item in this way is the research by Ronald Inglehart and colleagues that examines the connections between secularization, norms of gender equality, and democratization (e.g., Inglehart and Baker Reference Inglehart and Baker2000; Inglehart and Norris Reference Inglehart and Norris2003; Inglehart, Norris, and Welzel Reference Inglehart, Norris and Welzel2002). Inglehart and his collaborators use a person's preference for male political leaders as one of just three indicators in their Gender Equality Scale; that scale, in turn, has been replicated by political scientists to assess gender equality within and across many societies and regions (e.g., Bejarano, Manzano, and Montoya Reference Bejarano, Manzano and Montoya2011; Coffé and Dilli Reference Coffé and Dilli2015; Kunovich and Paxton Reference Kunovich and Paxton2005; Paxton and Kunovich Reference Paxton and Kunovich2003; Rizzo, Abdel-Latif, and Meyer Reference Rizzo, Abdel-Latif and Meyer2007; Tripp and Kang Reference Tripp and Kang2008).
THE SHORTCOMINGS OF USING EXPLICIT QUESTIONS TO MEASURE PREJUDICE AGAINST WOMEN LEADERS
The convention of measuring prejudice against female political leaders with direct, explicit questions is methodologically problematic. While asking individuals to state whether they prefer male leaders seemingly has high face validity, previous research shows that many people do not answer accurately when responding to direct questions about their prejudices. Much research on racial bias, for example, has shown that asking individuals to verbally confirm their antipathy for out-group members leads many highly biased persons to choose the most socially acceptable response (e.g., Kawakami and Dovidio Reference Kawakami and Dovidio2001; Sears, Sidanius, and Bobo Reference Sears, Sidanius and Bobo2000). We also know that the influence of social desirability bias on response accuracy is not limited to the measurement of racial prejudice, as it also leads to underreporting of ethnicity-based prejudice (Cunningham, Nezlek, and Banaji Reference Cunningham, Nezlek and Banaji2004), opposition to gay rights (Powell Reference Powell2013), and anti-immigrant attitudes (Janus Reference Janus2010).
Gender and politics scholars are just beginning to understand how social desirability bias produces inaccurate assessments of public support for women candidates and leaders. The primary focus of the analyses in my study is to identify the potential shortcomings in the survey items that social scientists are using to gauge attitudes toward female leadership, broadly conceptualized—that is, the way we presently measure gender bias in numerous leading national and international surveys. My second main concern is to see whether it is possible to field an alternative gender bias question that is only modestly different from conventional measures but can more reliably induce respondents to reveal their gender prejudice.
To achieve these aims, it is useful to consider the work of other gender and politics scholars who are exploring the narrower but related question of how social desirability pressures may disguise individuals’ hostility toward having a female U.S. president or seeing more female elected officials (e.g., Benson, Merolla, and Geera Reference Benson, Merolla and Geera2011; Krupnikov, Piston, and Bauer Reference Krupnikov, Piston and Bauer2016). Not surprisingly, much of this still-developing work has centered on attitudes related to the challenges faced by the United States’ first highly competitive female presidential candidate, Hillary Clinton. For example, Streb et al.’s (Reference Streb, Burrell, Frederick and Genovese2008) pathbreaking study of America's readiness for a female president used a list experiment to assess the extent to which Americans hide their concerns about having a woman president. Specifically, the researchers split their survey sample in half, with the first set of respondents being asked to note the number of statements from a list of four items—all four unrelated to gender issues—that made them “upset.” The second half were given the same four statements, but their list added a fifth: “having a woman president.” Comparing the number of statements to which the typical respondent in each group objected to, Streb and colleagues concluded that the share of Americans willing to admit to having gender bias against a woman president more than doubled when respondents did not have to disclose that bias directly.
Despite the significant progress in developing methods to understand how social desirability pressures impact attitudes toward female candidates and leaders in the United States, important questions and issues remain. First, there is the practical matter of seeing whether there are more efficient ways to address the influence of social desirability biases than using list experiments or similar types of research that involve the experimental manipulation of subsamples. These methods are less than optimal because many international surveys presently employing the item that asks whether “males make better leaders” use high-cost, face-to-face interviews. Compared with a traditional survey, split-sample experimental designs require considerably enlarged respondent pools to gain the same statistical power, and they limit the range of multivariate analysis options (Krupnikov, Piston, and Bauer Reference Krupnikov, Piston and Bauer2016; Schaffner Reference Schaffner2011).
Second, much of the recent scholarship on the measurement of gender bias in American politics has followed the lead of Streb et al. and focused narrowly on support for either Hillary Clinton or a generic female presidential candidate (e.g., Benson, Merolla, and Geera Reference Benson, Merolla and Geera2011; Burden, Ono, and Yamada Reference Burden, Ono and Yamada2017; Claassen and Ryan Reference Claassen and Ryan2016; Kenski and Falk Reference Kenski and Falk2006). The framing of the key questions in this research makes it impossible to know whether these scholars have measured hidden feelings about female leadership generally or “instead tapped into views of Hillary Clinton as the most likely female president” (Burden, Ono, and Yamada Reference Burden, Ono and Yamada2017, 1076). Several of these researchers have pointed to the “Hillary effect” as a possible explanation for the finding that prejudice against U.S. female presidential candidates may not be as widespread as reported in previous studies. When researchers recently re-fielded Streb et al.’s survey in March 2016, for example, their replication found that the share of Americans admitting to “being upset” about the possibility of a female president was much smaller than what previously had been reported. However, the authors cautioned that their findings might well be case specific because many of their respondents were presumably framing their assessments of generic female presidential candidates to reflect Clinton's status as the Democratic nominee and her 25-year presence in national politics (Burden, Ono, and Yamada Reference Burden, Ono and Yamada2017, 1076; see also Claassen and Ryan Reference Claassen and Ryan2016).
With much still to learn about the prevalence and causes of social desirability pressures in the assessment of female leadership, it is prudent to consider relevant findings from the broader literature on measuring prejudice. One major conclusion in previous research on the influence of social desirability bias is that not all individuals are equally inclined to match their survey responses to social expectations. For example, researchers have discovered that higher levels of education are correlated with an exaggeration of social tolerance (Jackman Reference Jackman1978; but see Heerwig and McCabe Reference Heerwig and McCabe2009), voter participation (Bernstein, Chadha, and Montjoy Reference Bernstein, Chadha and Montjoy2001), and support for liberal immigration policies (Janus Reference Janus2010). In short, better-educated people are more likely than others to know whether their opinions match social norms.
People are particularly susceptible to social desirability pressures when asked about behaviors or attitudes that may be inconsistent with the preferences of the social or political groups to which they have their closest ties. For instance, evangelical Protestants overreport their rate of attending religious services (Hadaway, Marler, and Chaves Reference Hadaway, Marler and Chaves1993), but they are less likely than secular peers to erroneously tell pollsters that they support gay rights (Powell Reference Powell2013). Similarly, Gilens, Sniderman, and Kuklinski (Reference Gilens, Sniderman and Kuklinski1998) show that white liberals who are angry about affirmative action programs are three times more likely than white conservatives to cloak their true feelings.
A recent, less well-developed finding is that some types of individuals may exaggerate their prejudice when presented with survey questions that can be answered in a way that is consistent with intolerant views endorsed by the social groups with which these respondents closely identify. Knoll's (Reference Knoll2013) study of nativism in the United States, for example, analyzes how different types of individuals responded to an explicit, direct measure of anti-immigrant attitudes and then to a similarly worded alternative measure designed to reduce social desirability bias. With the explicit measure, respondents were asked how much they agreed with the statement that “American culture and our way of life need to be protected against foreign influence.” The alternative measure was a virtually identical statement, but it was presented in a format that did not require respondents to directly reveal their anti-immigrant biases. Comparing response patterns, Knoll found that nativism among Americans is systematically overestimated by the most widely used survey questions on the topic. This is because ideological conservatives and older individuals—demographic groups that tend to see themselves as especially patriotic—are unusually prone to declaring nativist beliefs exclusively when responding to explicit questions.
HYPOTHESES, DATA, AND MEASUREMENT
The analysis so far has identified several testable hypotheses. First, I anticipate that asking respondents to directly state their preference for male political leaders underestimates the share of individuals who actually think that men are better leaders. Specifically, respondents should be more likely to reveal a preference for male leadership when this attitude is assessed with a question that includes a face-saving introduction, does not require respondents to directly state their prejudice, and includes other features to mask the purpose of the item.
Previous research also suggests that some types of people will be disproportionately inclined to hide or disclose their bias for male leaders. On the one hand, studies have shown that social desirability pressures may be particularly prevalent among members of the politically dominant group in advanced democracies. Specifically, more powerful individuals may be more reluctant than other individuals to directly confirm their prejudices against less powerful groups. If this second hypothesis is correct, we would expect to find that male respondents—that is, members of the group that has historically dominated political life in the United States—will be more inclined than females to hide their preference for male leaders because these men fear being seen as sexist. Specifically, I anticipate that a disproportionately high share of the men who do not express a pro-male bias on an explicit question about their gender preference will do so when answering a similarly worded but modestly masked alternative question.
Previous research suggests that minorities and progressives will be less biased against female leaders than other individuals; however, members of these groups who have concerns about female leadership should also be less inclined to disclose their prejudices than the typical respondent because so many of their peers are devoted to increased equality for historically marginalized groups. Accordingly, my third hypothesis is that members of racial, ethnic, or liberal political groups should find it especially difficult to directly express any personal objections they may have against female political leadership. Specifically, if nonwhite or Democrats hold pro-male bias, that prejudice will become evident only when it is assessed with the survey item designed to mask its intention of measuring bias.
My last hypothesis is that many evangelical Protestants and Republicans will exaggerate their preference for male leaders. Previous research shows that evangelical Protestants and Republicans are more inclined than other Americans to tell researchers that they prefer male political leaders and to say that women should return to their traditional roles (e.g., Setzler and Yanus Reference Setzler and Yanus2016). Evangelical Protestantism distinguishes itself from mainline Protestantism in part based on doctrinal assumptions that men should hold all important decision-making power in the church and public affairs, while women should remain at home and attend primarily to the family's concerns (e.g., Brint and Abrutyn Reference Brint and Abrutyn2010; Deckman Reference Deckman and O'Connor2010). Republican politicians often emphasize the value of conservative religious views in their campaigns and lament what they see as the undesirable erosion of traditional institutions and familial arrangements over time (Calfano and Djupe Reference Calfano and Djupe2011). Consequently, I anticipate that respondents belonging to these two groups will be more likely to favor male leadership in general and that, in the same way that older Americans and Republicans systematically overstate their nativism (Knoll Reference Knoll2013), evangelical Protestants and Republicans will be unusually inclined to express pro-male bias only on the explicit measure of gender bias.
Following the lead of other studies that have examined shortcomings to measuring prejudice with explicit survey questions (e.g., Janus Reference Janus2010; Knoll Reference Knoll2013), my analyses will compare response patterns across two survey items that ask respondents in modestly different ways to express their preference for male political leaders. The national-level data for my analyses come from a 2008 survey sponsored by the Pew Research Center's Social and Demographic Trends Project (Pew Research Center 2008). The survey focused on attitudes toward female political and business leaders and sampled 2,250 individuals (1,500 landline and 750 cell random digit dialing [RDD]) using a nationally representative pool of adults in the continental United States. While Pew surveys of the United States and international populations often include the conventional question about whether males make better political leaders than women, the questionnaire used in this study is the only Pew survey that I could locate that includes the second item necessary to create an alternative measure of gender bias whose purpose is masked.Footnote 1
As a robustness check of my study's core findings, I report the results of a second state-level survey. These data come from a 2013 High Point University poll that surveyed a state-representative pool of individuals living in North Carolina.Footnote 2 The survey included 484 individuals (163 landline and 321 cell RDD from a sample generated by Survey Sampling International).
Explicit and Masked Measures of Gender Bias
The Pew questionnaire included two items designed to reveal a person's bias against female political leadership. The first was explicit and direct, requiring respondents to state their bias if they had one: “Which one of the following statements comes closest to your opinion about men and women political leaders?” The three response options were:
1. “Men generally make better political leaders than women.”
2. “Women generally make better political leaders than men.”
3. “In general, women and men make equally good political leaders.”
The state-level survey included this same question and an identical set of responses.
The alternative, masked measure of gender bias was embedded in a block of questions that Pew introduced with the following framing statement:
As you may know, our country has 8 women governors out of 50 and 16 women senators out of 100. There may be many reasons that there are fewer women than men in high political offices. Here is a list of some of them. For each, please tell me whether you think it is a major reason, a minor reason, or not a reason why there are fewer women in politics.
One by one, each of the following statements listed was then presented to each respondent:
1. Generally speaking, women don't make as good leaders as men.
2. Many Americans aren't ready to elect a woman to higher office.
3. Women are discriminated against in all areas of life, and politics is no exception.
4. Women's responsibilities to family don't leave time for politics.
5. Generally speaking, women aren't tough enough for politics.
6. Fewer women have the experience required for higher office.
7. Women who are active in party politics get held back by men.
The statements were read to respondents in random order.Footnote 3 For example, some individuals first received and responded to the question about whether having many Americans who “aren't ready to elect a woman to higher office” is “a major, minor, or not a reason” why there are few women in high political office. After a response was given for the individual item, the interviewer then read a second statement from the list and asked whether that factor was a major, minor, or not a reason why so few women hold high office, and so on. For this study, the critical item is the one asking respondents to assess whether the statement “women do not make as good leaders as men” is a reason for underrepresentation. If a respondent said this statement accounts for underrepresentation, they were demonstrating that they accepted the biased statement as being accurate. In the survey of North Carolina residents, respondents heard a similar framing statement and then considered identical statements (also presented and assessed one statement at a time, in random order).Footnote 4
In both the national and state-level surveys, the wording for the alternative measure of bias closely matches the phrasing of Pew's highly explicit item, but it has several distinctive features to reduce social desirability bias. First, while the conventional question makes its intention obvious and requires respondents to admit in their own words that they think “men” are better leaders, the response options for the masked item are worded so that respondents reveal their bias without actually saying that they prefer “men” or that they “agree” with the statement that men are better leaders. Second, the alternative item masks its intent to measure bias by telling respondents they will be successively considering multiple explanations for the underrepresentation of women elected officials. Finally, the masked version begins with a face-saving framing statement, which reminds respondents that women are broadly unrepresented in politics. Similar question framing is commonly used by political scientists looking at voting behavior, with respondents reminded that many individuals have cause not to vote. The face-saving statement is provided to “legitimatize less desirable response options” and better measure behaviors that deviate from socially optimal ones (Krosnick and Presser Reference Krosnick, Presser, Marsden and Wrights2010).
As the purpose of this study is to explore bias against female leadership, respondents were coded 1 if they said “men” generally make superior leaders. They were coded 0 if they thought “women” generally “make better political leaders” or said that “women and men make equally good leaders.” The masked measure is also binary; respondents were coded 1 if they said that a “major” or “minor” reason for the underrepresentation of women in high-level political office is that, “Generally speaking, women don't make as good leaders as men.” Respondents were coded 0 if they said this “is not a reason.”
Independent and Control Variables
Three of my hypotheses anticipate that certain types of individuals (men, Democrats, and nonwhite respondents) will be disproportionately likely to conceal pro-male bias, while other types of individuals (evangelical Protestants and Republicans) will overstate their prejudice. Thus, the analyses consider binary variables for being male, Republican, and Democrat (with independents serving as the reference category). Similarly, respondents were coded as nonwhite or white based on a top-level question that asked respondents to identify their race. Respondents were considered to be evangelical Protestants if they met two criteria: self-identifying as adherents to one of the religious denominations classified by Pew researchers as belonging to the Protestant tradition and considering themselves to be a “born again or evangelical Christian.” Just under a quarter of the survey's respondents met these two criteria, a figure that closely matches the share of this population in other surveys (Pew Forum on Religion and Public Life 2008).
The analyses also include controls for several influences identified in previous work examining the determinants of gender bias against female political leaders (e.g., Dolan Reference Dolan2014; Sanbonmatsu Reference Sanbonmatsu2002; Setzler and Yanus Reference Setzler and Yanus2016). These include age (in years) and religious exposure, which is measured with a five-point indicator of worship frequency (1 = “seldom or never” attends services, 5 = attends at least weekly). Two additional controls address factors that have been linked to increased social desirability effects in previous studies. Researchers have reported that some respondents tailor their answers to questions about their prejudice in ways that correspond to the interviewer's characteristics (for a summary, see Krosnick and Presser Reference Krosnick, Presser, Marsden and Wrights2010; see also Kane and Macaulay Reference Kane and Macaulay1993), so the analyses here take into account the interviewer's gender under the assumption that respondents might be less honest about pro-male bias when speaking to a female interviewer. There also is some evidence that people with more educated are less likely to openly express their prejudices (Janus Reference Janus2010). The regression analyses accordingly include a four-point measure of educational attainment (1 = did not complete high school, 2 = high school graduate, 3 = college graduate, 4 = at least some graduate education).
FINDINGS
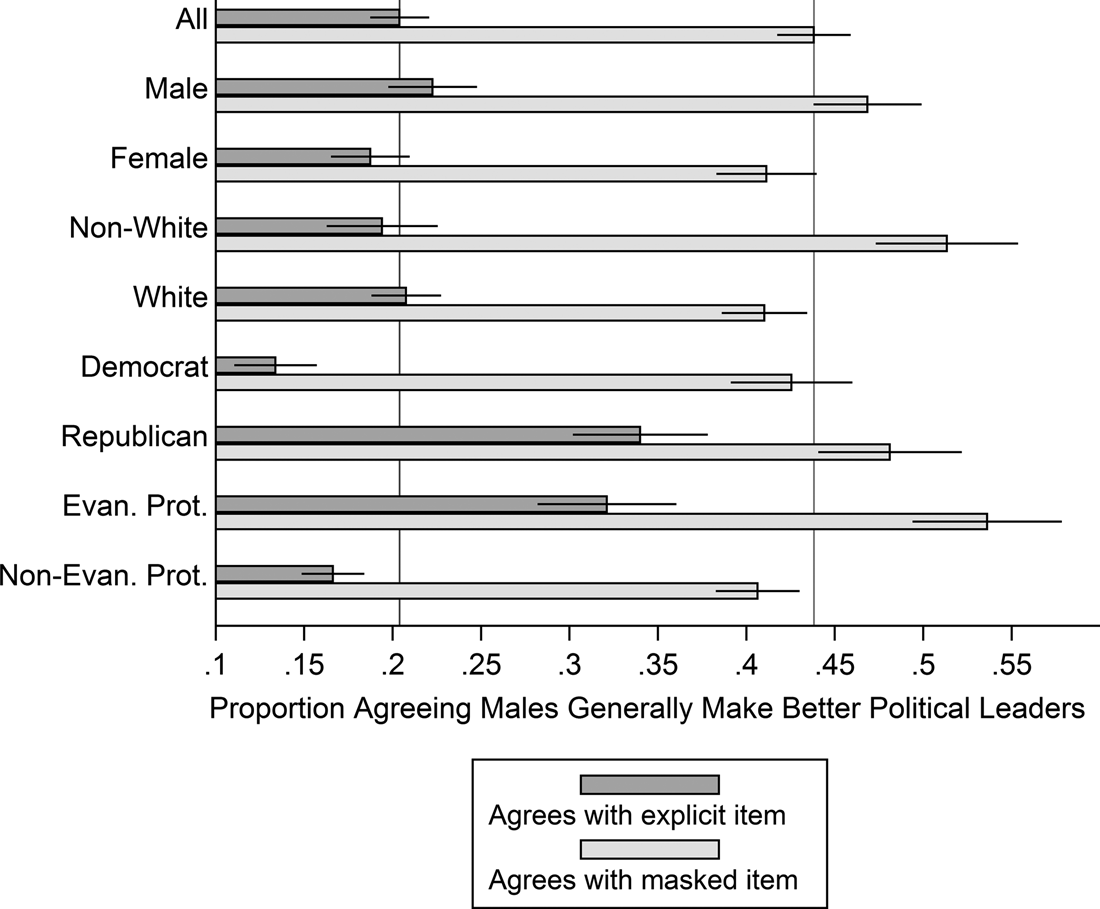
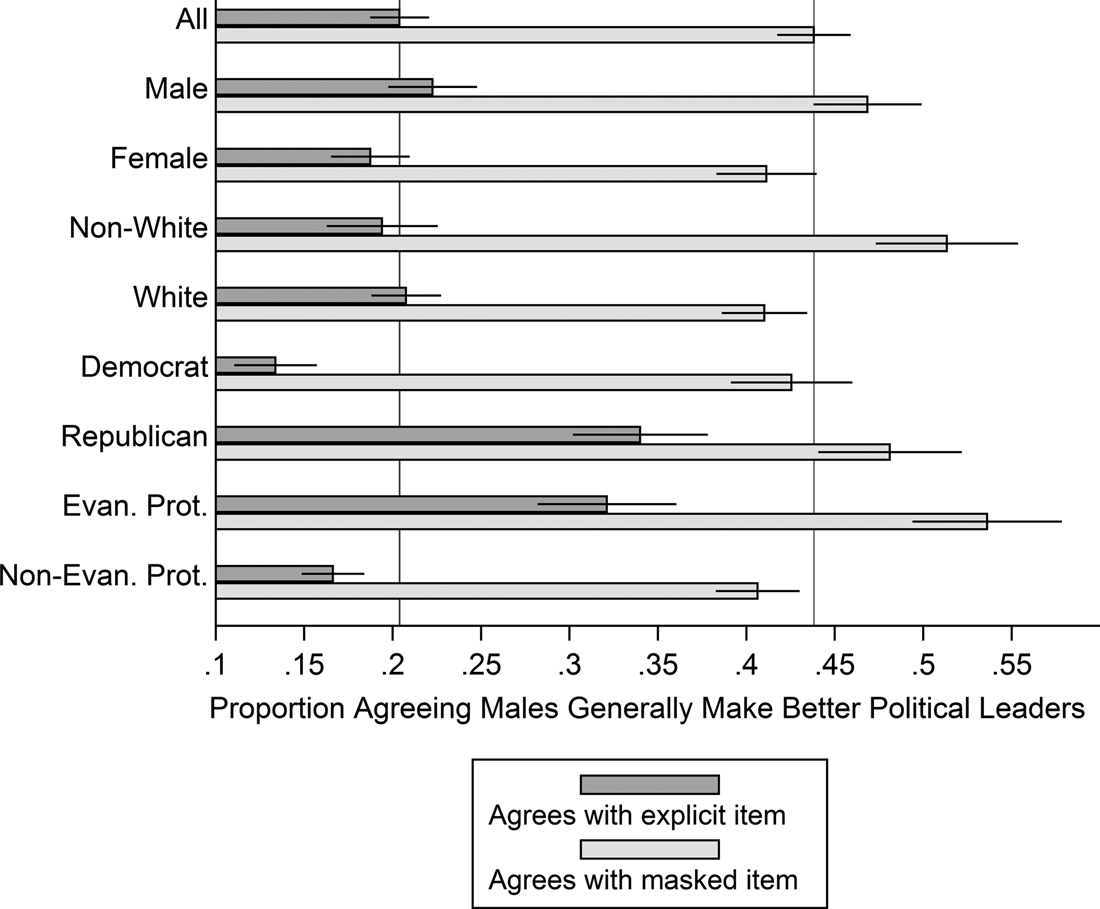
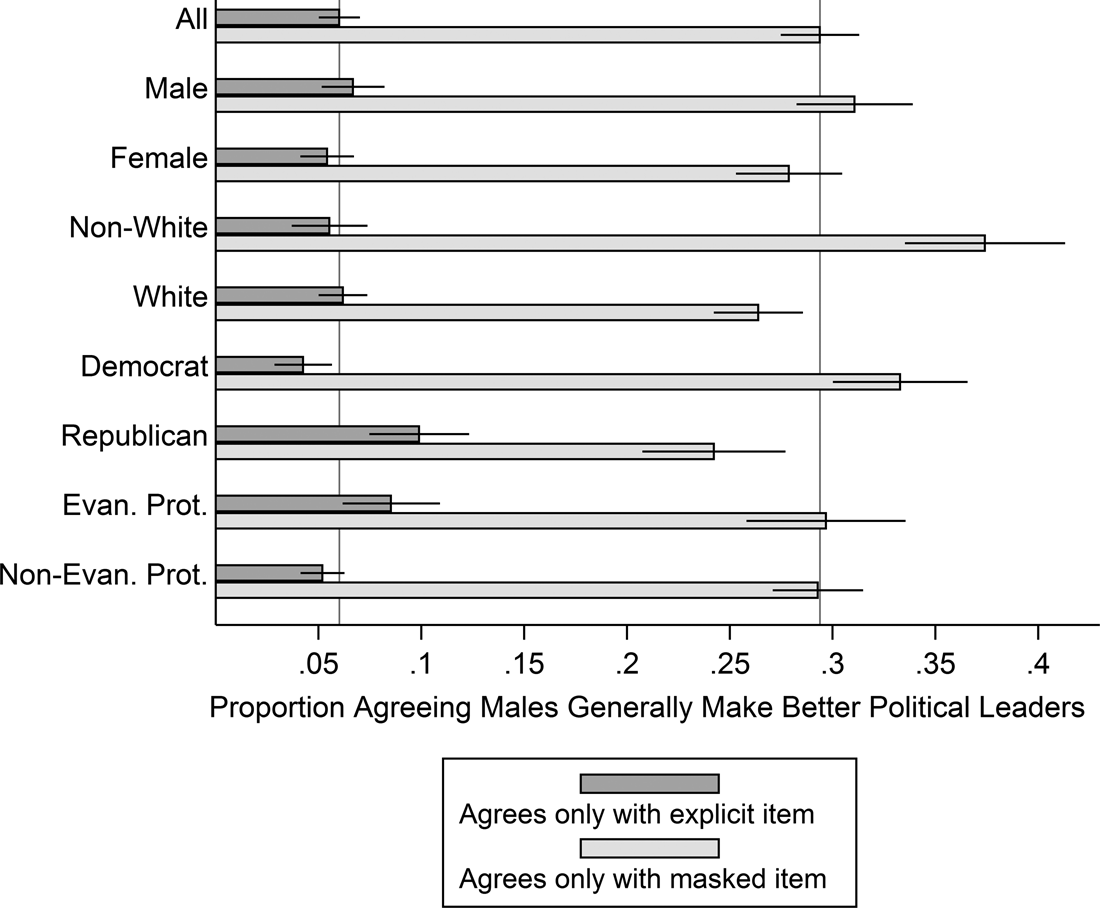
The summary statistics reported in Figures 1 and 2 are consistent with my first three hypotheses, but they do not support the idea that Republicans or evangelicals are heavily exaggerating concerns about female leadership. In Figure 1, the top bar for each of the referenced groups shows the proportion of individuals who directly stated that “men” make better political leaders. The bottom bar reports the percentage of respondents in each group who said that a major or minor reason that women hold relatively few powerful political positions in the United States is that men make better leaders.
The proportion of Americans who think that male political leaders are better than women when measured by an explicit versus a masked question. The lines on the bars are 95% confidence intervals; the vertical lines indicate the proportion of the sample as a whole that expressed each type of bias.
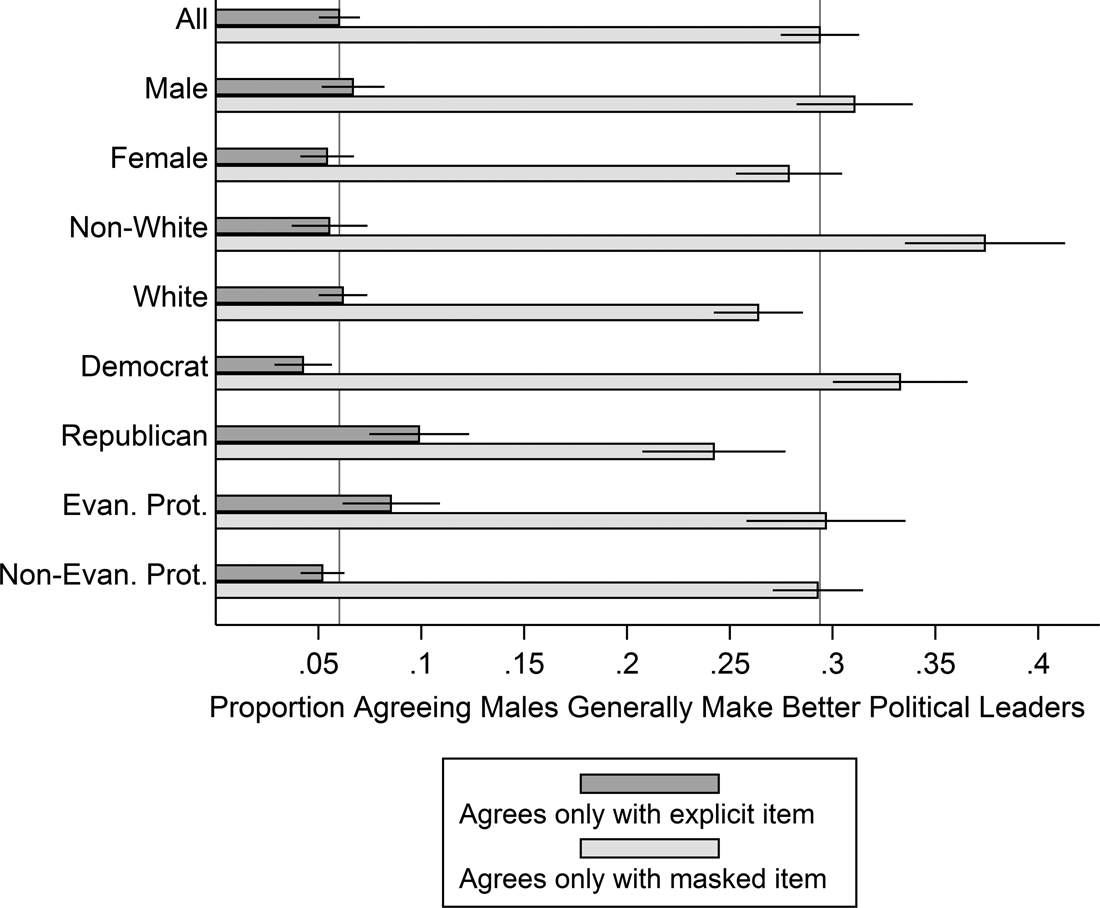
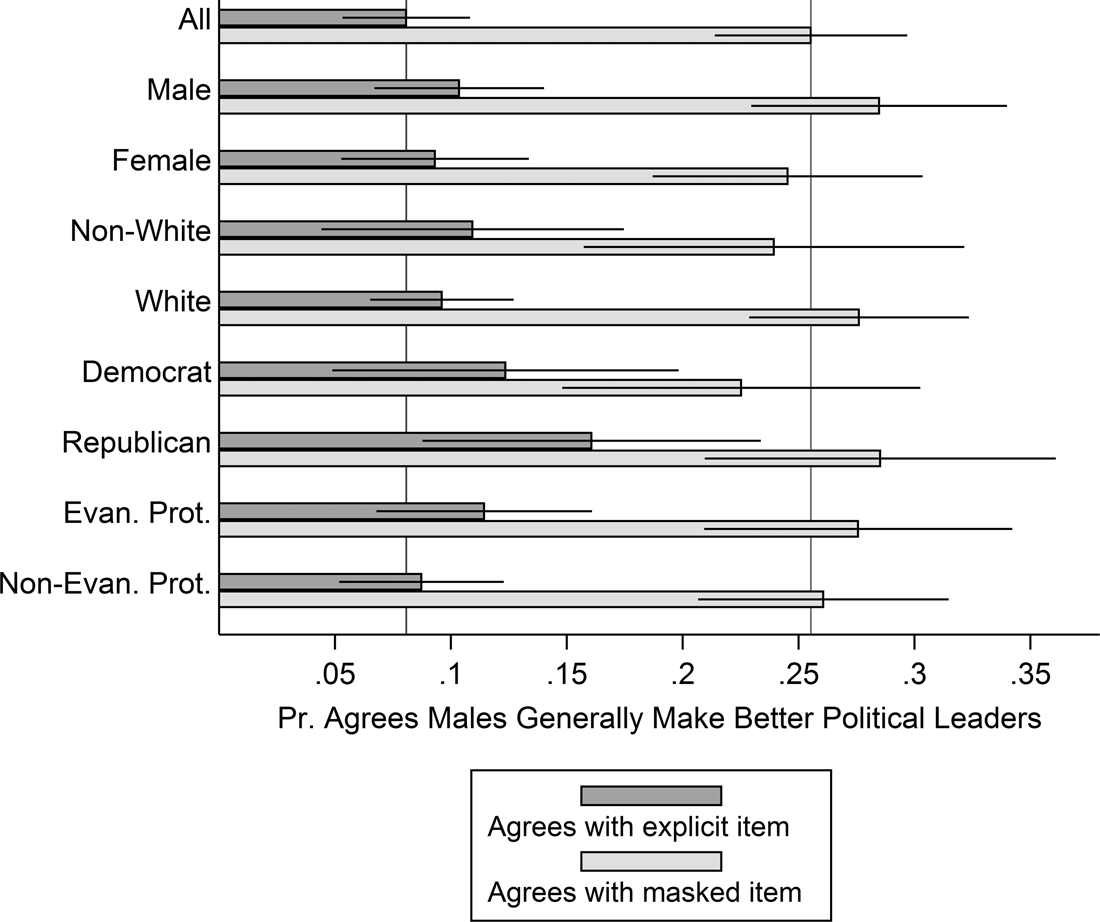
The proportion of Americans saying that male political leaders are better than women only when responding to the explicit or masked version of a gender bias question. The lines on the bars are 95% confidence intervals; the vertical lines indicate the proportion of the sample as a whole that expressed each type of bias.
Given how extensively explicit, direct measures of prejudice against female politicians are used throughout the gender and politics literature, the most important finding uncovered in this study is the extent to which my first hypothesis is confirmed. As plotted in the first set of bars in Figure 1, the typical American is more than twice as likely (44% of respondents versus 20%) to express prejudice against female political leadership when this bias is assessed with a survey item that includes a face-saving frame, whose purpose is masked, and that does not require respondents to directly profess their bias.
The remaining results show that individuals in all of the subgroups under consideration cloak their gender prejudice; however, the varying gaps in the two measures’ results indicate that some types of individuals are more likely to hide their prejudice than the typical respondent. While men are statistically indistinguishable from women when responding to the explicit question, the gap between the sexes grows to around 6 percentage points with the masked measure. This finding is consistent with my second hypothesis. While some of the previous research looking at hostility toward having a female president (e.g., Streb et al. Reference Streb, Burrell, Frederick and Genovese2008) has reported that men and women are equally susceptible to social desirability pressures, the findings here are in line with more recent work (e.g., Burden, Ono, and Yamada Reference Burden, Ono and Yamada2017) indicating that men are somewhat more likely than women to hide their concerns about female leaders.
While a disproportionate share of men exaggerate a belief in gender equality when asked to admit to pro-male bias directly, it is also noteworthy that women also are more than twice as likely (41% versus 19%) to agree with the premise that men make better leaders when responding to the masked question. When gender bias is measured more discreetly than is conventionally the case, more than two out of every five women express doubts about the ability of women leaders to perform as well as their male counterparts. Although it is beyond the scope of this study, these findings are consistent with a large body of research linking low female candidacy rates in the United States to self-recruitment issues and limited elite outreach by party elites to recruit qualified women.
Some of most striking data displayed in Figure 1 are for nonwhites and Democrats. The findings strongly support my third hypothesis, that individuals who belong to groups that are historical advocates for social equality are more likely than other individuals to mask sexist beliefs if they have them. Minority respondents are slightly less likely than whites to say male political leaders are superior when responding to the conventional question but 10 points more likely than whites to exhibit pro-male bias on the masked measure. With respect to partisanship, Republicans are nearly three times as likely as Democrats (34% versus 13%) to admit to having a pro-male bias when responding to the conventional item; however, Democrats are nearly indistinguishable from Republicans in their answers to the masked question. While previous research indicates that Democrats are disproportionately supportive of female politicians (e.g., Sanbonmatsu and Dolan Reference Sanbonmatsu and Dolan2009; Setzler and Yanus Reference Setzler and Yanus2016), the findings here show that Democrats are three times more likely to express pro-male bias when they are responding to a modestly masked measure of the same prejudice. One important implication of this finding is that both parties appear to have similarly skeptical voters with respect to the value of increasing female political power; however, the comparatively high female candidacy and nomination rates within the Democratic Party suggest that such skepticism can be readily overcome if a party chooses to prioritize its recruitment and support of women candidates.
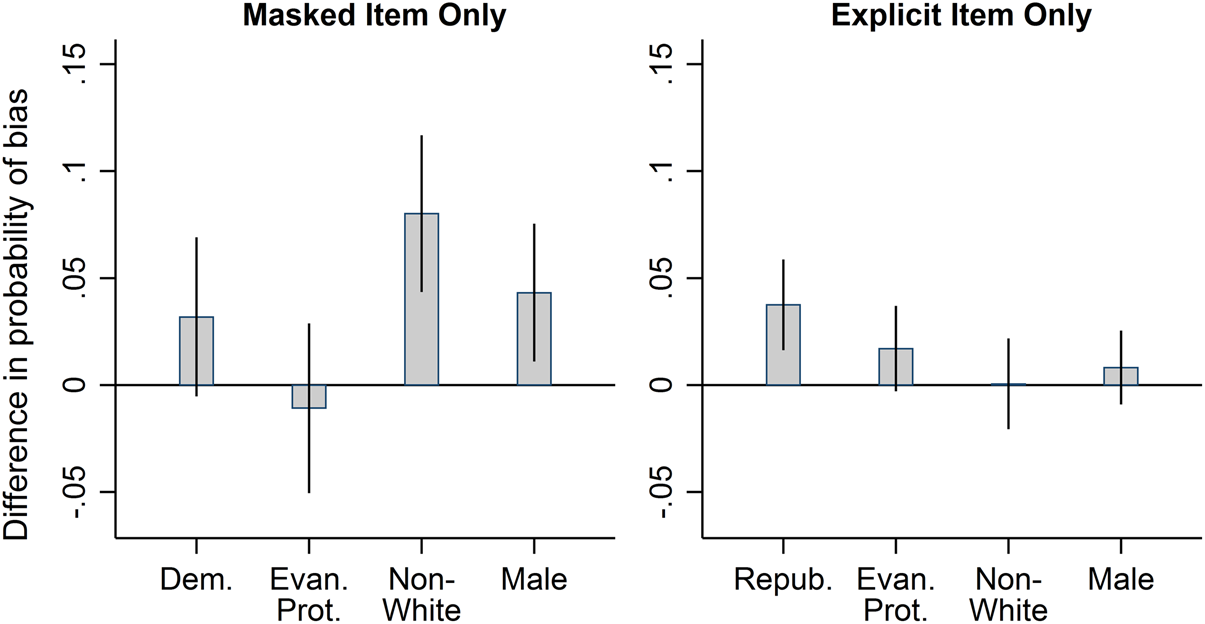
As an initial exploration of my other hypotheses, the top bar for each group listed in Figure 2 identifies the percentage of individuals who expressed gender bias only on the explicit measure, while the bottom bars report the share of respondents who exhibited bias only for the masked item. While only a small share of the sample expressed a pro-male bias exclusively on the explicit measure, Republicans did so at more than twice the rate of Democrats (10% versus 4%) and were slightly more likely to do so than evangelicals. As a whole, the results provide little support for my fourth hypothesis, which anticipated that individuals belonging to political and religious groups that cherish traditional social and familial arrangements will overstate their preference for male political leadership in order to fit with the norms of traditional groups. Otherwise, the data in the bottom set of bars of the figure confirm that some groups are much more likely to hide their biases than others. Nonwhites, for example, are among the least likely of respondents to state a preference for males directly, but they are among the most likely of individuals to express concerns about female leadership on only the masked item.
Multivariate Analyses
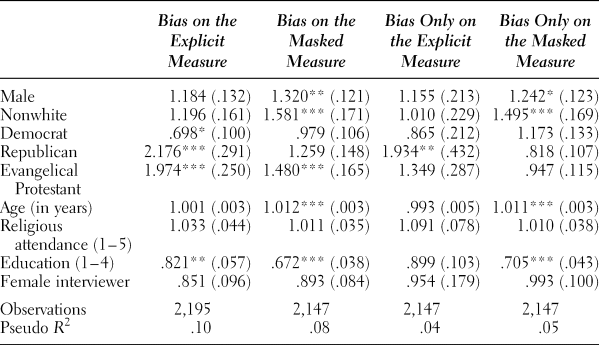
To more deeply and rigorously explore how different social identities impact response patterns across the two measurements of gender bias, the logistic regression models summarized in Table 1 isolate and independently assess the influence of a person's partisanship, religiosity, race, and gender on the two bias measures. The first model estimates the likelihood of an individual saying that males make better political leaders in response to the conventional question. The second model predicts the likelihood of pro-male bias for the masked measure. The third examines which factors make some persons more or less likely to express gender bias exclusively when answering the masked question. That is, this model predicts which type individuals decline to say that males make better political leaders on the explicit measure, only to accept the same premise on the masked item. These results provide the necessary data to test my third hypothesis, which anticipates that social desirability biases will cause certain types of individuals—for example, many Democrats and men—to admit to gender prejudice only if they are unaware that their bias is being measured or when they are induced to be forthright about their bias because the question wording legitimizes a less socially desirable response. The final model analyzes which characteristics best predict the likelihood that an individual will express a bias for male leaders only when answering the explicit question. Specifically, the model predicts which types of persons stated that men make better political leaders on the explicit measure but then did not do so for the masked measure. These results provide the data necessary test my last hypothesis, which suggests that some individuals’ attachments to socially conservative groups may lead them to exaggerate their preferences for traditional, patriarchal political leadership.
Predicting the likelihood of thinking males make better political leaders, by explicit and masked measures of bias (logistic regression)

Note: Cell entries are odds ratios; standard errors in parentheses.
* p < .05; ** p < .01; *** p < .001.
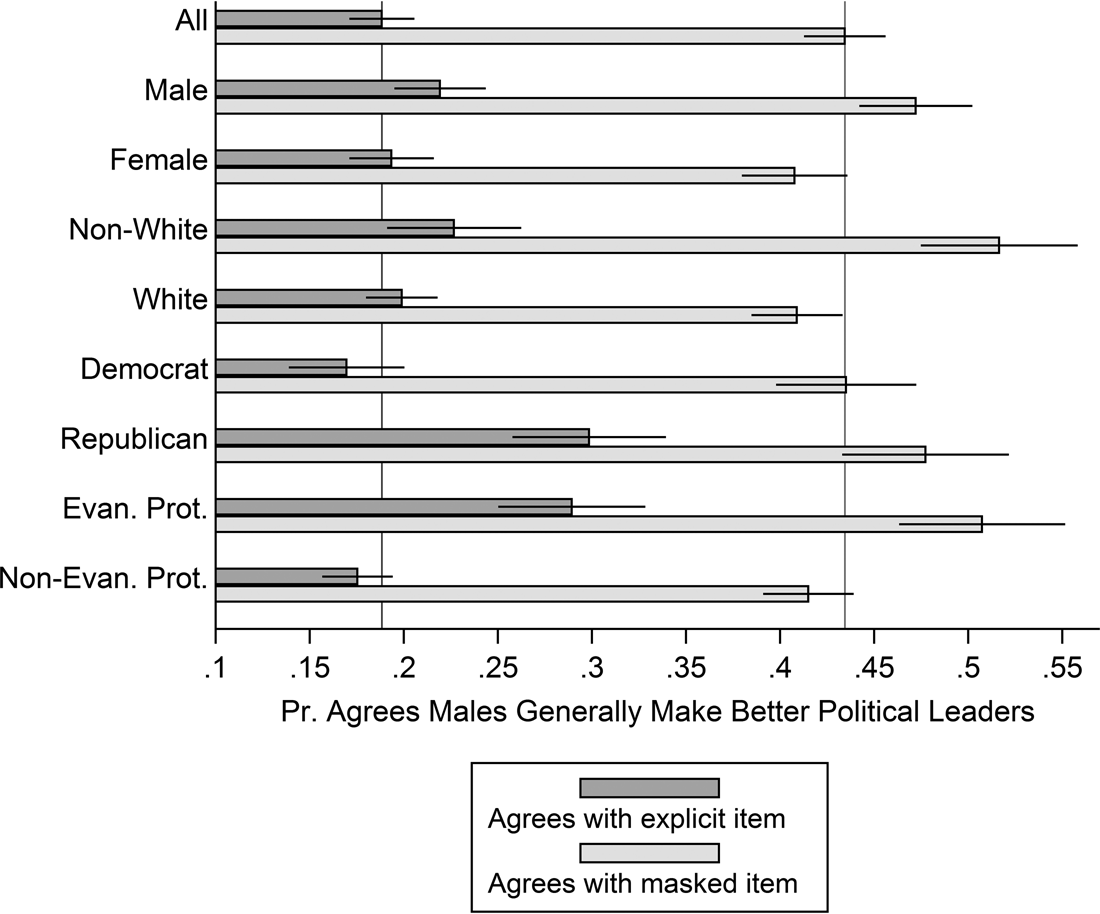
To aid in the interpretation of the first two regression models’ results, the plotted data in Figure 3 compare the predicted probabilities that persons who belong to different groups hold pro-male assumptions about leaders, depending on whether the explicit or masked measure is the dependent variable. The estimates confirm that systematic underreporting of gender bias is prevalent among Democrats, nonwhites, and men; however, across all of the groups considered, the typical person is much more likely to reveal a pro-male bias when responding to the masked measure. With the influence of each of variable held constant at their mean, the probability that a respondent said men make better political leaders was about 19%, while the probability of revealing bias for the masked measure of bias was over 43%. Among Democrats, after controlling for other factors, the gap across the two measures is even larger: 17% showed bias on the explicit measure versus 44% for the masked item.
The predicted probability of preferring male political leaders when responding to an explicit versus a masked survey question. Estimates shown by the bars were calculated with the models reported in Table 1. The lines on the bars are 95% confidence intervals; lines on the x-axis show predicted probabilities with all variables set at their mean.

The predicted probability estimates in Figure 3 also provide strong evidence that some types of individuals are considerably less likely than others to cloak their gender bias, a finding that has important implications for what we think we know about who is most likely to be prejudiced against female leaders. While the gap among Republican respondents’ answers for the two measures of bias is considerable, 30% versus 48%, that gap is about a third narrower than is the case with Democrats. A similar pattern is present when comparing evangelical Protestants to other respondents, with the former being quite a bit less likely cloak their bias on the explicit measure.
Previous studies of gender bias that rely exclusively on explicit measures of prejudice have reported that both Republicans and evangelical Protestants are disproportionately hostile to female politicians and that there is little difference between men and women when it comes to preferring male political leaders (e.g., Yanus and Setzler Reference Setzler and Yanus2016). Some of these findings can be called into question when tested with a bias question designed to reduce social desirability bias effects. Analyzing the explicit measure, the findings reported in the first regression model are in line with those reported in previously published findings, showing that Republicans are nearly twice as likely as unaffiliated individuals to admit that they see male leaders as superior. However, the second model demonstrates that Republicans are statistically indistinguishable from unaffiliated individuals when gender prejudice is measured with a modestly masked indicator. The predicted probabilities plotted in Figure 3 show that Democrats are not significantly less biased than Republicans on the masked measure.Footnote 5 Moreover, consistent with my second and third hypotheses, both males and nonwhite individuals are considerably more likely than women and white respondents to concur with the premise that males make better leaders when their pro-male bias is gauged with the masked measure instead of the explicit one.
The last two models in Table 1 test my third and fourth hypotheses by examining whether some types of individuals are more likely to express bias exclusively on the explicit or the masked measure. For the sake of interpretation and to more precisely test the relationship between party identification and disclosure of gender bias, I plot estimated marginal effects from the regression models’ results for each hypothesis’ key variables. In the left-hand panel of Figure 4, we see that nonwhites and men, but not Democrats (recalculated so that the figure compares them to Republicans and all other respondents as a single entity), are between 4 and 8 points more likely than whites or women to reveal their pro-male bias only on the masked item. The right-hand panel shows that evangelicals and Republicans (versus all non-Republicans) are modestly more likely to express a pro-male bias only when responding to the explicit measure; however, the regression models confirm that my fourth hypothesis is largely wrong. Specifically, there is no evidence supporting the idea that Republicans or evangelicals are strongly overstating their biases against female leadership in way that is similar to what researchers have found with the overreporting of nativist sentiments amount Republicans and the elderly (Knoll Reference Knoll2013).
The probability of different groups expressing bias only on the explicit or the masked measure of bias. The models used to calculate the estimates are reported in Table 1; however, to more precisely test Hypothesis 3, the partisan estimates in the left-hand panel compare Democrats to all other respondents; these estimates in the right-hand panel compare Republicans to non-Republicans. The lines on the bars are 90% confidence intervals.

State-Level Replication
The main argument examined in this study is that explicit survey questions lead to the underreporting bias against female political leadership. Moreover, the degree to which that bias is underreported is unequally distributed across political and demographic groups. To test the robustness of these arguments, I replicated the national-level analyses reported in Table 1 and Figure 3 using a 2013 survey of North Carolina. The state-level logistic regression model results are reported in a supplementary appendix online, and the probability estimates calculated from those models are plotted in Figure 5.
The predicted probability of North Carolinians favoring male political leaders when measured by an explicit versus a masked question. Estimates shown by the bars were calculated with the models reported in Appendix Table 1. The lines on the bars are 95% confidence intervals; lines on the x-axis show predicted probabilities with all variables set at their mean.

It is to be expected that the findings for North Carolina will not exactly mirror those for the United States as a whole because of important differences between the state's residents and the national population. North Carolina has a larger than average share of African American residents, and it has been a hotbed of civil rights activism in recent years. It also boasts an electorate that has been more inclined than those of many other states to elect women. In 2015, women held 55% of North Carolina's statewide elected executive positions, twice the typical rate for U.S. states as a whole (Institute for Women's Policy Research 2015, Table B1). North Carolina also is one of just a few states in recent elections to have elected a female governor as well as multiple U.S. congresswomen and female senators from both major parties.
Despite the differences between North Carolina and the country as a whole, the findings reported in Figure 5 reinforce the general finding that explicit questions asking individuals to directly state that they prefer male leaders consistently underreport bias against female leaders for a wide range of demographic and political groups. There also is evidence in the state-level data supporting my hypotheses that some types of individuals are less likely than others to disclose their concerns about female leadership, although none of the differences in the models reaches statistical significance because of the survey's small sample size. Consistent with the fact that women politicians of both parties are doing quite well in both congressional and state-level elections in North Carolina, a relatively small share of the state's residents—just 10% of respondents—directly stated that men make better political leaders. However, over a quarter of the same respondents agreed to that same premise by saying elsewhere in the survey that a reason for the underrepresentation of women in politics is that men make better political leaders.
DISCUSSION AND CONCLUSION
Much of what we know about the causes and effects of gender bias against women politicians comes from analyses of survey questions asking respondents to directly state or agree that they prefer leaders or politicians of a specific gender. The widespread use of this type of question by researchers largely reflects data availability issues: the best-known and most reliable sources of cross-national, time-series survey data on political attitudes and behaviors follow the lead of the World Values Survey by asking individuals how much they agree with the statement that “men make better political leaders than women.” As valuable as the surveys containing this question are, previous research on social desirability bias raises serious concerns about relying on overly direct questions to assess gender bias in politics. The main purpose of this study has been to analyze how response patterns differ when individuals are asked to verbally express their belief that males make superior leaders and then provided with an alternative, similarly worded item formatted to mask its purpose and to otherwise reduce social desirability bias.
My key finding is that the conventional manner of measuring prejudice against female political leadership seriously underreports the share of individuals who agree with the premise that men are superior political leaders. When gender bias is measured in a slightly less direct way than typically is the case, nearly half of the American public concurs with the idea that males are superior leaders. The analysis of a separate sample of North Carolina residents demonstrates that even in areas in which female politicians have made strong, highly visible gains in recent elections, a substantial share of the public still doubts the ability of women political leaders relative to their male counterparts.
While all groups considered by this study are more likely to reveal gender bias when responding to an item that reduces social desirability pressures, the underreporting of pro-male bias varies across demographic and political groups. Democrats and nonwhites are more likely than other Americans to profess a belief in gender equality; however, Democrats have similar rates of pro-male bias relative to other individuals when that bias is assessed in ways that make it less obvious that the respondent's prejudice is being measured. Similarly, nonwhites have low rates of bias when measured by the conventional measure but reveal disproportionately high rates of bias when measured less explicitly. These findings raise serious questions about a number of assumptions that have been broadly accepted in the gender and politics literature on the basis of research analyzing highly explicit bias questions. Most notably, the results here indicate that Republicans are not substantially more likely than other individuals to express a preference for male leadership when that bias is measured with questions designed to reduce social desirability effects. Similarly, men, Democrats, and especially nonwhites in the United States are considerably more biased against female political leadership than previous research has reported.
Third, even though some individuals are more likely than others to think that men make better political leaders, only a very small percentage of Americans exaggerate their gender bias even when they belong to political or religious groups that continue to raise objections against policies to enhance gender equality. As a point of comparison, Knoll's Reference Knoll2013 study of nativism found that older Americans and Republicans were 30 points less likely to express hostile attitudes toward immigrants when responding to a modestly masked but unambiguous question than when asked to verbally confirm their nativism. In short, they wanted to appear biased against immigrants because this was an expectation among their peers. In this study, even though evangelicals and Republicans were statistically a little more likely than other Americans to respond to the explicit measure by saying that they thought male leaders are superior, the percentage of individuals in these groups that expresses pro-male bias only on that measure is in the single digits.
Taken as a whole, my findings demonstrate that there is a low-cost way to administer surveys that will more accurately measure gender bias in politics. Specifically, using a face-saving frame, giving respondents a way to reveal their bias without admitting it directly, and distracting respondents by burying the key question in a short list of statements doubles the share of respondents acknowledging their preference for male leaders. Adding a single item to the national and international surveys that presently include only an explicit version of the “men make better leaders than women” item would provide an efficient fix to a serious methodological problem, and this approach is certainly cost and time effective when compared to the increasingly popular technique of using split-sample experiments, which requires larger respondent pools for the same statistical power.
In concluding, it is important to highlight some of the limitations of this study and their implications for future research. My analyses are all based on data collected by phone surveys, and it is possible that greater use of internet questionnaires will reduce the impact of social desirability bias on responses to sensitive questions, since respondents no longer will have to express their biases verbally to a human listener. Nevertheless, preliminary work from a survey fielded in 2017 indicates that the share of Americans who admit to preferring male political leaders in internet surveys is virtually identical to what has been reported in my analyses here.Footnote 6 Many of my findings also are preliminary with respect to their applicability beyond the United States. Social desirability effects vary by national and cultural contexts (Harkness, van de Vijver, and Mohler Reference Harkness, van de Vijver and Mohler2002), and it could be that social desirability effects are even stronger than what I find here for the many international surveys that use face-to-face interviews. More cross-national and comparative subnational research that includes both conventional and better masked measures of bias toward female political leaders will be required to better understand how widespread of a problem measurement issues may be outside of the American context. Finally, because this study focuses exclusively on attitudes about female political leadership, it does not contribute directly to research on reported behavior toward female politicians. Several recent studies have suggested that gender prejudice exerts a quite modest effect on voter support for women candidates in partisan races (e.g., Dolan Reference Dolan2014; Mo Reference Mo2015; Setzler and Yanus Reference Setzler and Yanus2015). Nevertheless, the serious underreporting of prejudice against female political leadership uncovered in this study may provide new insights into why so few women choose to run for elected office in the United States.
SUPPLEMENTARY MATERIAL
To view supplementary material for this article, please visit https://doi.org/10.1017/S1743923X18000430