





No CrossRef data available.
Article contents
If you can’t measure it, you can’t improve it: Practical tools to assess ventilation and airflow patterns to reduce the risk for transmission of severe acute respiratory syndrome coronavirus 2 and other airborne pathogens
Part of:
SARS-CoV-2/COVID-19
Published online by Cambridge University Press: 05 April 2022
Abstract
An abstract is not available for this content. As you have access to this content, full HTML content is provided on this page. A PDF of this content is also available in through the ‘Save PDF’ action button.
Information
- Type
- Commentary
- Information
- Creative Commons
- This is a work of the US Government and is not subject to copyright protection within the United States. Published by Cambridge University Press on behalf of The Society for Healthcare Epidemiology of America.
- Copyright
- © Department of Veterans Affairs, 2022
References
Ventilation in buildings. Centers for Disease Control and Prevention website. https://www.cdc.gov/coronavirus/2019-ncov/community/ventilation.html. Published 2021. Accessed March 16, 2021.Google Scholar
Huang, Q, Marzouk, T, Cirligeanu, R, Malmstrom, H, Eliav, E, Ren, YF. Ventilation assessment by carbon dioxide levels in dental treatment rooms. J Den Res 2021;100:810–816.CrossRefGoogle ScholarPubMed
Wargocki, P, Da Silva, NA. Use of visual CO2 feedback as a retrofit solution for improving classroom air quality. Indoor Air 2015;25:105–114.CrossRefGoogle ScholarPubMed
Haq, MF, Cadnum, JL, Carlisle, M, Hecker, MT, Donskey, CJ. SARS in cars: carbon dioxide levels provide a simple means to assess ventilation in motor vehicles. Pathog Immun 2022;7:19–30.CrossRefGoogle ScholarPubMed
Cadnum, JL, Alhmidi, H, Donskey, CJ. Planes, trains, and automobiles: use of carbon dioxide monitoring to assess ventilation during travel. Pathog Immun 2022. doi: 10.20411/pai.v7i1.495.CrossRefGoogle ScholarPubMed
Ha, W, Zabarsky, TF, Eckstein, EC, et al. Use of carbon dioxide measurements to assess ventilation in an acute-care hospital. Am J Infect Control 2022;50:229–232.CrossRefGoogle Scholar
Du, C, Wang, SC, Yu, MC, et al. Effect of ventilation improvement during a tuberculosis outbreak in underventilated university buildings. Indoor Air 2020;30:422–432.CrossRefGoogle ScholarPubMed
Somsen, GA, van Rijn, CJ, Bem, RA, Bonn, D. Measurement of small droplet aerosol concentrations in public spaces using handheld particle counters. Phys Fluids 2020;32:121707.CrossRefGoogle ScholarPubMed
Baudet, A, Baurès, E, Blanchard, O, Le Cann, P, Gangneux, JP, Florentin, A. Indoor carbon dioxide, fine particulate matter and total volatile organic compounds in private healthcare and elderly care facilities. Toxics 2022;10:136.CrossRefGoogle ScholarPubMed
Coyle, JP, Derk, RC, Lindsley, WG, et al. Efficacy of ventilation, HEPA air cleaners, universal masking, and physical distancing for reducing exposure to simulated exhaled aerosols in a meeting room. Viruses 2021;13:2536.CrossRefGoogle Scholar
Jones, LD, Chan, ER, Zabarsky, TF, et al. Transmission of SARS-CoV-2 on a patient transport van. Clin Infect Dis 2022;74:339–342.CrossRefGoogle ScholarPubMed
Kwon, KS, Park, JI, Park, YJ, Jung, DM, Ryu, KW, Lee, JH. Evidence of long-distance droplet transmission of SARS-CoV-2 by direct air flow in a restaurant in Korea. J Korean Med Sci 2020;35:e415.CrossRefGoogle Scholar
Lu, J, Gu, J, Li, K, et al. COVID-19 outbreak associated with air conditioning in restaurant, Guangzhou, China, 2020. Emerg Infect Dis 2020;26:1628–1631.CrossRefGoogle Scholar
Zaatari, M, Harmon, M. Open letter to address the use of electronic air cleaning equipment in buildings. https://medium.com/open-letter-to-address-the-use-of-electronic-air/no-to-ionizers-plasma-uvpco-bc1570b2fb9b.Google Scholar
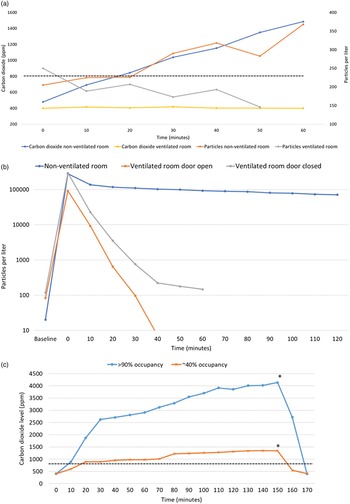
Fig. 1. Examples that illustrate the use of several tools to assess ventilation and airflow. (A) Increase in carbon dioxide levels in parts per million (ppm) and 1–10 µm diameter airborne particles in a nonventilated versus ventilated room (6 air changes per hour) occupied by 2 people. (B) Clearance of 5% sodium chloride solution aerosol particles (1–10 µm diameter) released into the nonventilated and ventilated rooms using a nebulizer. (C) Increase in carbon dioxide levels in parts per million (ppm) in a movie theater with >90% occupancy versus the same theater with ∼40% occupancy. Peak levels of carbon dioxide above 800 ppm (dotted lines) were considered an indicator of suboptimal ventilation for the number of occupants present. *, exiting the theater.
 You have
Access
- 11
- Cited by
One limitation of the coronavirus disease 2019 (COVID-19) pandemic response has been the lack of widely available, practical tools to measure factors, such as ventilation and airflow, that can impact transmission risk. The Centers for Disease Control and Prevention (CDC) has recommended that steps be taken to improve ventilation in healthcare facilities, schools, businesses, and households. 1 However, limited guidance has been provided on how to evaluate the adequacy of ventilation. To be useful in real-world settings, tools to assess ventilation must be inexpensive, safe, and easy to use. An ideal tool would provide rapid and easy-to-interpret results that could be used to identify areas with inadequate ventilation and to assess the impact of interventions.
One promising candidate as a practical tool to assess ventilation is carbon dioxide monitoring using inexpensive handheld devices that measure carbon dioxide concentrations. The concentration of carbon dioxide in outdoor air is ∼400 parts per million (ppm) versus ∼40,000 ppm in exhaled breath. Reference Huang, Marzouk, Cirligeanu, Malmstrom, Eliav and Ren2 Thus, carbon dioxide levels rise in occupied spaces that are inadequately ventilated. Reference Huang, Marzouk, Cirligeanu, Malmstrom, Eliav and Ren2 According to the CDC, carbon dioxide readings >800 ppm in buildings are an indicator of suboptimal ventilation requiring intervention. 1 Carbon dioxide monitoring has been used to assess ventilation and to identify measures to reduce risk in settings such as schools, university buildings, dental offices, motor vehicles, and hospitals. Reference Wargocki and Da Silva3–Reference Du, Wang and Yu7 The most important limitation of carbon dioxide monitoring is that it does not account for filtering of air. For example, carbon dioxide levels rise above 800 ppm in the cabin of airplanes both in flight and during boarding and deplaning, but the risk for viral transmission may remain low because the air conditioning system provides rapid recirculation of air through high-efficiency particulate air (HEPA) filters. Reference Cadnum, Alhmidi and Donskey5
Other potential tools to assess ventilation include handheld particle counters and devices that measure total volatile organic compounds. Reference Somsen, van Rijn, Bem and Bonn8,Reference Baudet, Baurès, Blanchard, Le Cann, Gangneux and Florentin9 In an assessment of ventilation in public spaces, the use of a particle counter to measure 1–10-µm diameter particles generated suggested adequate ventilation in most areas but not in a restroom, an elevator, or an unventilated living room. Reference Somsen, van Rijn, Bem and Bonn8 The major limitation of this method is that it can be nonspecific because nonrespiratory and respiratory particles are detected. Reference Somsen, van Rijn, Bem and Bonn8 Somsen et al Reference Somsen, van Rijn, Bem and Bonn8 recommended that particles <1 µm in diameter be excluded from measurements because this size range is typically due to dust particles. Although particles measuring 1–10 µm in diameter may represent aerosols produced by breathing, speaking, coughing, and sneezing, cooking or heating food in a microwave may generate large numbers of particles in this size range (authors’ unpublished data). Particle counters can be used to measure clearance of aerosol particles generated in an enclosed space using a nebulizer, although such measurements may be less practical in most settings. Reference Coyle, Derk and Lindsley10 Total volatile organic compounds provide an estimate of the chemical load in an indoor environment, and elevated levels may indicate insufficient ventilation. Reference Baudet, Baurès, Blanchard, Le Cann, Gangneux and Florentin9 In private healthcare and elderly care facilities, total volatile organic compound levels correlated well with carbon dioxide levels, with elevated measurements in dental treatment rooms and general practitioner’s offices. Reference Baudet, Baurès, Blanchard, Le Cann, Gangneux and Florentin9
In addition to ventilation, recent studies have highlighted the potential for patterns of airflow to contribute to long-distance dispersal of large and small droplets containing severe acute respiratory syndrome coronavirus 2 (SARS-CoV-2). Reference Jones, Chan and Zabarsky11–Reference Lu, Gu and Li13 In a patient transport van with the ventilation fan on, smoke released by a smoke-emitting pen flowed from the front to the back of the van and airflow transported both large (212–250 µm diameter) and small (1–5 µm diameter) fluorescent microspheres >3 m to the back of the van. Reference Jones, Chan and Zabarsky11 Contact tracing and sequencing demonstrated transmission of SARS-CoV-2 from 2 infected drivers to passengers in the back seat. Reference Jones, Chan and Zabarsky11 Handheld smoke or fog generators provide a simple means to assess direction of airflow in enclosed spaces. Fluorescent microspheres are also relatively easy to use and can be detected using an inexpensive black light, but there are potential safety concerns if dust is inhaled. In our experience, findings after release of commercial ultrafine glitter products correlate well with results obtained with fluorescent microspheres (authors’ unpublished data).
The figure provides examples that illustrate the use of tools to assess ventilation. Carbon dioxide levels and airborne particles 1–10 µm in diameter increased steadily over 1 hour in a nonventilated room occupied by 2 people but not in a ventilated patient room with 6 air changes per hour occupied by the same individuals (Fig. 1A). Aerosol particles released into the same rooms using a nebulizer cleared rapidly in the ventilated patient room, particularly when the door was open, but not in the nonventilated room (Fig. 1B). Finally, carbon dioxide levels increased to >4,000 ppm in a crowded movie theater with >90% occupancy, but only to a peak of 1,351 ppm in the same movie theater with 40% occupancy (Fig. 1C). These results are consistent with previous studies in which carbon dioxide levels similarly rose to high levels when areas such as hospital conference rooms and restaurants were crowded. Reference Cadnum, Alhmidi and Donskey5,Reference Ha, Zabarsky and Eckstein6
Examples that illustrate the use of several tools to assess ventilation and airflow. (A) Increase in carbon dioxide levels in parts per million (ppm) and 1–10 µm diameter airborne particles in a nonventilated versus ventilated room (6 air changes per hour) occupied by 2 people. (B) Clearance of 5% sodium chloride solution aerosol particles (1–10 µm diameter) released into the nonventilated and ventilated rooms using a nebulizer. (C) Increase in carbon dioxide levels in parts per million (ppm) in a movie theater with >90% occupancy versus the same theater with ∼40% occupancy. Peak levels of carbon dioxide above 800 ppm (dotted lines) were considered an indicator of suboptimal ventilation for the number of occupants present. *, exiting the theater.
In conclusion, the adage, “If you can’t measure it, you can’t improve it,” applies to efforts to improve ventilation to reduce risk for transmission of SARS-CoV-2 and other respiratory pathogens. Practical tools to measure ventilation and airflow are needed to determine whether interventions are required and to evaluate their effectiveness in community settings and in healthcare settings with lower standards for ventilation than hospitals (eg, nursing homes). In many cases, measurements may provide reassurance that ventilation is adequate, thereby reducing the potential for implementation of unnecessary, expensive, and potentially hazardous interventions. Reference Zaatari and Harmon14 Although further validation is needed, there is growing evidence that easy-to-use tools, such as handheld carbon dioxide monitors and particle counters, could provide useful information that can be used to measure and improve ventilation. Reference Huang, Marzouk, Cirligeanu, Malmstrom, Eliav and Ren2–Reference Somsen, van Rijn, Bem and Bonn8 Education and guidance regarding how the devices should be operated and how the results should be interpreted will be essential if such tools are to become more widely used.
Acknowledgments
We thank William Rutala, PhD, for helpful discussions.
Financial support
This work was supported by the Department of Veterans’ Affairs (Merit Review grant no. CX001848 to C.J.D.).
Conflicts of interest
C.J.D. has received research grants from Clorox, Pfizer, and PDI. J.L.C. reports no conflicts of interest relevant to this article.