Introduction
The use of reduced and conservation tillage in agroecosystems has grown dramatically since the mid-20th century owing to concerns that intensive tillage has adverse consequences for soil conservation, water quality and production costsReference Coughenour and Chamala1, Reference Triplett and Dick2. Tillage equipment, such as moldboard plows, inverts soil, and potentially buries surface residue, hastens erosion, depletes soil organic matter (SOM) and nitrogen (N), reduces structural and aggregate stability and reduces soil biodiversityReference Alvarez and Steinbach3–Reference Stinner and House13. One notable effect of inversion tillage is the loss of near-surface soil carbon (C), mainly from the labile (bioavailable) fractionReference Angers, Bissonnette, Légère and Samson14–Reference Six, Elliott and Paustian18. Reduced tillage (RT) is a compromise that may provide some weed suppression with fewer adverse effects on soil, as RT equipment such as chisel plows loosens soil without inverting it.
Organic management is an increasingly practiced form of sustainable agriculture that presents many perceived health, environmental and economical benefitsReference Dimitri and Greene19–Reference Lu, Teasdale and Huang25. Owing to the prohibition on the use of biocides, many organic farmers use inversion tillage (also referred to as full tillage) to control weedsReference Munro, Cook and Lee26–Reference Teasdale, Coffman and Mangum29. This reliance on full tillage (FT) is paradoxical, given the emphasis of organic agriculture on enhancing soil qualityReference Koepke27. Soil quality is often higher on organic than on conventional farms that use synthetic chemicalsReference Araújo, Leite, Santos and Carneiro30–Reference Erhart, Hartl and Lichtfouse36. Yet these benefits may depend on tillage practices, as soil comparisons between RT and FT plots on organically managed farmsReference Berner, Hildermann, Fließbach, Pfiffner, Niggli and Mäder37–Reference Lehocká, Klimeková, Bieliková and Mendel42 generally confirm discoveries from conventionally managed farms, cited above. The development of profitable organic systems that employ reduced or zero tillage thus remains a critical goal in sustainable agricultureReference Teasdale43–Reference Schmidt47.
Crop rotation is another weed control strategyReference Teasdale, Beste and Potts48 that affects soil attributes. Many rotations include cover crops that create surface residue, reduce erosion, suppress weeds, improve soil physical structure, build nutrient and SOM pools, and attract beneficial mesofaunaReference Pimentel, Harvey, Resosudarmo, Sinclair, Kurz, McNair, Crist, Shpritz, Fitton, Saffouri and Blair33, 49–Reference Havlin, Kissel, Maddux, Claassen and Long52. Each cover crop species (or species mixture) provides these multiple services to varying degrees, resulting in different effects on soil structure, hydrology and biogeochemistryReference Kuo, Sainju and Jellum53. Cover cropping strategy could thus be an additional factor in tests of RT on organically managed farms.
Reduced tillage, cover cropping and organic management are all important strategies for improving soil quality. Integrating the three can be challenging, however, particularly during the transition to organic production when growers often experience pest emergence, high weed growth and reduced yieldsReference Ngouajio and McGiffen54, Reference Zinati55. In this paper, we compare soil quality in different tillage (RT versus FT) and cover crop (annual grain versus mainly perennial forage) treatments during the 3-year transition period required for organic certification in the USA. Our primary focus was on the response of labile C in soil because it is often used as a metric of soil qualityReference Wander, Traina, Stinner and Peters35, Reference Mirsky, Lanyon and Needelman56, Reference Weil, Islam, Stine, Gruver and Samson-Liebig57, is directly linked to plant-available nutrient turnoverReference Kaye and Hart58 and is a sensitive indicator of management impacts on soil C sequestrationReference Cole, Duxbury, Freney, Heinemeyer, Minami, Mosier, Paustian, Rosenberg, Sampson, Sauerbeck and Zhao59, Reference Islam and Weil60.
We predicted that relative to RT, FT would result in soils with less labile C, because soil inversion enhances decompositionReference Reicosky and Archer61 and reduces capture of new organic CReference Six, Elliott and Paustian62. With respect to cover crops, we expected labile C to be greater in the perennial forage treatment than in the annual grain treatment since the perennial system forms sod. We expected cover crop effects to diminish as the experiment progressed, because we only included cover crops during the first growing season. We sampled soil for other chemical and hydrological metrics of soil quality that are known to affect crop yield. Based on previous studiesReference Pekrun, Kaul, Claupein and El Titi63, we expected these other metrics also to increase under RT relative to FT, as FT may mobilize soluble, charged constituents in leachateReference Duiker and Beegle64–Reference Mathers and Nash66, and reduce water-holding capacity owing to SOM loss. Finally, we link our soil quality results with companion studies from the same plotsReference Jabbour and Barbercheck67–Reference Smith, Jabbour, Hulting, Barbercheck and Mortensen69 to develop an agroecosystem management perspective that considers how tillage affected soils, weed growth, pest biocontrol agents, crop yield and profitability.
Methods
Site
The field experiment was conducted at the Russell E. Larson Agricultural Research Center near Rock Springs, PA, USA (lat. 40.712°, long. −77.944°, 350 m elevation), with a continental climate of 975 mm mean annual precipitation and mean monthly temperatures ranging from 3°C (January) to 22°C (July). Summer precipitation (April–August) during 2004–2007 was 659, 333, 420 and 425 mm, respectivelyReference Smith, Jabbour, Hulting, Barbercheck and Mortensen69, compared with a long-term average of 483 mm (1953–2007, State College weather station, National Climatic Data Center). Soils are Hagerstown silt loam (fine, mixed, semi-active, mesic, Typic Hapludalf) and Murrill channery silt loam (fine-loamy, mixed, semi-active, mesic Typic Hapludult). During the preceding 3 years, the site had been managed non-organically with a tomato–wheat rotation, with tomatoes grown in the year before our experiment began. Previous management included only non-organic crop production since the 1960s, when the land was purchased from a local farmer.
Experimental design
The experiment was managed according to US organic certification regulations70, and was conducted during the 3-year period from terminating conventional management to receiving organic certification. The 3-year rotation comprised cover crops in year 1, soybean (Glycine max (L.) Merr.) in year 2 and maize (Zea mays L.) in year 3. The 2×2 factorial design crossed two tillage approaches with two first-year cover crop mixtures. The two tillage approaches were RT with a chisel plow that disturbed (but did not invert) soil to a depth of 15 cm, versus FT with a moldboard plow that fully inverted the top 23 cm of soil. In both tillage treatments, soil was further disturbed to a depth of 2–6 cm with a rotary hoe, and 7–10 cm with a field cultivator. The RT–FT contrast was first imposed during the switch from cover crops to soybean. The two cover crop mixtures were an annual group comprising rye (Secale cereale L.) followed by hairy vetch (Vicia villosa Roth), versus a mainly perennial group comprising timothy (Phleum pratense L.), oat (Avena sativa L.) and red clover (Trifolium pretense L.). The cover crop contrast was only imposed in the first rotation year, although its effect on soil attributes is examined for all three years.
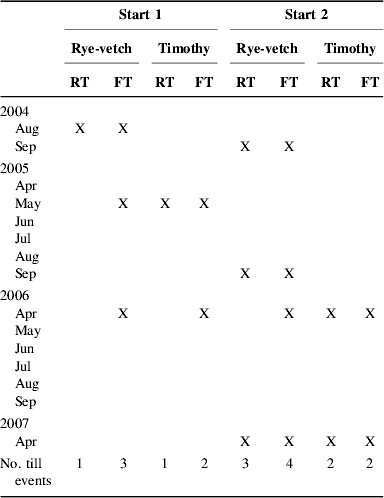
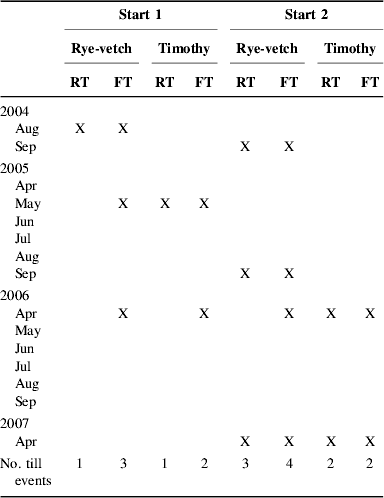
The experiment was established twice, first in autumn 2003 (Start 1), and again in autumn 2004 (Start 2) in an adjacent field. The three growing seasons for Start 1 were 2004–2006, and for Start 2 were 2005–2007. In the year (2004), before initiating Start 2, the Start 2 field was planted with timothy, oats and red clover. Start 2 was tilled more often than Start 1 owing to difficulties controlling perennial weeds; nevertheless, the FT plots were tilled more frequently and more intensely (deeper and with soil inversion) than were the RT plots in both starts (Table 1). Smith et al.Reference Smith, Barbercheck, Mortensen, Hyde and Hulting68 provide a schedule of additional farm operations including seedbed preparation, sowing, and harvesting.
Schedule and number of tillage operations in each combination of start, cover crop and tillage regime. Each tillage event is denoted by an X. (Rye-vetch, initial cover crop of rye followed by vetch. Timothy, initial cover crop mixture of timothy grass, oats and clover. RT, reduced tillage with chisel plow. FT, full tillage with moldboard plow.)
In October 2003, liquid dairy manure was applied at a rate of 4480 kg ha−Reference Coughenour and Chamala1, and lime was applied at 1120 kg ha−Reference Coughenour and Chamala1. Liquid manure fertilizer at this research center is typically 8.2% solids by mass, and has elemental concentrations by wet mass of 0.4% N, 0.05% phosphorus (P) and 0.3% potassium (K). Compost (grass clippings, leaves and food waste) with 78% solids and elemental concentrations by wet mass of 2% N, 0.4% P and 0.9% K was added in the autumn of rotation year 1 at a rate of 17,920 kg ha−Reference Coughenour and Chamala1. Finally, in March of rotation year 3, bedded cattle manure with 38% solids and elemental concentrations by wet mass of 0.5% N, 0.2% P and 0.5% K was applied to Start 1 at a rate of 46,063 kg ha−Reference Coughenour and Chamala1, and to Start 2 at 32,199 kg ha−Reference Coughenour and Chamala1.
The field for each experimental start was organized in a randomized complete block design with one replicate of each treatment in each of four blocks (n=4 treatments×4 blocks=16 plots per start). The block array was perpendicular to the boundary separating the Hagerstown and Murrill portions of the fields. Each replicate (plot) measured 24 m×27 m (0.065 ha). The combined area of the two starts was surrounded by a 7-m wide grassy border that was routinely mowed. To ensure relevance to organic feed-grain cropping systems typical of the Mid-Atlantic region, a farmer advisory board composed of local growers helped to guide the crop sequence and management decisions throughout the experiment.
Soil sampling
We collected two sets of soil samples, one for quantifying chemical and hydrological metrics of soil quality, and one for quantifying soil bulk density. In the first set, we sampled each plot in the fall of year 0 prior to implementing experimental field treatments, and then four times per year (May, June–July, August, and September–October) during each rotation year. On each sampling date, we collected three composite samples from each plot. Each composite comprised 15 cores (each 2.5 cm diameter×15.2 cm deep) taken around a random point and thoroughly mixed by hand. Each composite sample underwent laboratory analyses, and the data were then averaged across composites prior to statistical analysis, yielding n=1 value per plot and date for each soil attribute. To estimate soil bulk density, our second set of samples was volumetrically collected with a hammer core from the 0–10, 10–20 and 20–30 cm depth ranges on two occasions: at the end of rotation year 1 and at the end of rotation year 3. On each date, soil was collected from two random locations per plot, again with data averaged to the plot level, yielding n=1 bulk density value per plot and depth on each date.
Laboratory soil analyses
The first sample set was analyzed for soil quality metrics. Labile C, gravimetric soil moisture and matric potential were expected to be dynamic, and were thus quantified for each of the 12 collection dates during rotation years 1–3. We expected less temporal variability from other soil attributes, and so they were quantified for fewer dates. Base cations, SOM, cation-exchange capacity (CEC), pH and bioavailable phosphorus (Pav) were analyzed on May samples only, whereas electrical conductivity was analyzed from mid-summer (June–July) and autumn (September–October) samples only. Soil pH was additionally analyzed on the final samples collected in autumn of year 3. Concentrations of zinc (Zn) and copper (Cu) were determined only from samples collected in May of rotation year 3. A subset of these soil attributes was quantified from the initial pre-experiment samples collected in the fall of year 0.
We define labile C as organic C oxidized by a permanganate solutionReference Weil, Islam, Stine, Gruver and Samson-Liebig57. For each sample, we combined 5 g of air-dried, sieved (2 mm) soil with 20 ml of a permanganate solution. The permanganate solution contained 0.02 M potassium permanganate (KMnO4) and 0.1 M calcium chloride (CaCl2), and was adjusted to pH>7.2 using sodium hydroxide (NaOH). After shaking and settling the soil–permanganate slurry, 0.2 ml of supernatant was thoroughly mixed with 9.8 ml of deionized (DI) water. This diluted supernatant was read spectrophotometrically (Spectronic 21 D, Milton Roy), and the reduction of permanganate was quantified as the decline in light absorbance at 550 nm. We assumed that 9 mol of organic C were oxidized for every 1 mol of permanganate reduced.
Soil matric potential was determined using a filter paper methodReference Hamblin71. Oven-dried filter paper (Whatman no. 42) of known mass was sealed for 48 h in a plastic bag containing 250 ml of soil. The moisture-equilibrated filter paper was then recovered, cleaned and reweighed to obtain filter percent water, which was converted to matric potential following the relationship ln Ψm=−2.397−3.683 ln F, where F is the gravimetric water content of the filter paperReference Hamblin71. Gravimetric soil moisture was quantified as mass loss on drying at 45°C for 72 h divided by dry soil mass.
To determine concentrations of Pav, K, magnesium (Mg), calcium (Ca), Zn and Cu, soil was extracted with a Mehlich 3 solutionReference Mehlich72, Reference Wolf, Beegle, Sims and Wolf73, and extractant filtrate was subsequently analyzed with inductively coupled plasma spectrometry at the Agricultural Analytical Services Laboratory (AASL) of The Pennsylvania State University (University Park, PA, USA). CEC was determined by summation of K, Mg, Ca and exchangeable acidityReference Ross, Sims and Wolf74. Estimation of SOM followed the AASL protocol. Mass loss on ignition (LOI) was first determined by igniting soil at 360°C for 2 h, and a regression equation was then used to convert LOI to SOM. The regression equation relates LOI to independent estimates of SOM, which are determined by a Walkley–Black procedure that oxidizes organic C with potassium dichromate (K2Cr2O7) in an acidic solutionReference Schulte, Sims and Wolf75, Reference Schumacher76. Conductivity and pH were determined with appropriate probes inserted into the supernatant of slurries (1 soil:2 deionized water for conductivity, 1:1 for pH) that had been shaken and centrifuged.
Data analyses
Data analyses considered soil conditions before, throughout and at the end of the 3-year experiment. To describe initial conditions, we used multivariate analysis of variance (MANOVA) to compare Starts 1 and 2 with respect to soil attributes observed before our experiment (autumn of year 0) and at its beginning (May year 1). Data were next analyzed with repeated-measures ANOVA (rmANOVA) to determine the interactive effects of tillage, cover crop and start on soil attributes throughout the 3-year period. Between-subjects effects tested for treatment effects (with statistical power dictated by the number of plots), whereas within-subjects effects tested whether any treatment effects varied through time (with statistical power dictated by the total number of observations). A between-subjects test is analogous to determining whether the temporal average in a repeatedly observed response variable (e.g., labile C) differs between two treatment levels (e.g., RT versus FT). A between-subjects test might thus fail to detect responses that only emerge in the final year (particularly responses to tillage, which had no RT–FT contrast until after year 1). Therefore, to assess the final outcome of the experiment, we used ANOVA to analyze treatment effects on soil observations made on single dates in the third rotation year.
To test the hypothesis that labile C was more likely to accumulate under RT than under FT (and to quantify any accumulation rates), we used multiple linear regression to model labile C as an interactive function of tillage and time (time quantified as day number of experiment, equal to 0 on January 1 of rotation year 1). We predict a significant tillage×time interaction, with a more positive regression slope for RT than for FT. This analysis was conducted separately for each start, owing to the disparate behavior of the two starts in the rmANOVA (see Results section).
We used forward stepwise discriminant analysis to determine whether the eight combinations of tillage, cover crop and start could be discriminated by soil variables. This analysis tests whether different farming systems produce different multivariate soil environments. Soil variables available for input included gravimetric soil moisture, matric potential, labile C, SOM, Pav, Ca, Mg, K, pH and conductivity; inclusion of a variable required an F-to-enter=3. This analysis used data from May (or from June–July for conductivity) and was conducted separately for each rotation year.
Results
Initial conditions—difference between starts
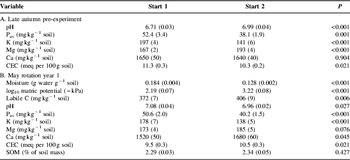
The two starts exhibited different initial conditions. In autumn of rotation year 0, acidity, Pav, K and CEC were greater in Start 1; Mg was greater in Start 2; and Ca did not differ between starts (Table 2). In May of rotation year 1, gravimetric moisture, Pav and K were greater in Start 1; matric potential, labile C, acidity, Mg, Ca and CEC were greater in Start 2; and SOM did not differ between starts.
Initial soil conditions in each experimental start. (A) Late autumn of the year prior to the initiation of the experiment. (B) May of rotation year 1. Cell values in the ‘Start’ columns are means (and standard errors of the means). Standard errors and P values are based on n=32 plots, with 16 plots in each start. P values compare means between starts.

CEC, cation-exchange capacity; SOM, soil organic matter.
Labile C
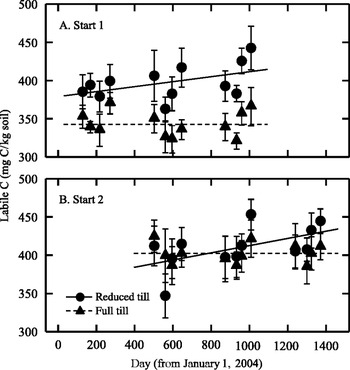
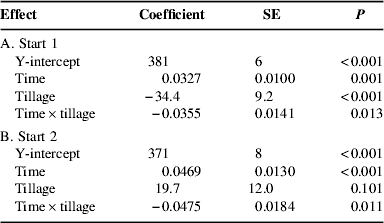
Under RT, labile C increased in the first start by 32.7 μg C kg−1 dry soil per day, and increased in the second start by 46.9 μg C kg−1 dry soil per day (Fig. 1, Table 3). Thus, with RT used for 3 years, labile C increased 47.8 and 68.5 mg kg−1 soil in Starts 1 and 2, respectively, equivalent to 12.7 and 19.0% increases above initial labile C. By contrast, labile C did not change through time under FT (Table 3). By the end of the experiment (October of year 3), labile C was 14.3% higher under RT than under FT (Table 4).
Means and 95% confidence intervals (error bars) of labile C in Start 1 (panel A) and Start 2 (panel B) for each tillage treatment on each day of observation. In each start, regression slopes significantly differ from zero under RT but not under FT (see Table 3).

Output from the regression model of labile C as an interactive function of time (day of experiment) and tillage. Separate models were fit for each start.
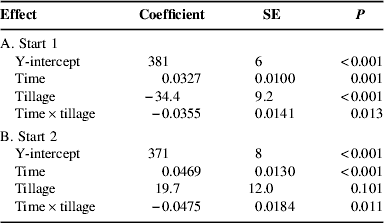
Note: Tillage was an increment parameter (RT=0, FT=1). Thus, for RT, labile C (mg C kg−1 soil) at day zero is the coefficient for Y-intercept, while labile C accumulation rate [mg C (kg soil×day)−1] is the coefficient for time. For FT, labile C at day zero is the sum of the Y-intercept and tillage coefficients, while the labile C accumulation rate is the sum of the time and time×tillage coefficients. Day zero is January 1, 2004 for Start 1 and January 1, 2005 for Start 2. The significant time×tillage coefficient means that the FT treatment has a different slope (labile C accumulation rate) than does the RT treatment. Since RT and FT have different slopes, the significance of the tillage coefficient (the RT–FT difference on day zero) depends entirely on which day is arbitrarily chosen as ‘day zero’. The ANOVA (Table 4) and rmANOVA (Table 5) models should be referred to for tests of a first-order tillage effect.
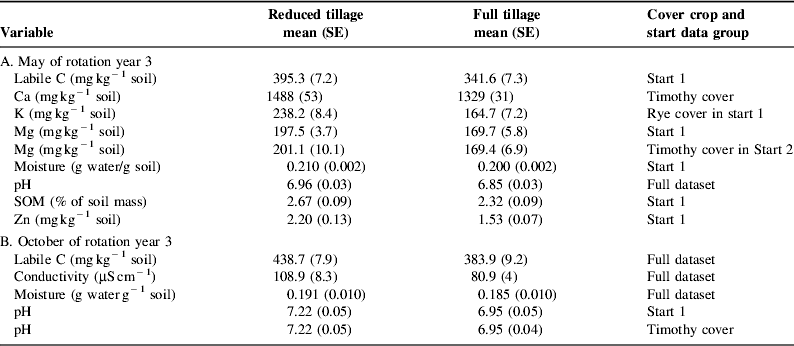
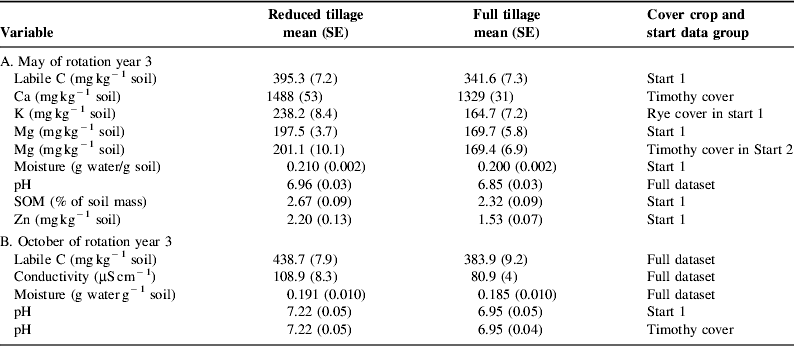
Means (and standard errors) of soil attributes compared between RT and FT in rotation year 3. The table lists variables that demonstrate a significant response to tillage by the third rotation year, and indicates the start and cover crop combination in which the tillage effect was significant.
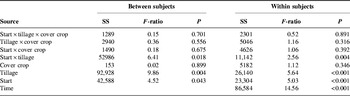
The rmANOVAs support this observation that tillage effects on labile C became more evident through time. When data are aggregated across the 3-year trial, labile C was greater under RT than under FT in Start 1, but was similar between RT and FT in Start 2 (significant between-subjects start×tillage interaction; Table 5). Taking averages across time hides important trends, however. Labile C increased through time under RT but not under FT (significant within-subjects tillage effect), and was consequently greater under RT than under FT by the end of the experiment in both starts. Labile C did not respond to the main effect of cover crop or to its interactions with start and tillage, either across repeated-measures (Table 5) or in analyses of data from single time points in the final rotation year (ANOVA P>0.1).
Repeated measures analyses of labile C (mg C kg−Reference Coughenour and Chamala1 dry soil) as an interactive function of start, tillage, and cover crop.

Note: For each source, residual degrees of freedom equal 1 in the between-subjects analyses and equals 11 in the within-subjects analyses. F-ratios were calculated using partial (type two) sum of squares. Sample size=32 experimental field plots, with each plot sampled 12 times (four times per year over three consecutive rotation years).
SOM and nutrients
We analyzed several other soil attributes to provide a fuller measure of soil response to field management. Many of them were elevated under RT versus FT by the third rotation year in at least one of the starts or cover crop treatments (Table 4). Yet, because these tillage effects took time to develop, they were not evident when data were aggregated across the 3-year experiment (insignificant between-subjects effects in rmANOVA models). Rather than show tables of rmANOVA model output, therefore, the few significant effects are reported in the text below.
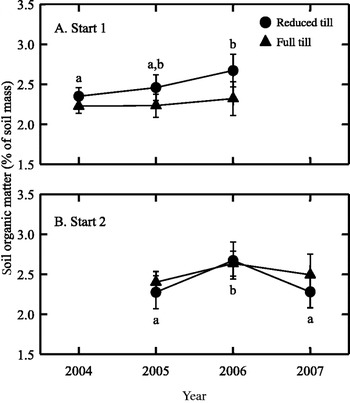
SOM dynamics were affected by tillage in Start 1, but not in Start 2. In Start 1, SOM rose monotonically from years 1 to 3 under RT, but remained flat under FT, approximating labile C dynamics (Fig. 2). In Start 2, however, SOM in both tillage treatments rose from rotation years 1 to 2 but fell again by year 3. This sensitivity of SOM to tillage in Start 1, but not in Start 2, was evident across repeated measures (between-subjects start×tillage interaction P=0.006), and in May of the final rotation year (Table 4). Cover crop had no effect on SOM across repeated measures or on SOM concentrations in the final rotation year.
Means and 95% confidence intervals (error bars) of SOM in Start 1 (panel A) and Start 2 (panel B), in May of the indicated years. Letters denote statistical comparisons among years for the RT treatment (circles). There were no significant differences among years for the FT treatment (triangles). A comparison between RT and FT is reported in the text.

By the third year of the trial, base cations were greater under RT than under FT in many combinations of start and cover crop (Table 4). Mg was about 18% greater under RT than under FT in Start 1 and in the timothy cover crop treatment in Start 2. Ca was 12% greater under RT than under FT in the timothy cover crop treatment, but did not differ between tillage treatments in the rye cover crop treatment. Finally, K was 45% greater under RT than under FT in the rye cover crop treatment in Start 1, but did not differ between tillage treatments for the other combinations of cover crop and start. Differences between RT and FT were less evident with base cation data aggregated across repeated measures. Soil K was greater in Start 1 than in Start 2 (between-subjects start effect P<0.001). Additionally, K was greater under RT than under FT in Start 1 (reduced-till K=186.6±4.1 mg kg−Reference Coughenour and Chamala1 soil; full-till K=165.6±6.4; ANOVA F 1,14=7.69, P=0.015, n=16 plots), but did not differ between RT and FT in Start 2 (P=0.7). Otherwise, no base cation responded to the tillage or cover crop treatments with data aggregated across repeated measures (between-subjects tillage and cover crop effects P>0.05).
Soil Pav did not respond to tillage, cover crop or their interactions, either when viewed across repeated measures (between-subjects P>0.05) or when analyzed on single-time points in rotation year 3. However, Pav was higher in Start 1 (mean±SE=50.3±1.3 mg Pav kg−Reference Coughenour and Chamala1 soil) than in Start 2 (37.8±1.2 mg Pav kg−Reference Coughenour and Chamala1 soil; between-subjects start effect P<0.001), consistent with the different initial conditions (Table 2).
Soil conductivity, pH, bulk density and water
Soil conductivity and pH were both greater under RT than under FT by the end of the trial (Table 4). In both May and October of rotation year 3, pH was 0.1–0.2 pH units greater (roughly half to three-fourths as much soluble acidity) under RT than under FT in all treatment combinations, except in the rye cover crop treatment in Start 2 in October. Conductivity was 34.6% higher under RT than under FT by October of year 3. These responses to tillage were not evident until the end of the trial, however. In the repeated measures analyses, tillage and cover did not have significant main or interactive effects on conductivity and pH (between-subjects P>0.05). Soil bulk density was greater in Start 1 than in Start 2 (1.51 versus 1.45 g dry soil cm−3; SE=0.01; P=0.021), but did not respond to tillage or cover crop in any combination of start, year and depth.
Soil moisture conditions differed little between tillage treatments by the end of the trial. Across repeated measures, mean matric potential fluctuated from −79 to −4199 kPa (within-subjects time P<0.001), but showed no directional or seasonal trend. Where soil matric potential responded to treatments, it was generally stronger in Start 2 than in Start 1 (between-subjects start P<0.001), and where timothy rather than rye served as the first-year cover crop (between-subjects cover crop P<0.001). These treatment effects were not evident at most time points considered individually, however, as start and cover crop exhibited significant within-subjects effects (P<0.05). Gravimetric soil moisture generally mirrored matric potential. It varied through time from 118 to 221 mg water per gram dry soil (within-subjects time P<0.001), yet showed no directional trends. Moisture was generally greater in Start 1 than in Start 2 (between-subjects start P<0.001), and was greater in the rye than in the timothy rotation (between-subjects cover crop P<0.001). Again, such patterns were not evident at most time points, as start and cover exhibited significant within-subjects effects (P<0.01). By the final time point in the experiment, moisture was 3% greater under RT than under FT (Table 4). Lastly, in analyses of single time points in rotation year 3, no soil attributes exhibited a response to the main effect of the cover crop.
Discriminating farming systems
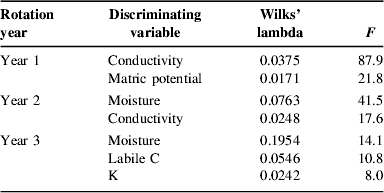
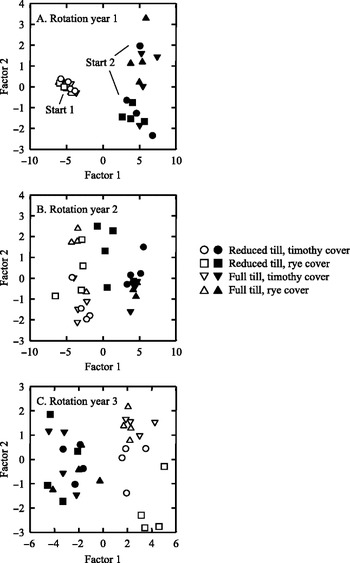
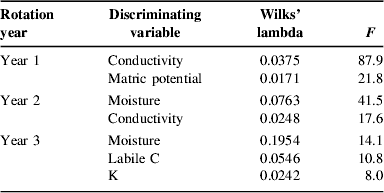
In each rotation year, the discriminant analysis identified two or three soil variables that discriminated the eight start/tillage/cover crop combinations (Table 6). The canonical variables (factors) created by these soil attributes were 100% successful in classifying plots according to their start. Within a start, however, these factors were poor at classifying plots according to their tillage/cover crop treatment. In rotation years 1 and 3, only 12 of the 32 plots were classified in their correct tillage/cover crop treatment; in rotation year 2, only 13 of the 32 plots were classified correctly.
Soil attributes included in the forward stepwise analysis, listed in order of importance. The hypothesis that these soil attributes could discriminate treatment groups (start/tillage/cover crop combinations) was supported, as Wilks’ lamba, Pillai's trace, and the Lawley–Hotelling trace all had P<0.001 in each rotation year.
The starts were clearly distinguished from one another along the first factor (Fig. 3). In contrast, the cover crop and tillage treatments were not distinguished. This first factor was vastly more important than the second factor; the eigenvalues for factor 1 were 33, 17 and 11 in rotation years 1–3, respectively, compared with much smaller eigenvalues for factor 2 of 0.7, 1.3 and 1.4 in the same years. Moreover, the proportion of among-group dispersion for which factor 1 was responsible was 98, 93 and 86% for rotation years 1–3, respectively. The F statistics to test the equality of group means were much larger when comparing across starts than among treatments within a start. For example, in the first rotation year, the full till/rye plots of Start 1 looked much different from their counterparts in Start 2 (F 2,23=104) than they did from other till/cover combinations in Start 1 (F 2,23<1).
Factor scores from discriminant analysis of eight treatment groups (two starts×two tillage levels×two cover crops), discriminated with forward stepwise inclusion of soil attributes observed at the beginning of three consecutive rotation years. A separate discriminant analysis was conducted for each year. Three canonical variables were created in the analysis of year-3 data; only the first two are displayed here. Note that a given factor is not comparable among years, as it comprises different variables in different years.

Discussion
Soil response to tillage
Our results indicate that growers transitioning to organic production may be able to build soil quality while pursuing limited tillage activities. During this 3-year experiment, labile soil C increased ~15% under RT with chisel plowing. This accumulation of labile C likely provides a host of agronomic and ecological benefits. Soil labile C regulates N availability to plants, limits N leaching loss by acting as a substrate for heterotrophic metabolism and N immobilizationReference Kaye, Binkley, Zou and Parrotta77, and according to mass balance represents reduced net carbon emission from the biologically active C pool. Although Start 2 did not exhibit higher labile C under RT across all time points (rmANOVA results), this outcome resulted from low labile C in the RT plots on one date in rotation year 1 (Fig. 1B), before the tillage treatments were imposed. By the end of year 3, labile C was greater under RT than under FT for both starts. It seems encouraging that full inversion tillage did not further deplete labile C, because soil inversion was a successful weed control tacticReference Smith, Barbercheck, Mortensen, Hyde and Hulting68. Yet, simply maintaining a dynamic equilibrium at 350–400 mg labile C per kg soil might be viewed as insufficient, as other Pennsylvania farms exhibit >1000 mg labile C per kg soil when quantified using the same laboratory protocolReference Weil, Islam, Stine, Gruver and Samson-Liebig57. Labile C probably failed to accumulate under FT because soil inversion permits the loss of organic C by destroying soil macroaggregatesReference Six, Elliott and Paustian62 and stimulating respirationReference Reicosky and Archer61.
SOM concentrations corroborate the trends in labile C (accumulation in RT but not FT) in Start 1, but tillage had no effect on SOM in Start 2. The inconsistency between starts may have derived from two methodological differences. One, the Start 2 field experienced 2 years of cover cropping prior to implementing the RT versus FT contrast, so it may have been relatively insensitive to tillage during rotation years 2 and 3. Two, the plots in Start 2 were tilled more often than the plots in Start 1 were (Table 1), and this extra cultivation may have inhibited SOM accumulation. Both of these explanations, while plausible, must be viewed with some skepticism because they are inconsistent with the fact that tillage had strong effects on labile C in both starts. Rather, a longer experiment, or more frequent sampling with observations at the end of growing seasons (SOM was only observed each May), may have revealed a more pronounced effect of tillage on SOM. Furthermore, because most SOM is recalcitrant (labile C<2% of SOM), tillage may affect SOM less than it affects labile C.
The relatively low levels of pH, conductivity and several Mehlich 3-extractable elements (K, Mg, Ca and Zn) under FT by the third rotation year are consistent with previous findingsReference Pekrun, Kaul, Claupein and El Titi63. Tillage may reduce available binding sites or stimulate ion exchange that replaces base cations with other cations, such as H+, consistent with the lower pH under FT. Gravimetric soil moisture may be slightly lower under FT than under RT owing to a reduction in pore space and loss of water retention capacityReference Vogeler, Rogasik, Funder, Panten and Schnug78. Increases in any of these soil quality metrics would be evident both per unit soil mass and per unit area of field because bulk density was not affected by tillage.
Soil response to cover crop
Owing to its potential for greater biomass production, we expected that the rotation initiating with a sod-forming perennial cover crop mixture (timothy, oat and red clover) would have greater SOM and labile C than the rotation initiating with annual grain cover crops (rye followed by hairy vetch). Yield data contravened these expectations, however, as timothy harvest was 115% of rye harvest in Start 1, but only 30% of rye harvest in Start 2Reference Smith, Barbercheck, Mortensen, Hyde and Hulting68. Correspondingly, no soil chemical attributes differed between the two initial cover crop treatments. Hydrological attributes (gravimetric moisture and matric potential) did differ between cover crop treatments, but only at a limited subset of observation times. In the final-year analyses, no soil attributes differed between the cover crop treatments. This lack of differences by the end of the experiment may reflect that the crop rotations were identical in years 2 and 3, and is consistent with our prediction that the effects of the first year cover crop would be less or not evident late in the experiment. Research in a California vineyard similarly observed that different cover crop systems did not have disparate effects on measured soil properties, despite having strong effects on weed productivity and diversityReference Baumgartner, Steenwerth and Veilleux79.
Start effect—role of initial conditions and weather
Start had a pervasive influence in our experiment. Between the two starts, soil attributes often had different mean values, had different temporal dynamics or exhibited inconsistent responses to tillage (with Start 1 but not Start 2 showing a tillage effect). This influence of start may result from differences between the starts in initial soil conditions (Table 2), itself perhaps due to the extra cover crop year in Start 2. The influence of start may also result from differences between starts in precipitation regime. Owing to interannual variability in summer precipitation, the cover crop, soybean and maize years were, respectively, wet, dry and normal in Start 1, while they were dry, normal and normal in Start 2.
We are not able to determine why the Start 1 and Start 2 fields had different initial conditions, and it is beyond our scope to determine whether different initial conditions or precipitation regimes truly did cause different behaviors between the starts during the ensuing 3 years. Nevertheless, our results do raise the consideration that initial conditions and weather may render the outcomes of management treatments unpredictable. Our duplicate experiments were conducted on adjacent fields, were temporally offset by only 1 year, and were conducted on fields that had previously been consolidated under homogeneous management. Thus, the ‘different’ contexts of our two experiments were actually quite similar, and yet we still observed inconsistent tillage effects on the soil attributes reported here, and on weed, soil biota, yield and profitability metrics reported by othersReference Jabbour and Barbercheck67–Reference Smith, Jabbour, Hulting, Barbercheck and Mortensen69. This cautionary note is important, because scientists and practitioners may typically wish to generalize across much more disparate contexts.
Interestingly, the starts may have been converging while the treatments were slowly diverging. The discriminant analysis indicated that the eigenvalue for factor 1 (the ‘start-discriminating’ factor) declined with time, as did the proportion of among-group dispersion for which factor 1 was responsible. And, the average F-statistic to compare the same tillage/cover crop strategy between starts declined through time (95, 47 and 22 in rotation years 1, 2 and 3, respectively). Within at least Start 1, meanwhile, the plots had begun to separate into tillage groups by year 3 (note open triangles in Fig. 3C).
Agroecosystem management implications
Our results demonstrate that reduced tillage results in soils with greater labile C (Fig. 1) and some other soil quality metrics (Table 4) that are representative of yield and nutrient cycling. These benefits of reduced tillage for soil quality on transitioning farms need to be placed into a broader agroecosystem perspective, and here we briefly summarize companion research that considers tillage effects on weed pressure, biological control agents, crop yield and profitability in our experiment.
Reduced and full tillage performed similarly at suppressing emergence of annual weed seedlings from experimentally sown seedsReference Smith, Jabbour, Hulting, Barbercheck and Mortensen69. The density of weeds emerging from the existing seed bank, however, was 82% greater under RT than under FT during the second-year soybean phase of Start 1, and about 244% greater under RT than under FT during the third-year maize phase of both startsReference Smith, Barbercheck, Mortensen, Hyde and Hulting68. Another chisel-plowed, organic feed-grain system in our Mid-Atlantic region similarly experienced high weed emergenceReference Teasdale, Coffman and Mangum29. Tillage may also influence insect pests through direct effects on soil-dwelling biological control agents. The entomopathogenic fungus Metarhizium anisopliae is one such control agent that was prevalent in our plots. Final M. anisopliae counts at the end of year 3 were higher under FT than under RT in Start 1, possibly owing to preferentially lower moisture or higher spore mobility in disturbed soil, but counts did not differ between tillage treatments in Start 2Reference Jabbour and Barbercheck67.
While RT in our experiment was superior for promoting soil quality and inferior for controlling weeds and conserving a biological control agent, these outcomes do not collectively translate into substantial effects on yield and profitability. Soybean yields in both starts, and maize yields in Start 2, were not affected by tillageReference Smith, Barbercheck, Mortensen, Hyde and Hulting68. Tillage had a muted effect, at most, on profitabilityReference Smith, Barbercheck, Mortensen, Hyde and Hulting68. Net returns were significantly higher under RT for soybeans and under FT for maize in Start 1. The 3-year cumulative net returns were not significantly affected by tillage in either start. Of the eight farming systems (two starts×two tillage strategies×two cover crop regimes), the 3-year cumulative net returns were positive in five. The three negative returns were associated with rye cover crop, not tillage strategy. These returns did not include organic price premiums, and could have been universally higher and positive with the use of manure rather than expensive compost fertilizerReference Smith, Barbercheck, Mortensen, Hyde and Hulting68. Collectively, this experiment indicates that with wise use of cover crops and cost-effective fertilizer, organically managed feed-grain farms in the Mid-Atlantic can use RT to build soil quality (primarily labile C and base cations) during the transition period and still remain profitable over these three years.
Acknowledgements
We thank Christina Mullen, Cathy Nardozzo and David J. Sandy for technical assistance, and Richard G. Smith and Tara Pisani Gareau for helpful comments on an earlier version of the manuscript. Funding was provided by the Organic Agriculture Research Initiative of the USDA (Grant no. 03-4619).