INTRODUCTION
Forest fragmentation can be a natural or anthropogenic process resulting in the formation of isolated forest patches immersed in a matrix with a different plant composition (Laurance Reference LAURANCE1990, Laurance & Bierregaard Reference LAURANCE and BIERREGAARD1997, Lovejoy et al. Reference LOVEJOY, BIERREGAARD, RYLANDS, MALCOLM, QUINTELA, HARPER, BROWN, POWELL, POWELL, SCHUBART, HAYS and Soule1986). One of the most important threats to global diversity, anthropogenic forest fragmentation, exposes the organisms that remain in the fragment to the often hostile conditions of the ecosystem matrix (Laurance & Peres Reference LAURANCE and PERES2006, Murcia Reference MURCIA1995). At the present rate of forest fragmentation, it is not difficult to predict that in a few decades most of the world's tropical forests will consist of small, isolated fragments; thus, it is crucial to determine the extent to which an isolated fragment can sustain representative diversity (Laurance Reference LAURANCE1991).
Most studies have assessed the effect of habitat fragmentation on diversity measured as taxonomic diversity (Fahrig Reference FAHRIG2003). However, taxonomic diversity is far from synonymous with biodiversity because it conveys little to no information about the functional role or the evolutionary history of species in a community (Swenson Reference SWENSON2011). A more accurate assessment of diversity can be achieved by studying simultaneously the three main components of diversity: taxonomic, functional and phylogenetic diversity (Swenson Reference SWENSON2011). Functional diversity can be defined as a variety of life-history traits presented by an assemblage of organisms (Mayfield et al. Reference MAYFIELD, BONI, DAILY and ACKERLY2005), and is critical to the maintenance of ecosystem processes (Hooper & Vitousek Reference HOOPER and VITOUSEK1997, Tilman & Downing Reference TILMAN and DOWNING1994, Tilman et al. Reference TILMAN, KNOPS, WEDIN, REICH, RITCHIE and SIEMANN1997). Phylogenetic diversity describes the total phylogenetic distance among species in a community (Faith Reference FAITH1992) and provides a measure of future biodiversity (Faith et al. Reference FAITH, MAGALLÓN, HENDRY, CONTI, YAHARA and DONOGHUE2010). Although a few studies have looked at the effects of tropical forest fragmentation on functional (Girão et al. Reference GIRÃO, LOPES, TABARELLI and BRUNA2007, Santos et al. Reference SANTOS, PERES, OLIVEIRA, GRILLO, ALVES-ACOSTA and TABARELLI2007) and phylogenetic plant diversity (Arroyo-Rodríguez et al. Reference ARROYO-RODRÍGUEZ, CAVENDER-BARES, ESCOBAR, MELO, TABARELLI and SANTOS2012, Santos et al. Reference SANTOS, ARROYO-RODRÍGUEZ, MORENO and TABARELLI2010) separately, we do not know of any study assessing the effects of fragmentation on these three main components of plant diversity simultaneously.
Previous studies looking at the impact of forest fragmentation on functional (Girão et al. Reference GIRÃO, LOPES, TABARELLI and BRUNA2007, Santos et al. Reference SANTOS, PERES, OLIVEIRA, GRILLO, ALVES-ACOSTA and TABARELLI2007) and phylogenetic diversity (Arroyo-Rodríguez et al. Reference ARROYO-RODRÍGUEZ, CAVENDER-BARES, ESCOBAR, MELO, TABARELLI and SANTOS2012, Santos et al. Reference SANTOS, ARROYO-RODRÍGUEZ, MORENO and TABARELLI2010) of tropical plants have focused only on the recent effects of forest fragmentation (40- to 200-y-old fragments). However, many of the consequences require a sufficient relaxation period, with communities passing through a series of transitional states before final equilibrium conditions are reached (Helm et al. Reference HELM, HANSKI and PÄRTEL2006, Terborgh et al. Reference TERBORGH, LOPEZ, TELLO, YU, BRUNI, Laurance and Bierregaard1997, Tilman et al. Reference TILMAN, MAY, LEHMAN and NOWAK1994). In this sense, naturally fragmented ecosystems offer an enormous advantage over human-created fragmented forest because they have been fragmented for thousands or millions of years (Montiel et al. Reference MONTIEL, ESTRADA and LEÓN2006, Watson & Peterson Reference WATSON and PETERSON1999).
In this study we compared taxonomic, functional and phylogenetic diversity between a continuous and an adjacent naturally fragmented forest (1.7 My old; CONANP-SEMARNAT 2006). Our objective was to compare the three main components of plant diversity between the continuous and fragmented forests to infer the potential effects of long-term forest fragmentation on plant diversity. We predict lower taxonomic, functional and phylogenetic diversity in the fragmented forest relative to that of the continuous forest because previous studies have shown that many plant species disappear from fragmented forest, especially emergent trees and shade-tolerant species (Laurance et al. Reference LAURANCE, DELAMONICA, LAURANCE, VASCONCELOS and LOVEJOY2000, Tabarelli et al. Reference TABARELLI, PERES and MELO2012). Furthermore, species inhabiting fragments are more heavily influenced by the environmental filters imposed by the matrix (high radiation, heat, desiccation, etc.). As a result, plant assemblages in the fragments may become dominated by pioneer-like species sharing functional traits such as fast growth and high light demand (Laurance et al. Reference LAURANCE, NASCIMIENTO, ANDRADE, FEARNSIDE, RIBEIRO and CAPRETZ2006), which would result in low functional diversity. Finally, as the traits that make plants more prone to extinction can be phylogenetically non-random (Vamosi & Wilson Reference VAMOSI and WILSON2008), entire clades could be lost, thus reducing phylogenetic diversity.
METHODS
Study area
The study area is a belt of narrow vegetation (90°20’–90°29’ W) located along the western coast of the Yucatan Peninsula (Rico-Gray Reference RICO-GRAY1982). The weather is warm sub-humid with seasonal rains (June–September), precipitation is 1000–1200 mm y−1 and mean temperature is 26.1–27.8°C (Durán Reference DURÁN1987a, Zamora Reference ZAMORA1999). The northern and central part of this region (20–21°N, c. 130000 ha) has circular and semi-circular fragments of distinctive vegetation (i.e. taller and more diverse) scattered throughout a matrix of wetlands with variable salinity levels (Barrera Reference BARRERA1982). Locally, these fragments are called petenes and may represent a system endemic to this region (Rico-Gray Reference RICO-GRAY1982). The vegetation is on Quaternary geological formations of approximately 1.7 My (CONANP-SEMARNAT 2006). It is believed that the higher elevation of these forested fragments relative to the matrix explains their presence, along with the fact that they usually have a permanent freshwater supply from a sinkhole (cenote) located in the centre of each fragment (Barrera Reference BARRERA1982, Rico-Gray Reference RICO-GRAY1982). In the southern part of this region (19–20°N; c. 1000 ha) the forest becomes continuous. This area is a nature reserve under government protection and no activity that is incompatible with conservation is allowed.
Vegetation of the fragments and in the continuous forest is mainly dry and semi-evergreen tropical forest, with Manilkara zapota, Metopium brownei, Bursera simaruba as the dominant trees, while Bravaisia tubiflora and Sabal yapa dominate the understorey (Durán Reference DURÁN1987a, Reference DURÁNb, Rico-Gray Reference RICO-GRAY1982, Zamora Reference ZAMORA1999). Some fragments may also be dominated by tall mangrove trees such as Laguncularia racemosa and Avicennia germinans (Durán Reference DURÁN1987a, Reference DURÁNb). In the fragmented forest the matrix is dominated by shorter mangroves (Rhizophora mangle, Conocarpus erectus) sedges (Eleocharis cellulosa and Cladium jamaicense) and cattails (Typha dominguensis) (Durán Reference DURÁN1987a, Reference DURÁNb; Rico-Gray Reference RICO-GRAY1982).
Field work and sampling design
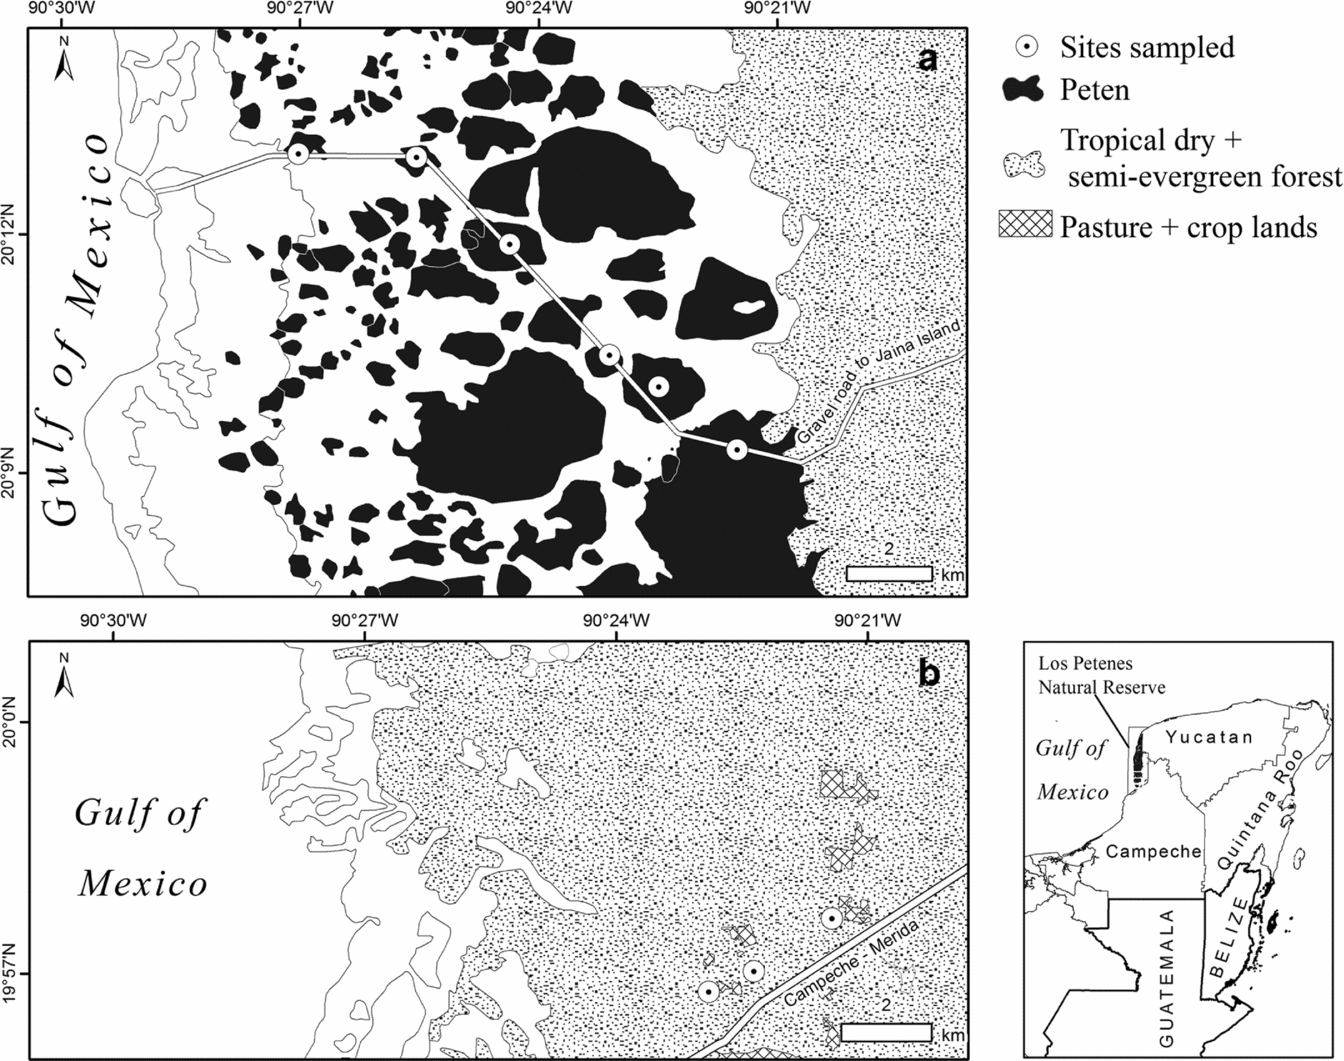
We selected a representative section (20°07′–20°14′ N; 90°20′–90°29′ W) of the fragmented forest where a gravel road provided access to seven forest fragments (Figure 1a). A representative section (19°54′–20°00′ N; 90°20′-90°29′ W) of the continuous forest was also delimited (Figure 1b). These were sampled from January to August 2013 using belt transects (50 × 4 m = 200 m2). In the fragmented forest a group of three transects (20 m apart) was set up per fragment in six different fragments (18 transects in total, equivalent to 3600 m2) (Figure 1a). Transects in this forest were not set up in randomly selected fragments because only a small number of fragments (n = 7) were accessible. No more than three transects were placed in each fragment owing to their small size. Five or six transects were systematically placed in the continuous forest (20 m apart and in a previously defined direction) at three different random points (16 transects in total, equivalent to 3200 m2) (Figure 1b). More sampling points were placed in the fragmented forest than in the continuous forest owing to the small size of the fragments.
Map of the fragmented forest (a) and the continuous forest (b). Continuous forest is shown in the dotted pattern and vegetation fragments (petenes) are in black. There were more transects per sampling site in the continuous forest (5–6) than in the vegetation fragments (3) owing the limited size of the latter. Details of the position of the two polygons and the nature reserve on the Yucatan Peninsula are also shown.

To assess plant species richness and abundance, all plants with a girth larger than 5 cm (dbh = 1.6 cm) were recorded. Epiphytes, lianas, aquatic and secondary vegetation were not included in the vegetation survey because of the difficulties recording their abundance and obtaining information about their functional traits. For all plants recorded, dbh and life form were taken in situ. Unidentified species (n = 4 species) were morphotyped.
Species richness and taxonomic diversity
To assess the representativeness of observed species richness relative to expected richness we built species accumulation curves for the two landscapes using the random method with 1000 permutations (Gotelli & Colwell Reference GOTELLI, COLWELL, Magurran and McGill2011). Additionally, we calculated one incidence-based (Chao2) and two abundance-based (Chao1, ACE) species richness non-parametric estimators following the suggestion of Hortal et al. (Reference HORTAL, BORGES and GASPAR2006) who recommended the use of several estimators together. As the forests differ moderately in the number of individuals sampled, we compared species richness using individual-based rarefaction curves (Gotelli & Colwell Reference GOTELLI, COLWELL, Magurran and McGill2011). Species similarity between the two forests was assessed with Sørensen's similarity index. Taxonomic species diversity was assessed with the effective number of species or true diversity (Jost Reference JOST2006), and species evenness with Pielou's index. All analyses were run in R3.0 software using the Vegan package (Dixon Reference DIXON2003).
Functional traits and functional diversity
Leaf functional traits (dry mass, punch strength, size, specific area and thickness) were recorded for at least two healthy, unshaded adults from 28 different species (Cornelissen et al. Reference CORNELISSEN, LAVOREL, GARNIER, DÍAZ, BUCHMANN, GURVICH, REICH, TER STEEGE, MORGAN, VAN DER HEIDEN, PAUSAS and POORTER2003). Additionally, maximum plant height for these 28 species were obtained from local floras (Brokaw et al. Reference BROKAW, BONILLA, KNAPP, MACVEAN, ORTÍZ, PEÑA-CHAMORRO, PÖLL and TUN-GARRIDO2011, Pennington & Sarukhán Reference PENNINGTON and SARUKHÁN2005) and herbarium specimens, or measurements were taken in the field (shorter species only). For leaf traits five intact, fully exposed leaves (except understorey species) were collected per plant species. Species for which fewer than two individuals were accessible to collect samples were not included in the analysis. We obtained all functional traits for 25 and 22 species in the continuous and in the fragmented forest respectively. The abundance of all these species together represents 94% and 98% of all plants recorded in the continuous and the fragmented forest respectively. Leaf dry matter content was estimated as the dry weight of a previously dried leaf. Punch strength was measured as the weight needed for a 1-mm-diameter metal cylinder to penetrate a leaf. Leaf thickness was measured on fresh leaves with a digital caliper. Specific leaf area was measured as the one-side area of a fresh leaf with a foliar area meter (LI-COR LI-3000A) divided by its dry mass. The functional traits chosen are related to the environmental filters we believe are relevant in the study system. Leaf dry mass and plant height are negatively associated with environmental disturbances (Cornelissen et al. Reference CORNELISSEN, LAVOREL, GARNIER, DÍAZ, BUCHMANN, GURVICH, REICH, TER STEEGE, MORGAN, VAN DER HEIDEN, PAUSAS and POORTER2003), leaf size is negatively associated with environmental stress (e.g. heat, drought, high radiation; Cornelissen et al. Reference CORNELISSEN, LAVOREL, GARNIER, DÍAZ, BUCHMANN, GURVICH, REICH, TER STEEGE, MORGAN, VAN DER HEIDEN, PAUSAS and POORTER2003), leaf punch strength is positively associated with resistance to biotic damage (e.g. herbivores; Coley Reference COLEY1983, Feeny Reference FEENY1970), leaf thickness is positively correlated with thermal buffering and photosynthetic compound content (Niinemets Reference NIINEMETS2001), and specific leaf area is positively correlated with nutrient/light availability in wetlands (Balun Reference BALUN2011).
Using the species-by-trait matrix we calculated some multidimensional functional diversity indices. The first metric calculated was Rao's quadratic entropy, which is the sum of the distances between pairs of species in a functional space weighted by the product of their abundance. This index was standardized by dividing the distance by the maximum possible distance so this index is bounded to a maximum of 1 (Botta-Dukát Reference BOTTA-DUKÁT2005). Also, we calculated a group of three metrics: functional richness, evenness and divergence, which describe independent and complementary components of functional diversity (Mouchet et al. Reference MOUCHET, VILLEGÉR, MASON and MOUILLOT2010, Villéger et al. Reference VILLÉGER, MASON and MOUILLOT2008). Functional richness was measured as convex hull volume and represents the functional space occupied by a species assemblage. In contrast to functional evenness and functional divergence, functional richness cannot account for species abundance (Villéger et al. Reference VILLÉGER, MASON and MOUILLOT2008). Functional richness was standardized by the global functional richness that includes all species, so that functional richness is constrained between 0 and 1. Functional evenness combines both the evenness of species spacing in a functional trait space and the evenness of species abundance; this index is 1 if all species have equal abundance and tends to zero as unevenness increases (Villéger et al. Reference VILLÉGER, MASON and MOUILLOT2008). Functional divergence is the degree to which the most abundant taxa are away from the centroid of the functional trait space and is high when the most abundant species have extreme values (Villéger et al. Reference VILLÉGER, MASON and MOUILLOT2008). Finally, we calculated per-trait community-level abundance-weighted and unweighted means using untransformed trait values to assess which traits are different between forests and whether any differences detected are attributable to abundance (change in weighted mean) or species turnover (change in unweighted means). This metric expresses the dominant trait value in the community (Lavorel et al. Reference LAVOREL, GRIGULIS, MCINTYRE, WILLIAMS, GARDEN, DORROUGH, BERMAN, QUÉTIER, THEBAULT and BONIS2008).
Phylogenetic diversity
We first obtained a complete species list with the families following APG III (2009). Morphotyped species were excluded from the list because their phylogenetic position could not be accurately resolved. A fern, a bromeliad and one sedge species were also excluded because these would contribute disproportionately to phylogenetic diversity metrics owing to the low relatedness to the majority of species, as recommended by Arroyo-Rodríguez et al. (Reference ARROYO-RODRÍGUEZ, CAVENDER-BARES, ESCOBAR, MELO, TABARELLI and SANTOS2012). Finally, the species list comprised 31 species in the continuous forest and 24 species in the fragmented forest, with only four and five species excluded for the fragmented and the continuous forest respectively. We created a time-calibrated phylogeny (in millions of years) using the PHYLOMATIC function of Phylocom 4.1 (Webb et al. Reference WEBB, ACKERLY and KEMBEL2008) based on the dated tree from Davis et al. (Reference DAVIS, BARRACLOUGH, CHASE, SOLTIS, SOLTIS and SAVOLAINEN2004) for seed plants. The phylogeny obtained was rooted, completely dichotomous and ultrametric.
We uploaded the phylogeny into R 3.0 software and calculated the abundance-weighted version of the following metrics using the Picante package (Kembel et al. Reference KEMBEL, COWAN, HELMUS, CORNWELL, MORLON, ACKERLY, BLOMBER and WEBB2010): phylogenetic diversity, mean phylogenetic distance (MPD), mean nearest taxon phylogenetic distance (MNTD), net relatedness index (NRI) and nearest taxon index (NTI). Phylogenetic diversity is the sum of all branch lengths on the phylogenetic tree (Faith Reference FAITH1992). MPD is the average pairwise distance between each of the species in the phylogeny (Vamosi et al. Reference VAMOSI, HEARD, VAMOSI and WEBB2009). MNTD is the mean distance between each species in the phylogeny and its most closely related species in the community (Vamosi et al. Reference VAMOSI, HEARD, VAMOSI and WEBB2009). MPD and MNTD are complementary metrics to phylogenetic diversity. While the latter gives us an idea of the total branch length in the phylogeny of the community, together MPD and MNTD give an idea of how phylogenetically clustered the species in the community are (Webb et al. Reference WEBB, ACKERLY, MCPEEK and DONOGHUE2002). NRI and NTI are standardized MPD and MNTD respectively and thus, are easier to interpret than original values. Positive values of NRI and NTI indicate terminal and familial phylogenetic clustering respectively while negative values represent phylogenetic overdispersion (Webb et al. Reference WEBB, ACKERLY, MCPEEK and DONOGHUE2002). All of these metrics are measured in millions of years except NRI and NTI, which are in units of standard deviation. For all the metrics mentioned above (except NRI and NTI) standard error was calculated after 999 randomizations.
RESULTS
Taxonomic diversity
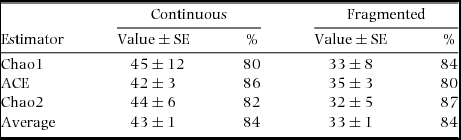
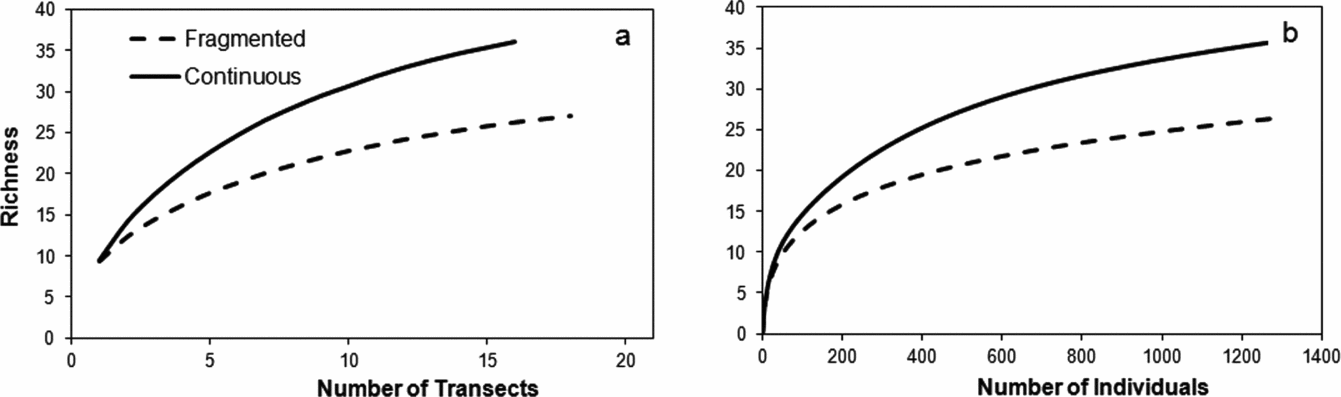
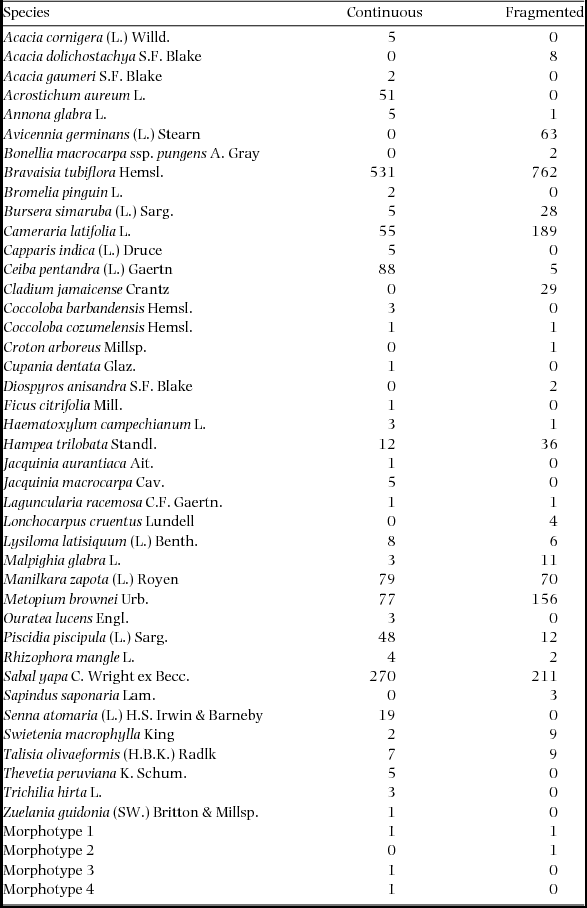
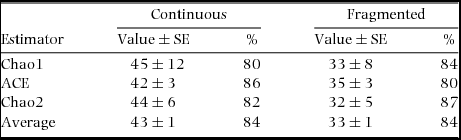
The species accumulation curve reached its asymptote in the fragmented forest, and nearly reached the asymptote in the continuous forest (Figure 2a). A total of 36 and 28 species were recorded in the continuous and the fragmented forest respectively (Appendix 1). The communities of the two forests had a similarity of 60% (Sørensen) in species composition. Richness estimated by non-parametric estimators averaged 43 ± 1 (hereafter mean ± 1 SE) species in the continuous forest; thus, the percentage represented by observed richness is 84% (Table 1). The fragmented forest's estimators suggested, on average, a species richness of 33 ± 1; therefore, observed species richness also represents 84% (Table 1). According to rarefaction curves, the forests started becoming evidently different, in terms of species richness, after 100 individuals with maximum differences occurring when 1305 individuals had been collected, the point at which we expected to find 36 ± 0.2 species in the continuous forest and only 26 ± 1.1 species in the fragmented forest (Figure 2b). True diversity (1D) was 35% greater in the continuous forest (1D = 8.17) than in the fragmented forest (1D = 6.05). Pielou's evenness for the continuous forest (0.6) was 20% greater than that of the fragmented forest (0.5).
Values of three asymptotic richness estimators (value ± SE) and the percentage represented by the observed species richness (%) for a continuous and a fragmented forest on the Yucatan Peninsula, Mexico. Averages are given at the foot of the table.
Species accumulation curve (a) and rarefaction curve (b) for plants in a continuous and a fragmented forest of the Yucatan Peninsula. Species accumulation curves were based on data from transects, while rarefaction curves were generated based on the number of individuals.
Functional diversity
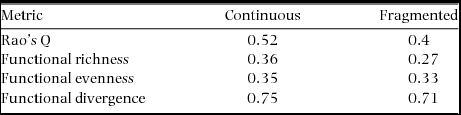
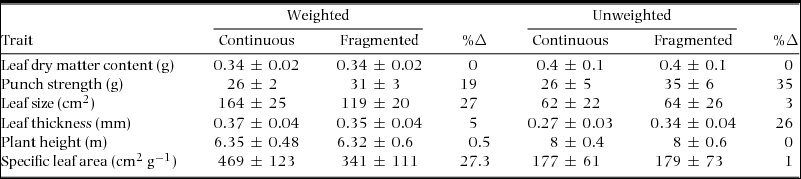
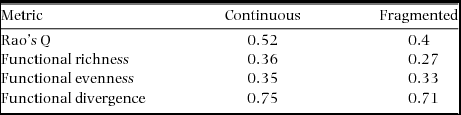
Functional richness (33%), Rao's Q (11%), functional evenness (6%) and functional divergence (6%) were all greater in the continuous forest than in the fragmented forest (Table 2). For abundance-weighted means, the greatest differences between continuous and fragmented forest were found for leaf size (27% greater in continuous forest) and leaf punch strength (19% lower in continuous forest). Although a large difference between forests was found for specific leaf area (27.3%), there was a big overlap in standard errors (Table 3). The rest of the traits (dry matter content, leaf thickness and plant height) showed only minor differences between forests (0–5%; Table 3). The greatest differences in unweighted means between the continuous and fragmented forests were recorded for leaf punch strength (35% lower in the continuous forest) and leaf thickness (26% lower in the continuous forest), while there was only minimal variation (1–3%) in the remaining traits (dry matter content, leaf size, plant height and specific leaf area) (Table 3).
Functional diversity measured as Rao's quadratic entropy (Rao's Q), functional richness, functional evenness and functional divergence of plants in a continuous and a fragmented forest on the Yucatan Peninsula, Mexico.
Community-level abundance-weighted and unweighted means (± 1 SE) of plant functional trait values (Trait) in a continuous and a fragmented forest on the Yucatan Peninsula, Mexico. The percentages of change in values (continuous vs. fragmented; %∆) are also shown for weighted and unweighted means.
Phylogenetic diversity
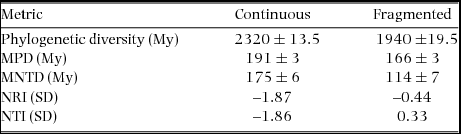
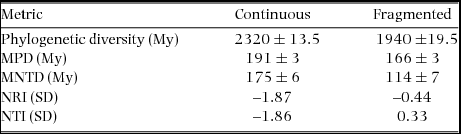
MNTD (54%), phylogenetic diversity (19%) and MPD (15%) were all greater in the continuous than in the fragmented forest (Table 4). NRI was negative and substantially lower (325%) for the continuous forest than for the fragmented forest (Table 4). Finally, NTI went from slightly positive (0.33) in the fragmented forest to negative (−1.86) in the continuous forest (Table 4).
Phylogenetic diversity, mean phylogenetic distance (MPD), mean nearest taxon distance (MNTD), net relatedness index (NRI) and nearest taxon index (± 1 SE) in a continuous and a fragmented forest. Phylogenetic diversity, MPD and MNTD are in millions of years (My) and NRI and NTI are in standard deviations of MPD and MNTD, respectively.
DISCUSSION
The results of our study show that all three of the main components of plant diversity – taxonomic, functional and phylogenetic diversity (Swenson Reference SWENSON2011) – are consistently lower in the fragmented forest relative to the continuous forest. We will elaborate on the mechanisms which could explain the observed negative effects of forest fragmentation on each component of plant diversity.
Although the number of species reported in the continuous (36) and fragmented (28) forest are apparently low, the fact that the cumulative species curves nearly reached their asymptotes and that we recorded 84% of species predicted by the estimators makes us think that species richness is well represented (with the exception of epiphytes and lianas, which were not included in our sampling). Previous studies had reported that plant species richness in the study area was low compared with that of other tropical forests in Mexico (Durán Reference DURÁN1987a); however, this can be considered an additional advantage of using this area as a study model to look at the effects of forest fragmentation on plant diversity because less sampling effort is needed to obtain a good representation of plant diversity. It is not surprising that taxonomic diversity was lower in the fragmented forest because it is well known that tropical forest fragmentation negatively affects plant population size, reduces dispersal (pollen and propagules), and exposes individuals on the edge to the inhospitable environmental conditions prevailing in the matrix (Laurance & Bierregaard Reference LAURANCE and BIERREGAARD1997). Although previous work has suggested that plant species richness may respond slowly to forest fragmentation (Helm et al. Reference HELM, HANSKI and PÄRTEL2006), most studies have looked at plant taxonomic diversity in recently formed fragments (Arroyo-Rodríguez et al. Reference ARROYO-RODRÍGUEZ, PINEDA, ESCOBAR and BENÍTEZ-MALVIDO2008). Therefore, a major contribution of our paper is that we assessed taxonomic plant diversity in a forest which has been fragmented for very long time (1.7 My).
Similar to taxonomic diversity, all functional diversity metrics were lower in the fragmented than in the continuous forest. Functional richness, evenness and divergence are complementary metrics which give us an idea about the size and configuration of the functional space of a community (Villéger et al. Reference VILLÉGER, MASON and MOUILLOT2008). Our results suggest that the functional space occupied is larger (i.e. greater functional richness), more evenly distributed (i.e. greater functional evenness), and the distance from the most abundant taxa to the centroid of the functional space is greater (i.e. greater functional divergence) in the plant community of the continuous forest than it is in the community of the fragmented forest. Rao's quadratic entropy is an independent measure of functional diversity that suggests that functional diversity is greater (11%) in the continuous forest. We suggest that the reason the community in the fragmented landscape has lower functional diversity is that the environmental filters imposed by the matrix have selected those species able to cope with these filters, especially on the edges of the forest fragments. The matrix in our study system is represented by a wetland with a level of salinity in which only a mix of mangroves, cattails and sedges can survive (Rico-Gray Reference RICO-GRAY1982). The habitat of mangroves is recognized as a highly stressful environment where environmental filters such as high radiation, heat, salinity, and low oxygen and nutrient (N, P) availability (Balun Reference BALUN2011) filter species tolerant to these environmental conditions. Also, the vegetation of the matrix is shorter than that of the fragments; the latter is thus beaten by winds and storms, especially the species growing at the edge. Owing to the larger edge-area ratio in the fragmented forest, it is expected that its plant community would be more exposed to the environmental filters prevailing in the matrix (higher radiation, heat, salinity as well as lower oxygen and nutrient availability) than the community of the continuous forest would be and therefore, it is functionally narrower than the continuous forest. Reduced plant functional diversity in fragmented forests has been also reported for other tropical forests in South America (Girão et al. Reference GIRÃO, LOPES, TABARELLI and BRUNA2007, Santos et al. Reference SANTOS, PERES, OLIVEIRA, GRILLO, ALVES-ACOSTA and TABARELLI2007) and some authors have documented the negative effects of tropical forest fragmentation on functional diversity in other taxonomic groups (e.g. insects; Barragán et al. Reference BARRAGÁN, MORENO, ESCOBAR, HALFFTER and NAVARRETE2011).
Abundance-weighted and unweighted means of functional traits are indicative of the main environmental filters and the traits that are being selected. In this study, punch strength (abundance-weighted and unweighted mean), leaf size (abundance-weighted mean) and leaf thickness (unweighted mean) showed the most striking differences between forests. Punch strength was higher in the fragmented than in the continuous forest, which also suggests that plant species are more resistant to physical (biotic and abiotic) damage in the fragmented forest, and that nutrient availability may be lower in this forest. Leaf size is negatively correlated with environmental stress (heat, drought and high radiation), therefore, the lower values of these traits in the fragmented forest suggest that the relatively reduced functional diversity of this system is at least partially due to the greater degree of environmental stress prevailing in this forest. On the other hand, leaf thickness was higher in the fragmented than in the continuous forest, which also suggests that plant species in the fragmented forest tend to have greater thermal buffering and retain more photosynthates than plants in the continuous forest. The fact that some functional traits differed between the two forest types in abundance-weighted means and others in unweighted means suggests that the changes in some functional traits can be attributed to changes in abundance (leaf size) or in species composition (leaf thickness). For leaf punch strength both changes in abundance and species composition seem to be responsible for the differences between forests (i.e. abundance-weighted and unweighted means differ between forests).
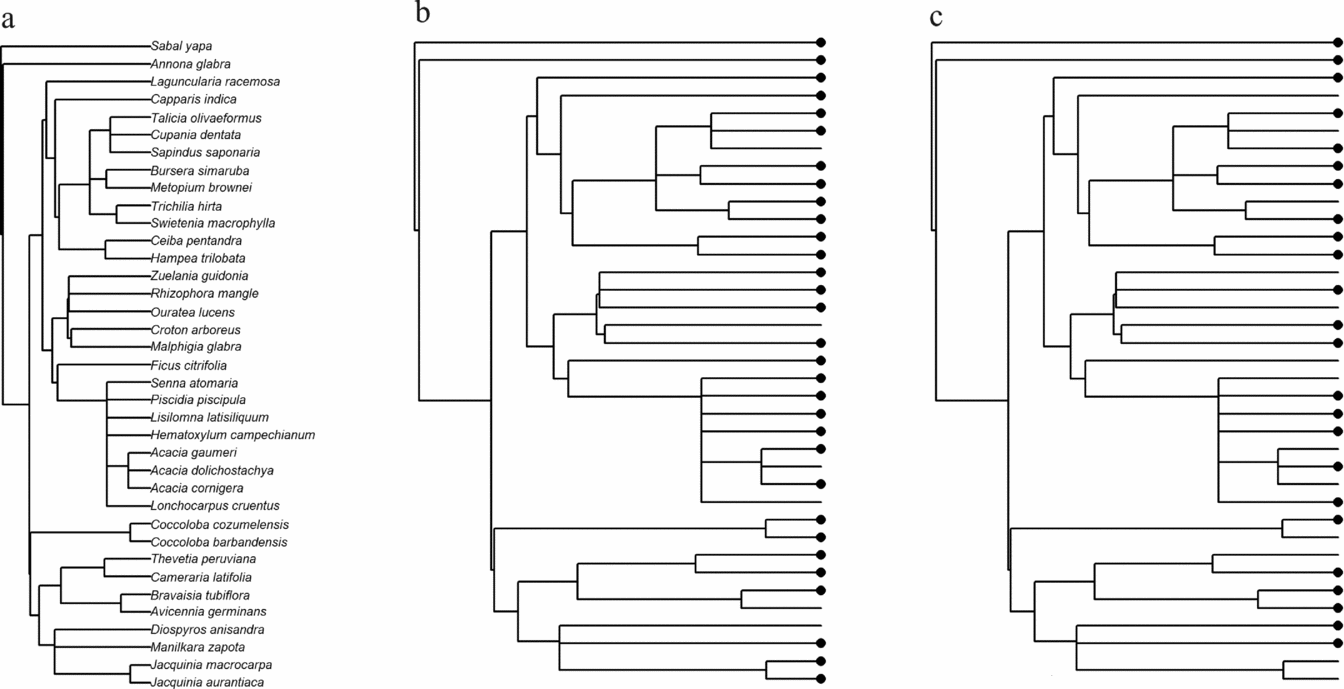
Plant phylogenetic diversity was, in general, lower in the fragmented than in the continuous forest. Thus, we suggest that the fragmented forest has lost a relatively high amount of its phylogenetic history (i.e. phylogenetic diversity, MNTD and MPD in the fragmented forest were 380, 61 and 25 million years less than in the continuous forest). Also, the fact that NRI and NTI are more positive in the fragmented forest suggests that the plant community in the fragmented forest tends to be phylogenetically more clustered while the community of the continuous forest is phylogenetically more overdispersed (Webb et al. Reference WEBB, ACKERLY, MCPEEK and DONOGHUE2002). Some authors have suggested that high phylogenetic conservatism in plant traits associated with fragmentation vulnerability/resistance can produce the loss of entire clades as well as a reduction in the phylogenetic distance among the remaining species in the phylogeny (Arroyo-Rodríguez et al. Reference ARROYO-RODRÍGUEZ, CAVENDER-BARES, ESCOBAR, MELO, TABARELLI and SANTOS2012, Santos et al. Reference SANTOS, ARROYO-RODRÍGUEZ, MORENO and TABARELLI2010). This could be the case in the system we studied because, as shown in Figure 3, Jacquinia species are present in the continuous but absent from the fragmented forest; concomitantly, some of the older lineages present in the continuous forest are absent from the fragmented forest, and this may have also reduced phylogenetic diversity. Our results do not concur with previous studies in which the authors have shown that high values of phylogenetic diversity were maintained in a severely fragmented tropical forest of Mexico (Arroyo-Rodríguez et al. Reference ARROYO-RODRÍGUEZ, CAVENDER-BARES, ESCOBAR, MELO, TABARELLI and SANTOS2012) and in a tropical forest of Brazil (Santos et al. Reference SANTOS, ARROYO-RODRÍGUEZ, MORENO and TABARELLI2010). It is likely that these studies found no association between fragmentation and phylogenetic diversity because the region only became fragmented relatively recently (40–200 y ago). In contrast, our study region has been fragmented for 1.7 million years indicating that over this period phylogenetic diversity has been reduced substantially in the fragmented forest relative to the continuous forest.
Phylogenies representing all of the species included in the analysis from a continuous and a fragmented forest on the Yucatan Peninsula (a), the species present in a continuous (b), and those in a fragmented forest (c). Species presence is indicated by a circle at the tip of the phylogeny.
Here we have shown that a forest that has been fragmented for a very long time has undergone a general erosion of plant diversity (taxonomic, functional and phylogenetic diversity) relative to an adjacent continuous forest. Some authors have pointed out that plant taxonomic diversity may respond slowly to forest fragmentation (Helm et al. Reference HELM, HANSKI and PÄRTEL2006) and therefore, studies looking at the short-term effects of forest fragmentation may underestimate the impact of forest fragmentation and depict a falsely optimistic future for plant diversity in forest fragments. In this sense, a naturally fragmented forest such as the one we studied may help us make relevant predictions regarding the fate of plant diversity in fragmented forests. According to our results it seems that, in the long term, species loss is not reversible if the forest patches remain disconnected. Short-term studies are still valuable for assessing the early responses of biodiversity to forest fragmentation; however, we recommend that future studies take into account the age of the fragments to detect whether the impact of fragmentation on plant biodiversity reported is time-dependent. Another important contribution of this study is the assessment of plant diversity in poorly understood components of diversity: functional and phylogenetic diversity. We know of only three studies that look at functional (Santos et al. Reference SANTOS, PERES, OLIVEIRA, GRILLO, ALVES-ACOSTA and TABARELLI2007) and phylogenetic diversity (Arroyo-Rodríguez et al. Reference ARROYO-RODRÍGUEZ, CAVENDER-BARES, ESCOBAR, MELO, TABARELLI and SANTOS2012, Santos et al. Reference SANTOS, ARROYO-RODRÍGUEZ, MORENO and TABARELLI2010) in fragmented forests, but none assess the long-term effects of fragmentation. To date, research has identified that functional and phylogenetic diversity may not have the same response to forest fragmentation. For example, Santos and colleagues found a strong fragmentation effect on plant functional diversity (Santos et al. Reference SANTOS, PERES, OLIVEIRA, GRILLO, ALVES-ACOSTA and TABARELLI2007), but no important effect on phylogenetic diversity (Santos et al. Reference SANTOS, ARROYO-RODRÍGUEZ, MORENO and TABARELLI2010) in Usina Sierra Grande, Brazil. We suspect that phylogenetic diversity only responds to long-term forest fragmentation, while functional diversity is sensitive to both short- and long-term fragmentation. However, studies that simultaneously evaluate functional and phylogenetic diversity in forests with contrasting levels of fragmentation are scarce, thus no general conclusion can be reached in this regard yet.
In conclusion, taxonomic, functional and phylogenetic plant diversity is consistently lower in a fragmented forest relative to an adjacent continuous forest and this could be a chronic effect of long-term forest fragmentation. We encourage researchers to examine all three of the main components of diversity simultaneously in naturally fragmented forests in order to detect any patterns regarding the long-term effect of forest fragmentation on the different diversity components.
ACKNOWLEDGEMENTS
This study was funded by a SEP-CONACyT grant (project: CB-2012-177680). We thank A. de-Nova for help with the phylogenies and L. Salinas-Peba for plant identification. B. Magaña-Rodríguez made the map in Fig. 1. D. Martínez, D. Marrufo and L. Quej helped with field work. B. Delfosse revised the English.
List of plant species found and their abundance in a continuous and a fragmented forest on the Yucatan Peninsula.