I. INTRODUCTION
Aluminum alloys are becoming one kind of the key engineering materials for automobile and aeronautical industries because of their low density, high strength, and low processing cycle costs. Compared with the other aluminum alloys, aluminum–lithium (Al–Li) alloys are distinguished for higher elastic modulus, lower density, improved corrosion resistance, better fatigue performance, and higher strength, thus being widely applied in the aerospace industry. The Al–Cu–Li alloys are the third generation aluminum–lithium alloy whose composition contains Al–Cu–Li (–Mg–Ag–Zn), which are mainly developed for military and space applications to meet the demands of the future commercial airframes. Corrosion behavior of aluminum alloys has been one of the objects of study in numerous technical and scientific studies, due to much significance of these materials in the contemporary technical world.Reference Ahmed and Wu1–Reference Rioja6
Chemical composition, microstructure heterogeneities, and exposure medium are the primary factors influencing the corrosion resistance. In the presence of aggressive halide anions, especially chloride ions, aluminum alloys are easily subjected to localized corrosion.Reference Kai7 In general, aluminum alloys corrode in a localized manner by pitting, intergranular attack, or exfoliation.Reference Soboyejo and Srivatsan8 Corrosion essentially results from microgalvanic processes between different intermetallic phases or particles and the alloy matrix. Though there are numerous different phases in Al–Cu–Li alloys, the three main kinds of precipitates are T1 (Al2CuLi), θ′ (Al2Cu) and δ′ (Al3Li) phases, and with the additions of Mg and other impurity elements, there could exist S (Al2CuMg), Al7Cu2Fe, and Al12(Fe, Mn)3Si phases.Reference Araullo-Peters, Gault, Geuser, Deschamps and Cairney9–Reference Zhang, Zeng, Yang, Shi and Wang14 Since there exists the incoherent relationship between the lath-shaped T1 phase and the α-Al, and the semicoherent relationship between the lath-shaped θ′ phase and the α-Al, T1 and θ′ phases could be the dominant strengthening precipitates. By contrast, the spheroidal δ′ phase, coherent with the alloy matrix, has no obvious influence on the alloy strengthening. And Deschamps et al. have reported that the majority of T1 and some θ′ phase existed in the peak-aged AA2198 alloy but the majority of T1 and δ′ phases with some θ′ phase in the peak-aged AA2196 alloy.Reference Decreus, Deschamps, Geuser, Donnadieu, Sigli and Weyland11,Reference Germer, Zein, Metwally, Hoskin, Harmsen, Smith and Patel12 With the increasing of Cu/Li ratio, the T1 phase has been becoming the principal intermetallic phase and there are less δ′ phases, meanwhile there being still some θ′ phase. Moreover, as to the corrosion behaviors of those main precipitates in Al–Cu–Li alloys, there have been detailed research studies about corrosion potentials of those intermetallic phases.Reference Birbilis and Buchheit15–Reference Yu-Xuan, Zhang, Ling-Ying and Liu17 The T1 phase is the anode to the alloy matrix and preferentially corrodes at the precipitate/alloy interfaces, the anode δ′ phase playing the similar role. And as to the θ′ phase, it is just the opposite. In the galvanic corrosion interface, it acts as the cathode versus the matrix of α-Al, due to its more positive corrosion potential promoting the corrosion of the α-Al.Reference Birbilis and Buchheit15,Reference Li, Zheng, Li, Chen, Ren and Zhao16 These alloys are particularly sensitive to aqueous media containing chloride ions, which make alloys favor pitting corrosion and exfoliation, and severely shorts the service life because of preferential stress accumulation at the local corrosion area. And up to now, there have been large amounts of previous investigations about the influence of the intermetallic precipitates on the corrosion behaviors of Al–Cu–Li alloys, but they all have been focused on the alloy behaviors of some certain heat-treatments such as T3, T6, and T8 conditions, or some certain intermetallic phase such as the dominant T1 phase.Reference Hong-Ying, Yi, Zeng and Feng18–Reference Zhang, Zhou, Hashimoto, Liu, Luo, Sun, Tang, Lu and Ma21 Actually, from the previous reports, we could know that the θ′ and δ′ phases play the important roles in alloy properties as well, besides the dominant T1 phase. Especially with the range of Cu/Li ratio, the amount of θ′ and δ′ phases changes, which significantly influences the alloy performance. And as to the microstructure evolution considering those several main kinds of intermetallic phase, the influence on corrosion behaviors should be made clear.
Therefore this study is aimed at investigating the microstructure evolution of the chosen 2198 Al–Cu–Li alloy of different artificial aging stages at equal aging temperature and is focused on the influence of the microstructure evolution on corrosion behaviors of the 2198 Al–Cu–Li alloy with aging process by adopting the full-immersion test, and electrochemical measurements at ambient temperature to acquire a better knowledge of the corrosion mechanism. Scanning electron microscopy (SEM) and transmission electron microscopy enable us to ascertain the nature of the corrosion occurrence and to establish some features of the inhibition.
II. EXPERIMENTAL
A. Specimen preparation
Commercial 2198-T83 alloy sheet with a thickness of 2 mm was used in this study. Its nominal chemical composition is presented in Table I. Specimens cut from the alloy sheet were solution-annealed at 500 °C for 4 h, quenched into hot water, and subsequently aged at 175 °C in an oil bath furnace. Vickers hardness (HV) testing was taken using 49 N load and a holding time of 15 s. The specimens for immersion test and electrochemical measurements were cut into rectangle plates of 10 × 15 mm, with a small hole in the edge of each sample for the nylon string to suspend in the aggressive solution during the immersion tests or for the copper wire to connect to conduct in the electrochemical measurements. The research of Inoue et al.Reference Inoue, Sugahara, Yamamoto and Tsubakino22 showed that the hole and the nylon contact areas had no clear effect on the corrosion behavior of the specimen. All the specimens were wet ground through successive grades of silicon carbide abrasive papers from P120 to P2000, ultrasonic cleaning in acetone, and drying in the cool flowing air.
Chemical composition of the 2198 Al–Cu–Li alloy (wt%).

B. Immersion test
The corrosion test used in this study was full-immersion measurements. To investigate the effects of microstructure evolution during aging heat-treatment on the alloy corrosion resistance, we chose the alloys at several representative aging stages according to the hardness curve: solution-anneal condition, under-aged, peak-aged, and over-aged. NaCl aqueous solution (3.5 wt%) used for immersion was prepared with analytical reagent grade NaCl and distilled water. We chose the alloy surface of 10 × 10 mm to contact with the corrosion medium. Each specimen was put in beakers containing 200 mL 3.5 wt% NaCl aqueous solution, with a funnel placed over the specimen to collect hydrogen, and the upended graduated cylinder to measure the volumes of hydrogen evolution using the drainage method. The immersion test was carried out at the temperature of 25 ± 2 °C for 20 days. In this process, the corrosion rate (CR) could be converted by the rate of hydrogen evolution.Reference Mathaudhu, Luo, Neelameggham, Nyberg and Sillekens23
C. Corrosion surface analysis and materials characterization
After the immersion tests for 20 days, the corroded surfaces of specimens were observed by using a field emission scanning electron microscope Versa 3D Dual Beam (FEI, Hillsboro, OR). After SEM observation, the specimens were then immersed into a 2 wt% CrO3 + 5 wt% H3PO4 at the temperature of 80 °C for 10 min to remove the corrosion products. The specimens were then quickly ultrasonically washed with distilled water and acetone, and dried in the cool air flow for the surface observation of SEM again to distinguish the corrosion morphology after removal of the corrosion products. The microstructure of the 2198 Al–Cu–Li alloy was characterized by atomic scale high angle annular dark field–scanning transmission electron microscopy (HAADF-STEM). Specimens for STEM were prepared by grinding to produce a foil of 50 μm thickness, followed by twin-jet electropolishing, and then further modified by ion milling.
D. Electrochemical measurements
Open circuit potential (E oc), polarization curves, and electrochemical impedance spectroscopy (EIS) of the specimens were measured in 3.5 wt% NaCl aqueous solution at ambient temperature (25 ± 2 °C), using the Ivium Compactstat.e mobile electrochemistry system (Ivium Technologies B. V., Eindhoven, The Netherlands). In this study, all the electrochemical measurements were used with a three-electrode electrochemical cell, with a saturated calomel electrode (SCE; 0.241 V verse the standard hydrogen electrode) as the reference electrode (RE) and a platinum electrode as the counter electrode (CE). The working electrode (WE) was the specimen with the exposure area of 10 × 10 mm. E oc measurements were carried out after the specimen was immersed into the solution for 300 s and were made prior to EIS and polarization curves to ensure the stability of the corrosion potential. In this process, E oc measurements were conducted between the RE and the WE without current being transferred to the CE. EIS was measured immediately after the E oc test was over and was recorded at E oc in the frequency range from 100 KHz to 10 mHz, with a single-sine signal perturbation of 10 mV and 148 measured points. The current range was 10 mA and acquisition period was 2.0 s. The polarization curves started from the potential of −1.4 V SCE and stopped at −0.3 V SCE. The scanning rate was 1 mV/s, and the E-step was 1 mV.
III. RESULTS AND DISCUSSION
A. Aging hardening behavior and microstructure characterization
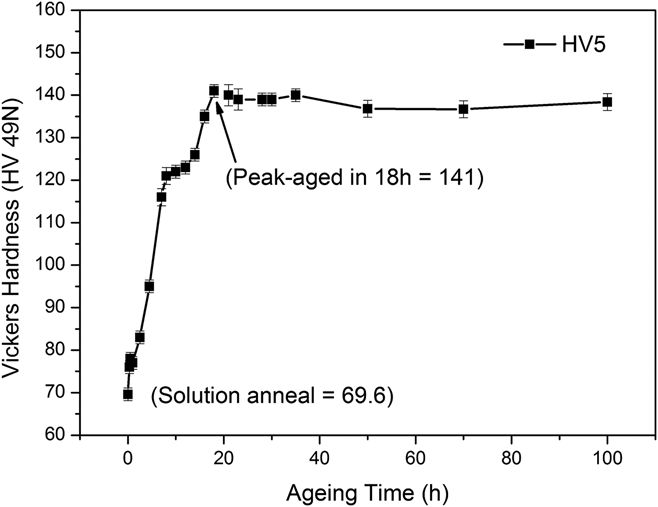
Figure 1 showed the hardness curve for the 2198 Al–Cu–Li alloy aged at 175 °C. As is shown in Fig. 1, the peak hardness value came at T6-18 h. From the solution-anneal condition to the peak-aged, the HV increases from 69.5 to 141 (HV5), due to the precipitates strengthening. After the peak-aged, the hardness nearly kept stable at about 140 (HV5), with a slight drop. To investigate the effects of microstructure evolution during aging heat-treatment on the alloy corrosion resistance, the samples in the solution-anneal, under-aged (aging for 20 min, 2.5 h and 4.5 h), peak-aged (18 h), and over-aged stages (30 h) were chosen.
Age hardening curves at 175 °C for the 2198 Al–Cu–Li alloy.

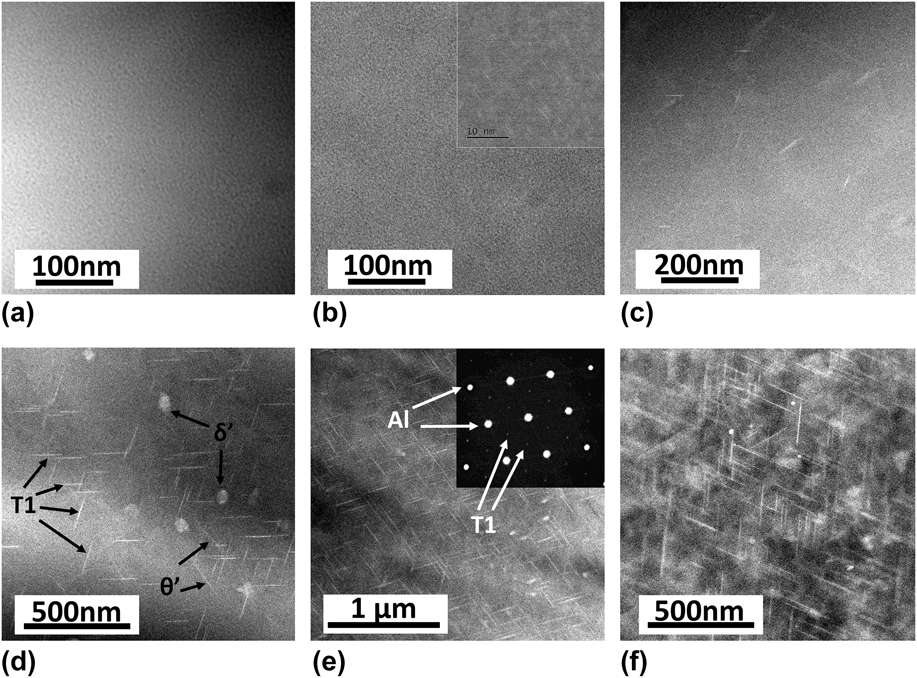
To acquire the deep explanation of the influence of the aging heat-treatment on the corrosion behavior, HAADF-STEM was adopted to characterize the microstructure evolution in the aforementioned aging stages. And HAADF-STEM images of 2198 Al–Cu–Li alloy specimens corresponding to the above-mentioned typical aging conditions are presented in Fig. 2. From Figs. 2(a) and 2(b), we could find there was no clear appearance of the new phases in the solution-anneal and earlier aging stage. However, compared with the solution-anneal condition, microstructure inhomogeneity could be discovered in the T6-20 min stage, which could be due to atomic cluster effects.Reference Wang and Starink13,Reference Ahmadi, Arabi and Shokuhfar24–Reference Huang and Ardell26 Because of the thermal driving force in the aging heat-treatment, the component fluctuation occurred in the microstructure, and some parts of atoms with high energy began to regroup at the more stable configuration. In Fig. 2(c), there appeared a small amount of the intermetallic phases, including some lath-shaped T1 and θ′ phases. When the aging reached the T6-4.5 h stage in Fig. 2(d), we could find the significant increasing amount of lath-shaped T1 and θ′ phases, and a few spheroidal δ′ phases could be discovered as well. The appearance of the δ′ phase could result from the local accumulation of Li atoms, which made the increased ratio of Cu/Li thus promoting the precipitation of the δ′ phase.Reference Decreus, Deschamps, Geuser, Donnadieu, Sigli and Weyland11,Reference Germer, Zein, Metwally, Hoskin, Harmsen, Smith and Patel12 Viewing the lath-shaped intermetallic phases, we could find that there was clear orientation relationship between the T1 and θ′ phases. Zhang et al. have reported that with the beam direction along [110]Al, the T1 phase existed 109.4° angle relation with each other and 125.3° with the θ′ phase.Reference Zhang, Zeng, Yang, Shi and Wang14 The SEAD pattern acquired from the beam direction along the [110]Al is presented in Fig. 2(e). As the dominating strengthening phase in Al–Cu–Li alloys, the T1 phase was the hexagonal structure, with the lattice parameters of a = 0.496 nm and c = 0.934 nm, and there existed the incoherent relationship between the T1 phase and the substrate: (0001)T1//(111)Al, [1010]T1//[110]Al, the habit plane {111}Al. The θ′ phase, the second primary strengthening phase in Al–Cu–Li alloys, was the cubic structure, with the lattice parameters of a = 0.404 nm and c = 0.58 nm, which there existed semicoherent relationship between the substrate.Reference Chen, Guo, Zheng, Zhang, Fan, Zhou, Li and Lu10,Reference Wang and Starink13,Reference Zhang, Zeng, Yang, Shi and Wang14 Meanwhile, there was a significant increase in the size of the intermetallic phase. Referring to the aging hardness curve in Fig. 1, we could find the evidence that the precipitating T1 and θ′ phases played the important role in the hardness improvement in the period during T6-2.5 h and T6-4.5 h. When it comes to the peak-aged, the amount of T1 phase increased further, but the amount of θ′ phase began to decrease gradually, similar to the δ′ phase. And we could confirm that the dominant amount of the T1 phase was far more than the other two kinds of intermetallic phase. From Fig. 2(f) in the over-aged stage, we could more easily find the gradually decreasing amount of θ′ and δ′ phases, and at this time, we could see that there was no obvious change in amount and size for the T1 phase. The microstructure evolution of those three kinds of intermetallic phases together played the important role in improvement of the mechanical properties, which could explain that the hardness value turned to be stable with a little drop after the peak-aged stage in Fig. 1. And the microstructure evolution would inevitably have the latent influence on corrosion behaviors of the alloy and accordingly those would be focused in the subsequent sections.
HAADF-STEM images of the 2198 Al–Cu–Li alloy in different aging conditions: (a) solution-anneal, (b) T6-20 min, (c) T6-2.5 h, (d) T6-4.5 h, (e) T6-18 h (Peak-aged), and (f) T6-30 h.

B. Corrosion test
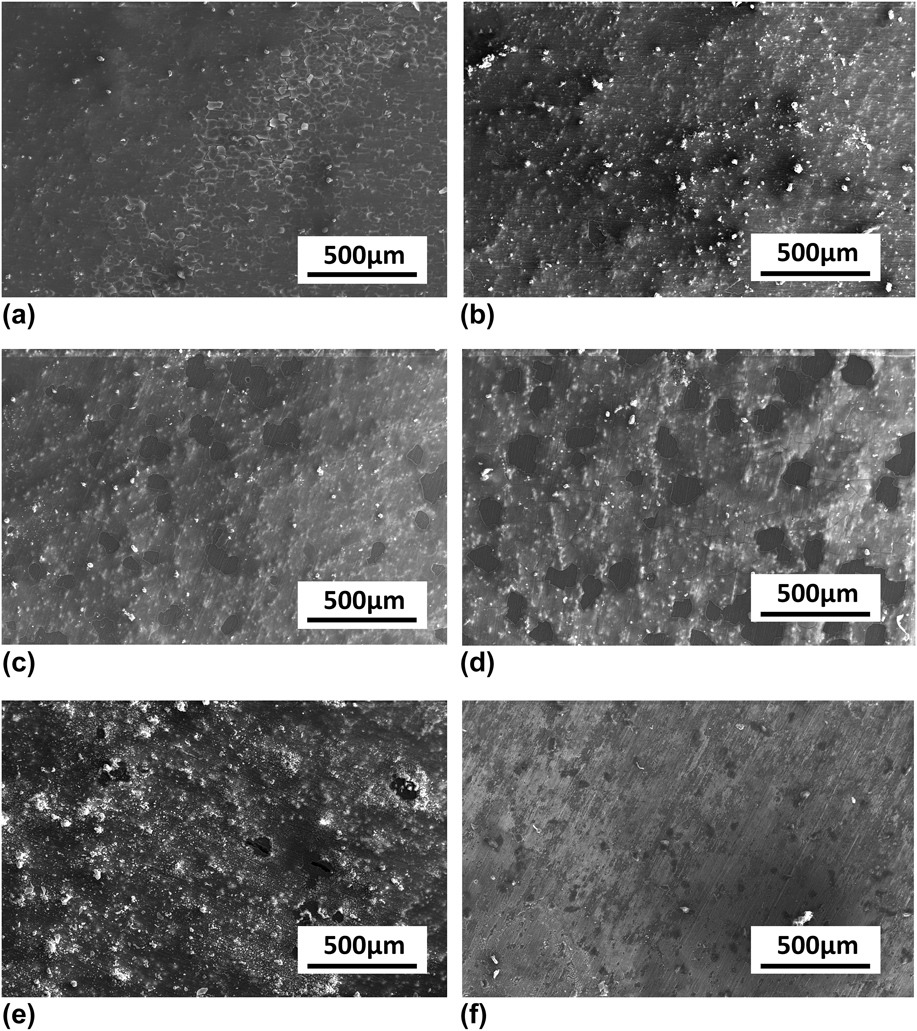
In this study, the specimens were immersed into the 3.5 wt% NaCl aqueous solution for 20 days. During 20 days, all the liquid levels of the upended graduated cylinders nearly maintained without any change that could be attributed to the good corrosion resistance of 2198 Ai–Cu–Li alloy and the hydrogen solubility in the solution.Reference Crozier and Yamamoto27 Therefore in this study, it was difficult to evaluate the corrosion resistance of the specimens at different aging stages by the rate of hydrogen evolution. The corrosion morphology of the corroded 2198 Al–Cu–Li alloy after immersion test was observed by SEM. And the images of the corrosion surfaces of 2198 Al–Cu–Li alloys in different aging stages after immersion in 3.5 wt% NaCl aqueous solution for 20 days are shown in Fig. 3. It was clearly discovered that in the solution-anneal stage, the corrosion surface was relatively flat, with some scale-formed corrosion products which were nearly exfoliated, and some corrosion particles which were inlaid in the corrosion surface. However, in the T6-20 min for short-time aging, the amount of corrosion products clearly increased and the corrosion film became heavier. The phenomenon of exfoliation nearly disappeared, instead there were more corrosion particles and the size was bigger. When it comes to the T6-2.5 h and T6-4.5 h, the corrosion behavior became a little different and the particle in the corrosion film became less, but the exfoliation form of the corrosion product occurred again, and it was not difficult to find the corrosion film peeled and dropped with the inside exposed, the phenomenon of which is more clear in Fig. 3(d). The corrosion film broke and the exfoliation film dropped with the dark and flat matrix exposed, and through that, we could know that the thickness of the corrosion film in the T6-4.5 h was heavier than that in the T6-2.5 h. Compared with the corrosion surface in the other stages, it was easily discovered that the worst corrosion condition occurred in the peak-aged [Fig. 3(e)]. Massive corrosion particles were inlaid in the heavy corrosion film, and some corrosion holes could be found because of the drop of corrosion particles. And after the peak-aged, the condition was totally reversed. The corrosion film in the over-aged stage became even. The corrosion particles and corrosion holes nearly disappeared. However, it was still found that the corrosion film was very loose, which could not protect the matrix. From those images of the corrosion surfaces in different aging stages, we could draw the conclusion that the increasing amount of intermetallic phases was deleterious to the corrosion resistance, especially for the T1 phase, even though it was the dominant strengthening phase. And after the peak-aged, with the decreasing amounts of θ′ and δ′ phases, the corrosion behavior of the alloy turned to be a little better. All those indicated the worst corrosion resistance in the peak-aged and the best corrosion resistance in the solution-anneal.
SEM images of the corrosion surfaces of the 2198 Al–Cu–Li alloy in different aging stages after immersion in 3.5 wt% NaCl aqueous solution for 20 days: (a) solution-anneal, (b) T6-20 min, (c) T6-2.5 h, (d) T6-4.5 h, (e) T6-18 h, and (f) T6-30 h.

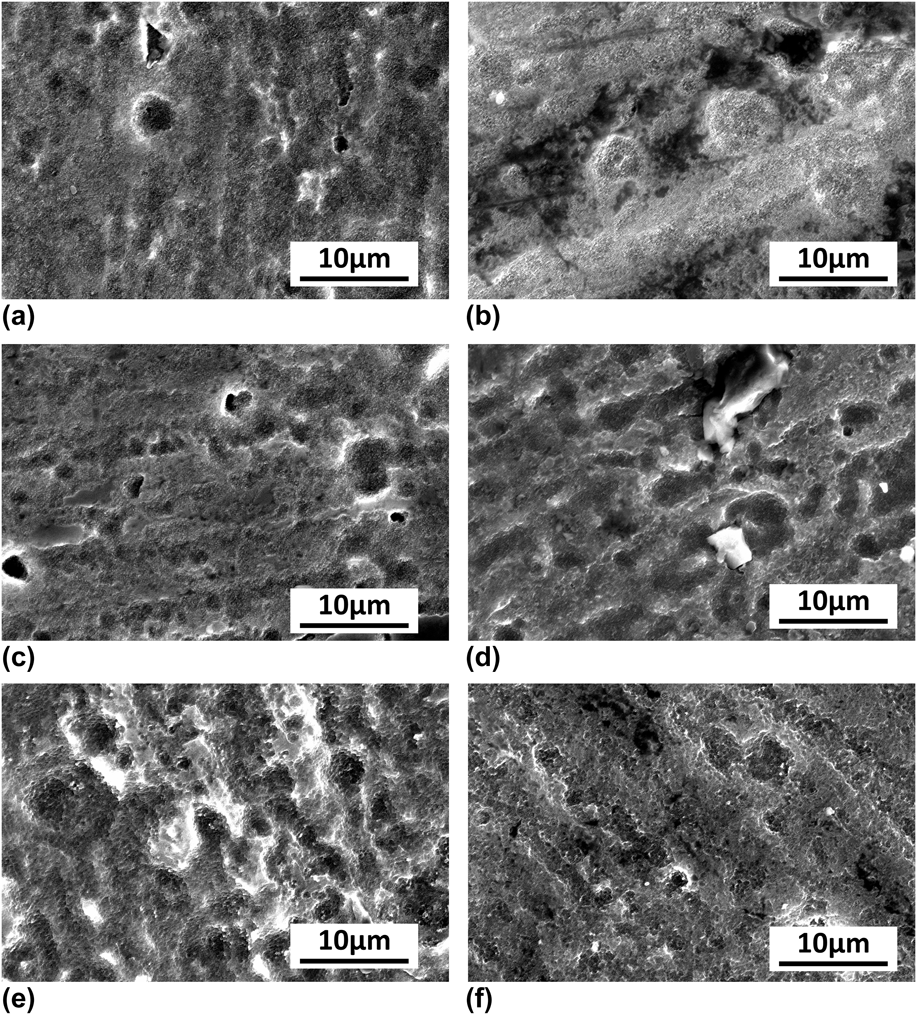
Figure 4 shows the SEM images of the corrosion surfaces of 2198 Al–Cu–Li alloys in different aging stages after immersion in 3.5 wt% NaCl solution for 20 days and removal of the corrosion products. From this group of images, we could easily find the worst corrosion behavior in the peak-aged stage as well. There were the deepest corrosion ditches with the biggest corrosion areas. Compared with each other, the samples in the solution-anneal and over-aged (T6-30 h) exhibited the better corrosion resistance, with the flatter corrosion surfaces. In all graphs of Fig. 4, we could find some basic features of corrosion morphology: there were massive small corrosion pores in the corrosion surface, and some bigger pores developed into deeper corrosion holes or expanded to be shallower but wider corrosion ditches. From the solution-anneal sample [Fig. 4(a)] to the peak-aged sample [Fig. 4(e)], we could find the trend clearly. After that, the sample exhibited better corrosion behavior with the flatter corrosion surface again. As for some broad corrosion lines, those could result from the corrosion on the original surface with abrasion marks. The marks had some influence on the corrosion behavior; however, because they exhibited the same orientation, it was not hard to distinguish the abrasion marks and corrosion ditches. From Figs. 4(c) and 4(d), we could find several lines of abrasion marks, but most corrosion holes and ditches with random orientations resulted from the corrosion reaction. All the phenomena indicated that the closer to the peak-aged the heat-treatment was, the more severe the corrosion condition was, the peak-aged sample exhibiting the worst corrosion resistance.
SEM images of the corrosion morphology of the 2198 Al–Cu–Li alloy in different aging stages after immersion in 3.5 wt% NaCl aqueous solution for 20 days and removal of the corrosion products: (a) solution-anneal, (b) T6-20 min, (c) T6-2.5 h, (d) T6-4.5 h, (e) T6-18 h, and (f) T6-30 h.

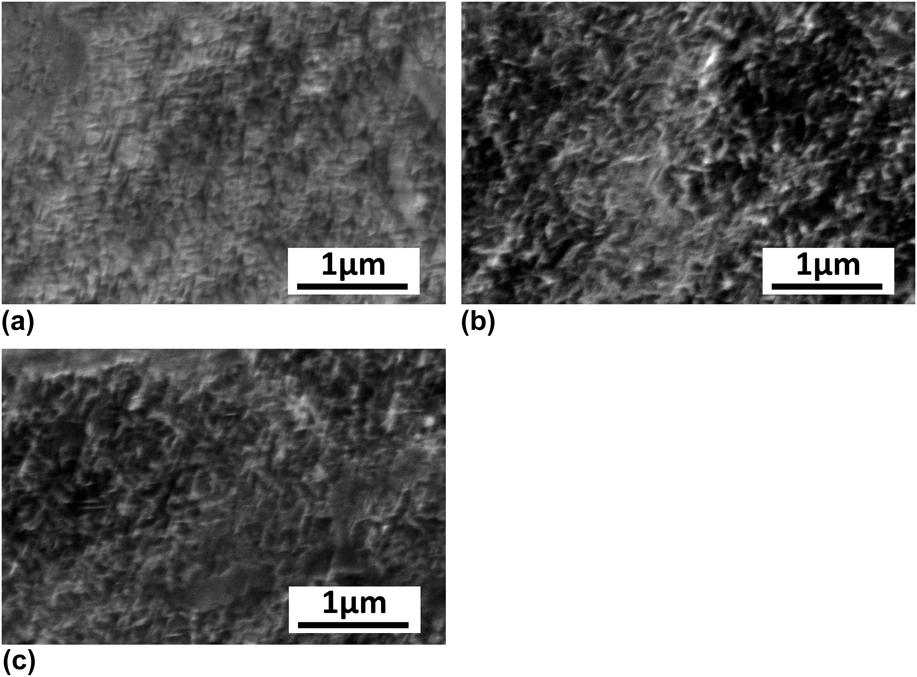
The CRs of alloys were greatly dependent on the material composition and microstructure. To investigate the effects of microstructure evolution on the corrosion behaviors, we gave some typical high magnification SEM images of the corrosion surfaces of the 2198 Al–Cu–Li alloy in different aging stages after immersion in 3.5 wt% NaCl aqueous solution for 20 days and removal of the corrosion products, which are presented in Fig. 5. It was obvious to find that there were many lath-shaped swells on the surface. And in Fig. 5(a) of the T6-4.5 h sample, the swells were very uniform and relatively fine. In Fig. 5(b), we could find that the swells were coarser and the corroded surface was not as even as that in the T6-4.5 h stage. Meanwhile there occurred some dark areas on the surface. After the peak-aged stage, the lath-shaped swells became a little more uniform and even again. And the most interesting phenomenon was that the lath-shaped swells exhibited some certain orientation relationship with each other, and the orientation was totally different from some abrasive marks, the former exhibited some certain angle relationship. Referring to the previous study,Reference Birbilis and Buchheit15,Reference Li, Zheng, Li, Chen, Ren and Zhao16 the lath-shaped θ′ phase had the more positive corrosion potential than the α-Al, thus acting as the cathode in the galvanic corrosion of the contact interface. Compared with the α-Al matrix, the lath-shaped T1 phase acted as the anode due to its more negative corrosion potential. Combined with the HAADF-STEM images in Fig. 2, we could know that the lath-shaped swells resulted from the majority of the anode T1 phase and some cathode θ′ phases together. When the T1 phase with more negative corrosion potential dissolved, the residual ∝-Al matrix could be partly kept. Some dark areas formed like the shallow holes, which could originate from the dissolution of the spheroidal anode δ′ phase. In different aging stages, the different second phases precipitated and grew. From the HAADF-STEM images, we could know that, in the T6-2.5 h stage, there were a small quantity of lath-shaped T1 and θ′ phases, which began to precipitate. In the T6-4.5 h stage, there were more lath-shaped T1 and θ′ phases, in which certain orientation relationship existed between them. Until it came to the peak-aged stage, the amount and the size of T1 phase increased significantly, but the amount of θ′ and δ′ phases began to decrease gradually and slightly. The microstructure evolution that those three main kinds of the intermetallic phase precipitated and grew played a comprehensive role in the corrosion behavior of the alloy, which resulted in that there were coarser corrosion residual swells exhibiting certain orientation relationship in Figs. 5(b) and 5(c) than those in Fig. 5(a), and the more dark corrosion areas in Fig. 5(b) than those in Figs. 5(a) and 5(c). Combining HAADF images in Fig. 2 and the high magnification SEM images in Fig. 5, we could make clear that the microstructure evolution of the three main kinds of intermetallic phases and the influence of the microstructure evolution with aging stage on the corrosion behavior of the 2198 Al–Cu–Li alloy. Meanwhile, we could draw the conclusion that the worst corrosion resistance was in the peak-aged stage.
High magnification SEM images of the corrosion surfaces of the 2198 Al–Cu–Li alloy in different aging stages after immersion in 3.5 wt% NaCl aqueous solution for 20 days and removal of the corrosion products: (a) under-aged (T6-4.5 h), (b) peak-aged (T6-18 h), and (c) over-aged (T6-30 h).

C. Electrochemical behavior
1. Open circuit potential
Open circuit potential (E oc) experiments were conducted in 3.5 wt% NaCl aqueous solution and E oc values from the solution-anneal to T6-30 h stages were −0.644 V SCE, −0.666 V SCE, −0.725 V SCE, −0.740 V SCE, −0.770 V SCE, and −0.757 V SCE. In general, the open circuit potential reflected the corrosion potential value in the nature condition without the applied potential or current. From this group of values, it was not difficult to find that the E oc values of different aging stages were all about −0.7 V SCE, relatively positive values than those of other metal materials, that was the reason why the 2198 Al–Cu–Li alloys had the good corrosion resistance for the aircraft applications. And further to compare the data with each other, we could see the solution-anneal specimen had the more positive E oc value, and the whole values exhibited the tendency: from the solution-anneal to the peak-aged stage, the E oc value became more and more negative and reached the most negative value in the peak-aged stage, then after that, the E oc value turned to be a litter more positive. This tendency was in good agreement with the corrosion morphologies as a whole.
2. Polarization curves
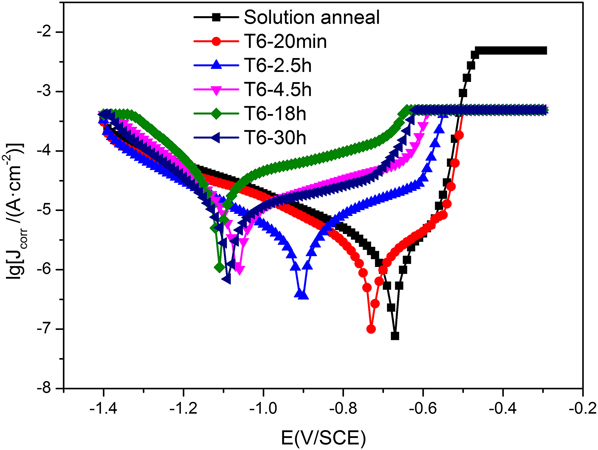
Figure 6 shows the potentiodynamic polarization curves for the specimens after EIS measurements in 3.5 wt% NaCl aqueous solution. In general, in the cathodic branch of the Tafel plot, the potential applied in the electrode by the electrochemical workstation was clearly more negative than the corrosion potential of the WE of the alloy; therefore actually the WE was protected from aggression by the corrosion medium, which was the cathodic protection effect. And in the anodic branch of the Tafel plot, the applied potential on the WE was more positive than the corrosion potential of the WE of the alloy; therefore the WE lost the electrons and released the metal ions, then the metal ions would react with the hydroxyl ions in the solution to combine and generate corrosion products of hydroxides. Meanwhile, the electrons were transferred to the CE to combine with the hydrogen ions in the solution to generate the hydrogen. Those were the complete electrochemical reactions in the three-electrode system cell. From the anodic branch of the Tafel plot, we could easily distinguish the CR of the anode dissolution. By analyzing Fig. 6, it could be discovered that the cuspidal point of the polarization curve in the solution-anneal stage was in the bottom right corner. With the aging stage going, the cuspidal point shifted to the top left corner, and that of the peak-aged was located in the most top left corner. Furthermore, we could see the cathodic polarization branches of all the aging stages were nearly overlapped. By contrast, the anodic branches were easily distinguished in Fig. 6. And it was obvious to find the process of the passivation films forming and being broken down. Similarly, all exhibited the tendency: the closer to the solution-anneal stage the aging heat-treatment was, the lower the passivation current (I p) was and the more positive the break-down potential (E bd) was. This tendency indicated the best corrosion resistance in the solution-anneal stage and the worst in the peak-aged as well. All results were well in consistent with the above experiments in this study.
Polarization curves for the 2198 Al–Cu–Li alloy in 3.5 wt% NaCl aqueous solution.

According to the two branches of polarization curve, the corrosion current density, J corr (μA/cm2) could be estimated by the Tafel extrapolation method. Furthermore, the CR could be calculated by J corr, according to ASTM G102-89 (2015). The equation is as follows:
 $${\rm{CR}} = {K_{\rm{i}}}{{{J_{{\rm{corr}}}}} \over \rho }{\rm{EW}}\quad {\rm{,}}$$
where CR is the corrosion rate, K i is a constant (3.27 × 10⁻³ mm g/µA cm y), ρ is the material density, J corr is the corrosion current density, μA/cm2, and EW is the equivalent weight.
In addition, the polarization resistance (R p) could be calculated by the following equation:
 $${R_{\rm{p}}} = {{{\beta _{\rm{a}}}{\beta _{\rm{c}}}} \over {2.3\left( {{\beta _{\rm{c}}} - {\beta _{\rm{a}}}} \right){J_{{\rm{corr}}}}}}\quad ,$$
where βa and βc are, respectively, the slopes of Tafel segments of the logarithmic anodic and cathodic polarization curves and J corr is the corrosion current density as aforementioned.
Whereas the electrochemical workstation in this study had the module used for the corrosion analysis and the modules had adopted the identical theoretical formulas to calculate, it was very convenient to automatically calculate the corresponding corrosion current density (J corr), polarization resistance (R p), and CR according to the chosen Tafel sections. The calculated values of polarization curves are presented in Table II. From Table II, we could see that the closer to the peak-aged the heat-treatment was, the higher the value of corrosion current density was, and namely, the higher the CR was. And similar to the former experiments, the corrosion resistance in the solution-anneal stage was the best, and after the peak-aged, the tendency of the CR value was a little reversed as well. Furthermore, it was very clear to find that there appeared the inversely proportional relationship between R p and J corr. And from the J corr, R p, and the calculated CR values, we could find the CR in the peak-aged stage was eight times faster than that in the solution-anneal, which was the distinguished difference in the corrosion resistance. The whole results were in accordance with the former studies in this research.
The values of CR analyses of polarization curves measured in 3.5 wt% NaCl aqueous solution.

3. EIS measurement
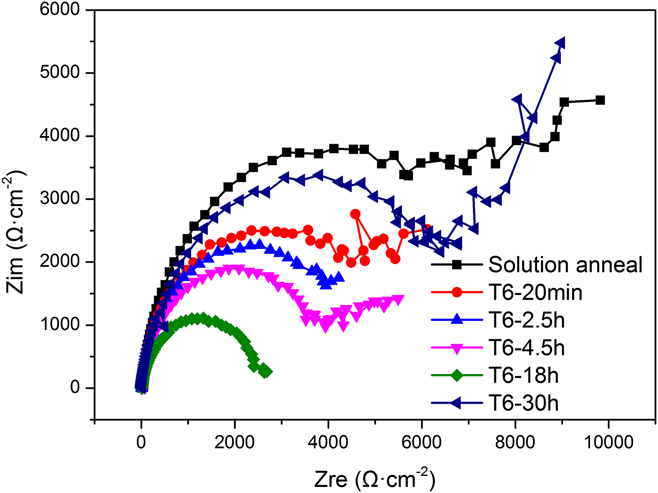
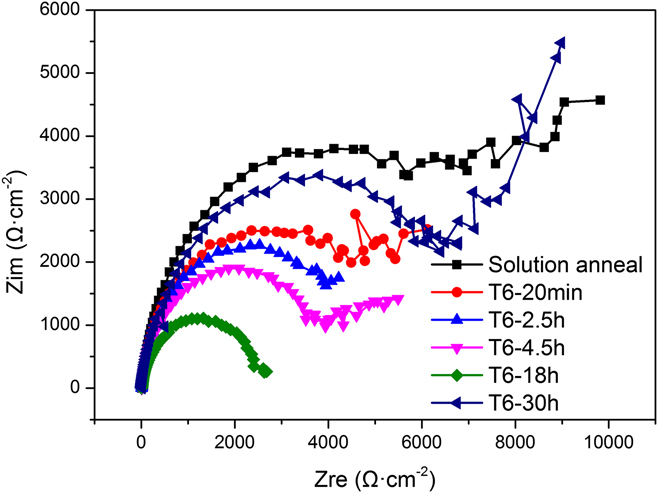
The measured EIS Nyquist plots in the different aging stages at E oc are presented in Fig. 7. Comparing the plots with each other, we could find those six curves almost consisted of two clear capacitive loops, whereas the low frequency inductive loop did not occur. Referring to the previous research studies of 2XXX Al–Li alloys,Reference Wang, Wang, Yue and Gao20,Reference Moreto, Marino, Filho, Rocha and Fernandes28–Reference Conde and Damborenea32 the two capacitive loops in the EIS corresponded to the two parts of the alloy surface, and the high frequency (HF) one was the flat corrosion film, the lower frequency (LF) one was the localized corrosion parts, such as pits, intergranular, and exfoliation corrosion. From Fig. 7, we could easily distinguish the HF and LF parts, which exhibited two sections of semicircle: the complete semicircle in the HF and the nearly one-fourth arc in the low frequency. In general, the semicircle in the HF could be found in almost Nyquist plots corresponding to the formation of the corrosion film, but as to this kind of one-fourth arc in the relatively low frequency, this section reflected the diffusion actions near the electrode surface. The distinguished one-fourth arc appeared when there existed the difference of the ion concentration between the solution itself and the diffusion layer near the electrode surface. And when the reaction on the electrode surface occurred at the relatively high rate, this phenomenon could be clearer. From Fig. 7, we could found the distinguished one-fourth arc in the each plot even though we adopted the relatively long measurement time and the slow recording rate in the EIS measurement, which suggested that the alloy itself was a little active and the good corrosion resistance could be attributed to the protection of the passive corrosion film. And the radius of the semicircular Nyquist plot being compared, the corrosion resistance could be determined basically: the radius in the solution-anneal stage was the maximum, which meant the best corrosion resistance in the solution-anneal, and similarly, the least radius in the peak-aged stage suggested the worst corrosion resistance.
Compared Nyquist plots for the 2198 Al–Cu–Li alloy in different aging stages after E oc measurement in 3.5 wt% NaCl aqueous solution.
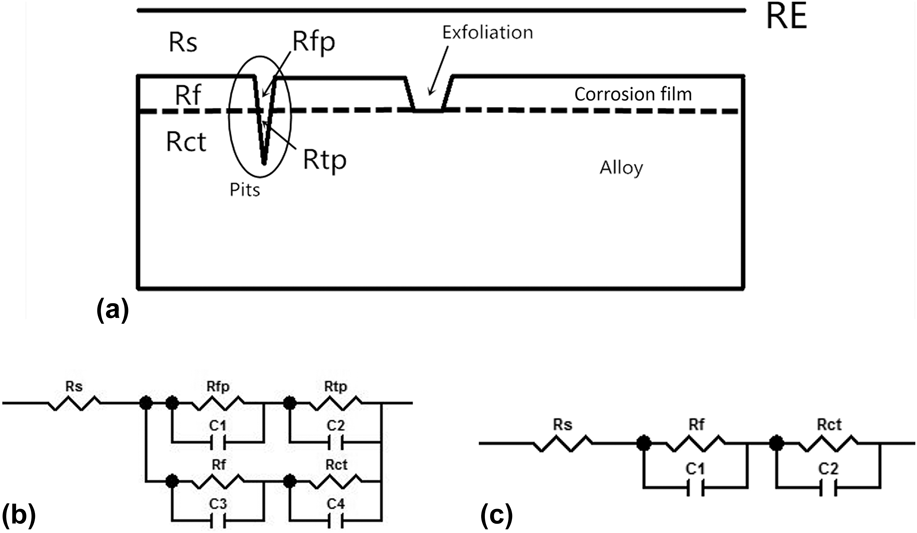
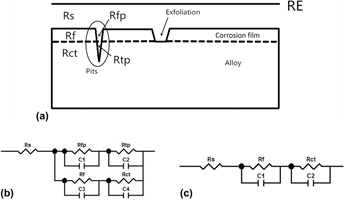
Observing the SEM morphology of corrosion surfaces in Figs. 3–5, we could draw the schematic representation in Fig. 8 to explain the corrosion mechanism. On the surfaces of each group of specimens, there existed different extents of pits and exfoliation corrosion plates. In Fig. 8, R s represented the solution resistance, which usually ranged from 1 to 100 Ω, thus generally being ignored for its small value. R f, R ct, R fp, and R tp represented the corrosion film resistance, double charge transfer resistance, the resistance among broken films, and the matrix alloy resistance with the pores inside, respectively. To simulate the equivalent circuit, the capacitance was generally mathematically modeled as a constant phase element (CPE). And there existed the equation defining the impedance:
 $$Z\left( {j\omega } \right) = {\left( {{Y_0}} \right)^{ - 1}}j{\omega ^{ - n}}\quad ,$$
where Y 0 is the constant, j is the imaginary unit, ω is the angular frequency (ω = 2πf, f is the frequency), and n could range from −1 to 1. When n = 1, Z represents an ideal capacitance; n = 0, as the resistance; n = −1, as an inductance; and n = 0.5, as a Warburg impedance.
Schematic representation of the 2198 Al–Cu–Li alloy corrosion in 3.5 wt% NaCl aqueous solution (a), the established equivalent circuit (b), and the simplified model (c).

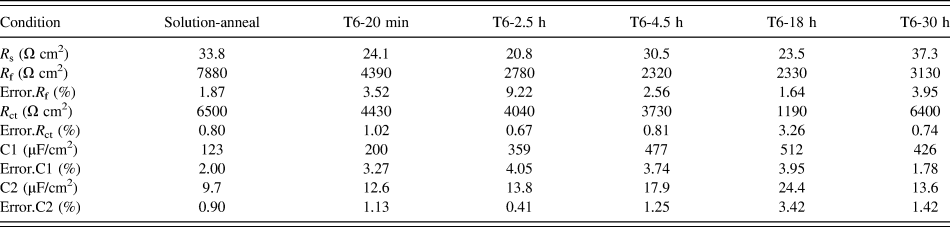
In this study, to simplify the simulation, the CPE was treated as the capacitance element. And combining the Nyquist plots with the schematic map, we established the complete equivalent circuit, as is shown in Fig. 8(b). And further to simplify the circuit, the equivalent circuit is presented in Fig. 8(c), with only five elements. By means of the fitting module of the equivalent circuit in the electrochemical workstation used in this research, the detailed fitted values of each element are presented in Table III. From the table, we could find all the value of the solution resistance were around 30 Ω cm2, which was in consistent with the previous empirical value, and compared with other resistance, such as R f and R ct, the solution resistance could be ignored. As to the corrosion film resistance, we could easily find that the biggest value was in the solution-anneal stage and the least value was in the peak-aged stage, and the former was three times of the value of the latter. And the whole indicated the same tendency as the above measurements: from the solution-anneal stage to the peak-aged stage, the resistance decreased gradually, but after the peak-aged stage, the resistance turned bigger than that in the peak-aged. The bigger resistance of the corrosion film represented the corrosion film was more able to withstand the corrosion impact of electrolyte solution, which meant that the corrosion film was more able to protect the alloy matrix from aggressing in the corrosion medium. And the double charge transfer resistance reflected the resistance between the electrolyte and the alloy matrix. The double charge transfer layer formed in the reaction between the electrons in the metallic conductors and the ions in the electrolyte solution under the action of electric field. From Table III, we could easily find that the value of R ct in the solution-anneal stage was five times bigger than that in the peak-aged, which indicated that the alloy matrix was be more able to withstand the aggression of the corrosion medium. And the whole values still exhibited the similar tendency that from the solution-anneal to the peak-aged stage, the resistance decreased gradually, and after the peak-aged, the tendency was getting reversed, which was attributed to the microstructure evolution. Comparing the two groups of capacitance values, we could find both the maximum in the peak-aged and the minimum in the solution-anneal stage. C1 represented the capacitance of the corrosion film and C2 represented the capacitance of the double charge transfer layer. In general, the capacitance reflected the accumulation of charges. And the least capacitance value of the corrosion film indicated that the corrosion film was thinner and more compact to a certain extent. The minimum in the solution-anneal stage suggested that the thinnest and most compact film in the solution-anneal was more able to protect the alloy matrix from aggression, which was in consistent with the corrosion morphology in Figs. 3 and 4. Besides, the capacitance of the double charge transfer layer indicated the accumulation of charges in the interface between the solution and the alloy matrix, which originated from the ions in the electrolyte solution and the electrons in the metallic conductor. The bigger capacitance value of the double charge transfer layer suggested the more accumulation of the electrons in the metallic conductor and the ions in the electrolyte solution under the action of electric field, which suggested that the alloy matrix could be subjected to the aggression of the corrosion medium more easily. And it was not difficult to find the maximum of the capacitance value of the double charge transfer layer in the peak-aged. All the fitted values of elements indicated that the best corrosion resistance in the solution-anneal stage and the worst corrosion resistance in the peak-aged stage, and from the solution-anneal to the peak-aged stage, the corrosion resistance decreased gradually. Certainly, the corrosion behaviors were attributed to the microstructure evolution of the three main kinds of intermetallic phases, those discussed in the above section. The established model to investigate the corrosion mechanism was based on the corrosion morphology and the simulated values revealed the accordant results with what the corrosion morphology presented. What’s more, as it is presented in Table III, all the error values were calculated and controlled below 10%, which indicated the simulated values were acceptable. The EIS measurement was the very effective means to investigate the corrosion mechanism and the results of all the electrochemical measurements were well in consistent with the immersion tests.
The fitted values of the circuit elements in the equivalent circuit.

IV. CONCLUSIONS
(1) The corrosion resistance of the 2198 Al–Cu–Li alloy is influenced by the microstructure evolution with the aging heat-treatment process. From the solution-anneal to the peak-aged stage, the corrosion resistance decreases gradually and reaches the worst value in the peak-aged; however after the peak-age stage, the corrosion resistance is reversed.
(2) The SEM morphology of corroded surfaces shows the corrosion manners involve in pitting and exfoliation corrosion. The lath-shaped swells are attributed to the galvanic corrosion in the interface between the T1 and θ′ phase with the substrate, which exhibits certain orientation relationship. In addition, the pitting pores form associating with the negative potential of the spheroidal δ′ phase.
(3) The polarization curves of measurements clearly show the tendency of corrosion behaviors, which are in good agreement with the corroded morphology in the immersion tests. And all the calculated CR values show the good corrosion resistance of 2198 Al–Cu–Li alloys, thus widely applying in the aircraft industry.
(4) The equivalent circuit based on the established corrosion model well reveals the features of the corrosion film and the reaction in the interface between the aggressive medium and the alloy matrix. Both the relatively thinner but more compact corrosion film, and the bigger corrosion resistance in the double charge transfer layer, provide the better corrosion protection for the alloy matrix of the solution-anneal sample in the aggressive medium.
ACKNOWLEDGMENTS
This research is supported by open fund of the State Key Laboratory of Refractories and Metallurgy (Grant No. G201702). Thanks to Frontier Research Center for Materials Structure, Shanghai Jiao Tong University, for its supports of JEM-ARM200F Atomic Scale High Angle Annular Dark Field–Scanning Transmission Electron Microscopy (HAADF-STEM) and FEI Versa 3D Dual Beam Field Emission Scanning Electron Microscope (FE-SEM).