1 Introduction
Interfacial flows are of critical importance in numerous man-made applications and natural processes. Primary breakup is relevant for atomization and sprays (Faeth, Hsiang & Wu Reference Faeth, Hsiang and Wu1995). Gas entrainment plays an important role in chemical processes such as absorption, in pool type nuclear technology, spilling breakers and ship hydrodynamics. For instance, entrained bubbles and cavitation are responsible for the persistence of ships wake (Lozano, Talu & Longo Reference Lozano, Talu and Longo2007; Terrill & Taylor Reference Terrill and Taylor2015). The rate of interphase transfer between liquid and gas phases is greatly enhanced by surface renewal in high Schmidt number flows (Danckwerts Reference Danckwerts1951; Jähne & Haußecker Reference Jähne and Haußecker1998). Saylor & Handler (Reference Saylor and Handler1997) demonstrated an increase in the interphase transfer rate of
 $\text{CO}_{2}$
of two orders of magnitude when the free surface is populated with Faraday waves. This result has particularly important consequences on global climate as oceans are estimated to absorb up to 40 % fossil fuel produced
 $\text{CO}_{2}$
(Donelan & Wanninkhof Reference Donelan and Wanninkhof2002). Subsurface convection and surface renewal can be imparted by turbulence, coherent structures such as jets or vortices, surface waves or a combination of those.
This paper focuses on a horizontal shear layer below a free surface. Brennen (Reference Brennen1970) first studied this instability after observing two-dimensional (2-D) capillary-scale waves in the wake of axisymmetric cavitating bodies. Based on linear analysis using a perturbation method for inviscid flow, he related the wave frequency
 $f$
of the most unstable mode to the free stream velocity
 $U$
and to the boundary layer momentum thickness at separation
 $\unicode[STIX]{x1D703}$
according to
 $\bar{f}=2\unicode[STIX]{x03C0}f\unicode[STIX]{x1D703}/U$
. Here
 $\bar{f}$
is the non-dimensional frequency, which tends towards 0.175 in the inviscid limit. This result is in good agreement with experiments, including jets (Hoyt & Taylor Reference Hoyt and Taylor1977; Itoh, Tsuji & Nakamura Reference Itoh, Tsuji and Nakamura1999; Portillo, Collicott & Blaisdell Reference Portillo, Collicott and Blaisdell2011). The shear layer rolls up into vortices which can deform the surface very rapidly, and lead to steep 2-D waves (André & Bardet Reference André and Bardet2015a
). Additionally, spanwise modulations of the surface become apparent as chevron-like patterns, a feature also observed in the aforementioned experimental studies.
Freely propagating 2-D surface waves can undergo transition to 3-D due to nonlinear interactions as demonstrated for gravity waves (Phillips Reference Phillips1960; McLean Reference McLean1982), capillary–gravity waves (Simmons Reference Simmons1969; Hammack & Henderson Reference Hammack and Henderson1993) and capillary waves (Banerjee & Korpel Reference Banerjee and Korpel1982). In the context of a jet emerging from an orifice, steady capillary waves can form if their phase speed matches the jet velocity as shown by Osborne & Stump (Reference Osborne and Stump2001). For water flowing at several metres per second, the corresponding capillary waves are under a hundred microns in wavelength.
In the present experiment, the 2-D waves are not freely propagating but are forced by the flow structures below them. Thus they are the signature of the vortical flow below (Yu & Tryggvason Reference Yu and Tryggvason1990). A shear layer on the forward face of a spilling breaker can also roll up to vortices and form 2-D surface disturbances named ‘type 2 capillaries’ by Longuet-Higgins (Reference Longuet-Higgins1994). These were experimentally observed by Duncan et al. (Reference Duncan, Qiao, Philomin and Wenz1999) to break down to a random 3-D pattern indicating turbulent flow below the surface. Longuet-Higgins (Reference Longuet-Higgins1994) conducted a 2-D theoretical analysis of these type 2 capillaries acknowledging that possible spanwise vortex instabilities were not included, and concluding that further experimental studies of mixing layers with a free surface were desirable. The need to better understand three dimensional instabilities of a surface shear layer was also highlighted by Longuet-Higgins (Reference Longuet-Higgins1998) and Perlin & Schultz (Reference Perlin and Schultz2000).
Iafrati & Campana (Reference Iafrati and Campana2005) reported large-amplitude air entrapping surface disturbances due to shear layer roll up when modelling a micro-breaker. Other mechanisms of air entrainment have been studied, such as the whirlpool type vortex (Hecker Reference Hecker1981), plunging jet and breaking waves (Biń Reference Biń1993; Kiger & Duncan Reference Kiger and Duncan2012) or hydraulic jumps (Madarame & Chiba Reference Madarame and Chiba1990; Chanson Reference Chanson1996, Reference Chanson2007).
Crapper (Reference Crapper1957) derived a potential flow solution for pure capillary waves and showed that the maximum amplitude is reached when the surface self-intersects and encloses an air bubble at a steepness
 $ak=2.29$
(with
 $a$
the amplitude and
 $k=2\unicode[STIX]{x03C0}/\unicode[STIX]{x1D706}$
the wavenumber). This mechanism has also been suggested for air entrainment in spilling breakers (Koga Reference Koga1982). Longuet-Higgins (Reference Longuet-Higgins1994) predicted that capillaries on the forward face of breakers can have troughs sufficiently sharp to entrap air in a similar manner.
Longuet-Higgins (Reference Longuet-Higgins1953) first showed in two dimensions that a shear-free condition at a surface can be expressed in terms of a vorticity boundary condition. Lundgren (Reference Lundgren1989) gave a three-dimensional form. In the case of an unsteady 2-D free surface, surface parallel vorticity (i.e. out of plane vorticity) is given by
 $$\begin{eqnarray}\unicode[STIX]{x1D714}_{n=0}^{BC}=2\boldsymbol{s}\boldsymbol{\cdot }\unicode[STIX]{x1D735}\boldsymbol{u}\boldsymbol{\cdot }\boldsymbol{n}.\end{eqnarray}$$
In this equation, unit vectors tangent and normal to the surface (
 $\boldsymbol{s},\boldsymbol{n}$
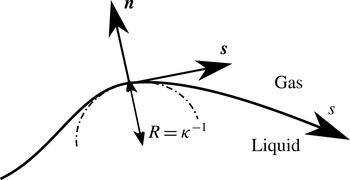
) are defined following a curvilinear coordinate system shown in figure 1. Longuet-Higgins (Reference Longuet-Higgins1992) noted that to the first order in wave steepness, vorticity generated at the surface of capillary waves stays confined within a Stokes boundary layer (depth of the order of
 $\sqrt{2\unicode[STIX]{x1D708}/\unicode[STIX]{x1D6FA}}$
, with
 $\unicode[STIX]{x1D6FA}$
the wave radian frequency and
 $\unicode[STIX]{x1D708}$
the kinematic viscosity), but that to the second order, there is a net flux of vorticity in the flow through viscous diffusion. Lugt (Reference Lugt1987) gave a basic expression for the vorticity flux at a free surface in 2-D steady state and Rood (in Green Reference Green1995, pp. 678–730) derived a general expression which involves several terms such as surface acceleration, normal and parallel surface velocities and velocity gradients, surface curvature, pressure and gravity. The vorticity flux at the surface is given by (Rood Reference Rood1995; Gharib & Weigand Reference Gharib and Weigand1996)
 $$\begin{eqnarray}\unicode[STIX]{x1D708}\boldsymbol{n}\boldsymbol{\cdot }\unicode[STIX]{x1D735}\unicode[STIX]{x1D74E}=\boldsymbol{n}\times \left[\frac{\unicode[STIX]{x2202}\boldsymbol{u}}{\unicode[STIX]{x2202}t}+\boldsymbol{u}\boldsymbol{\cdot }\unicode[STIX]{x1D735}\boldsymbol{u}+\frac{\unicode[STIX]{x1D735}p}{\unicode[STIX]{x1D70C}}-\boldsymbol{g}\right].\end{eqnarray}$$
Flux of vorticity can be related to the change in circulation and in vorticity convected by the flow. For instance Dabiri & Gharib (Reference Dabiri and Gharib1997) experimentally investigated the flux of vorticity through the free surface of a spilling water wave and found the surface tangential acceleration to be the preponderant term for the vorticity flux. Parasitic capillary waves on the forward face of a gravity wave have been experimentally studied by Duncan et al. (Reference Duncan, Qiao, Philomin and Wenz1999) and Qiao & Duncan (Reference Qiao and Duncan2001). Mui & Dommermuth (Reference Mui and Dommermuth1995) and Sajjadi (Reference Sajjadi2002) performed numerical simulations of such flows and obtained the vorticity field below these waves. They observed separation of the flow in the trough and injection of vorticity. Vorticity injection at flow separation for a quasi-steady breaker was studied by Lin & Rockwell (Reference Lin and Rockwell1995) who showed that the transition is very sensitive to the Froude number, and that the circulation injected in the flow in the case of separation is twice that in case of non-separation.
Present curvilinear coordinate system.
 $\boldsymbol{s}$
and
 $\boldsymbol{n}$
are the vectors tangent and normal to the surface, respectively.
 $s$
is the curvilinear coordinate along the surface.
 $R$
is the local radius of curvature.

When separation occurs at a free surface, Lugt (Reference Lugt1987) showed that a single separating streamline is always perpendicular to the surface, while double separating streamlines have an angle of
 $90^{\circ }$
between them. Unlike separation at a wall, there is no defined criterion for separation at a surface. Contributing factors include curvature and surface vorticity (Sébilleau, Limat & Eggers Reference Sébilleau, Limat and Eggers2009). Agbaglah et al. (Reference Agbaglah, Thoraval, Thoroddsen, Zhang, Fezzaa and Deegan2015) showed that curvature alone or vorticity alone are not the sole criterion for separation in drop impact cases.
Interaction of vortices with a free surface has been experimentally studied using counter-rotating vortex pairs or rings generated with flapping foils (Willert & Gharib Reference Willert and Gharib1997), submerged wings (Sarpkaya & Henderson Reference Sarpkaya and Henderson1985) and pulsed or synthetic jets (Davies & Driscoll Reference Davies and Driscoll1974; Bernal & Kwon Reference Bernal and Kwon1989; Sarpkaya & Suthon Reference Sarpkaya and Suthon1991). Numerically, Yu & Tryggvason (Reference Yu and Tryggvason1990) studied the Froude and Weber numbers dependency of the surface signature of 2-D vortex pair and 2-D submerged shear layer using an inviscid vortex/boundary integral technique incorporating surface tension. Ohring & Lugt (Reference Ohring and Lugt1991) showed the generation of surface vorticity and secondary vortices of opposite sign as the primary vortex pair reaches the surface and deforms it. Vortex reconnection to a free surface is explained in detail by Gharib & Weigand (Reference Gharib and Weigand1996), who described a two-step process involving flux of vorticity through free surface acceleration. Three-dimensional numerical studies have been performed (Dommermuth Reference Dommermuth1993; Zhang, Shen & Yue Reference Zhang, Shen and Yue1999) shedding light onto the reconnection process. Vorticity from the bulk is stretched and turned in the blockage layer, then the viscous layer diffuses the vorticity to the surface at which point the reconnection takes place.
Surfactants can also induce surface vorticity as they generate shear stress when the surface is stretched by the flow (Hirsa & Willmarth Reference Hirsa and Willmarth1994). This type of surface vorticity generation can happen at a flat surface, conversely to generation through surface curvature.
The present study focuses on short (
 $\unicode[STIX]{x1D706}\approx 2$
mm) and steep (
 $ak>1$
) waves created by a horizontal shear layer that rolls up into vortices, and the subsequent generation of vorticity at the surface. As a result, counter-rotating vortex pairs (CRVP) are formed, and can lead to air entrainment. The first part of this paper (§ 2) describes the experimental set-up and the diagnostics employed. An overview of the several flow regimes is presented in a descriptive manner. The next part (§ 3) presents qualitative results on CRVP and air entrainment obtained with planar laser induced fluorescence (PLIF). Quantitative measurements are performed with particle image velocimetry (PIV), and are reported and analysed in the next section (§ 4). The 3-D nature of the flow is then characterized in § 5 by imaging the flow in the spanwise direction using several flow visualization techniques. This finally allows understanding the underlying physical processes, and two air entrainment mechanisms are proposed in § 6 to explain the observed phenomena.
2 Experimental set-up
2.1 Test facility
The facility consists of a high-speed water jet discharging into a transparent acrylic open channel surrounded by ambient air. A two-dimensional contoured nozzle generates a 20.3 mm-thick (
 $=h$
) by 146.0 mm-wide top-hat laminar jet which velocity is controlled from 1 to
 $5~\text{m}~\text{s}^{-1}$
, corresponding to jet thickness-based Reynolds, Weber and Froude numbers of
 $Re_{h}=2.0\times 10^{4}$
to
 $1.0\times 10^{5}$
,
 $We_{h}=5.7$
to
 $28$
and
 $Fr_{h}=2.2$
to 11. The jet mean velocity is measured with a magnetic flowmeter (accuracy is 0.2 % of reading for the present range of velocities), and the boundary layer thickness at the nozzle exit is computed with a coupled potential flow/boundary layer solver to an accuracy of 5 %. Flat plates of various length can be affixed to the nozzle exit to increase the boundary layer thickness for a given flow velocity. See André & Bardet (Reference André and Bardet2012) for more details of the facility design and characterization of the jet. The large width-to-thickness ratio allows one to consider the jet as initially two-dimensional far from the channel walls, where a narrow wake is created in this supercritical flow (
 $Fr_{h}>1$
). Additionally, the top and bottom boundary layer thicknesses are less than 1 mm in the measurement region. This dimension is small compared to the jet thickness, therefore, the free surface can be considered unaffected by the bottom wall. Thus, the boundary conditions of this study are equivalent to a semi-infinite uniform flow with a 2-D shear layer below a free surface.
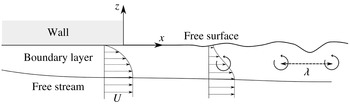
Diagram (not to scale) showing the formation of 2-D waves from the unstable relaxation of a shear layer rolling up into vortices.

Tap water is used as a fluid and the return tank is covered to prevent additional accumulation of contaminants. The contaminants and surfactants already present in the fluid are homogeneously mixed by the pump and do not have time to significantly adsorb at the surface of the jet upon exiting the nozzle, preventing the formation of a surfactant film in the measurements region. The effects of flow tracers (PIV particles and rhodamine 6G -R6G- fluorescent dye for PLIF) on surface tension and surface viscosity are evaluated in André & Bardet (Reference André and Bardet2015b
). They are found to have negligible effects on the interface properties for the present PIV measurements, and the surface tension of the water used in the PIV measurements is measured at
 $72.0\pm 0.1~\text{mN}~\text{m}^{-1}$
at
 $20.8\,^{\circ }\text{C}$
using a DuNouy ring tensiometer. However, in the PLIF configuration, the presence of higher concentration R6G (
 $10^{-4}$
M) at the surface is expected to modify the surface tension, although the change is relatively small (
 ${\sim}7\,\%$
) for non-particle-laden water.
2.2 Flow regimes
Figure 2 shows a diagram of the flow near the top exit of the nozzle. The boundary layer inside the nozzle becomes a free surface shear layer as the boundary layer exits the nozzle. The presence of an inflexion point in the velocity profile of the shear layer can lead to inviscid instability (Lin Reference Lin1966), and cause roll up of the layer into vortices that deform the surface at a wavelength
 $\unicode[STIX]{x1D706}$
. The jet thickness is not depicted in figure 2 because it is not a relevant length scale for this flow. Therefore, Reynolds, Weber and Froude numbers are defined based on
 $\unicode[STIX]{x1D703}$
and
 $U$
, as follows:
 $Re_{\unicode[STIX]{x1D703}}=\unicode[STIX]{x1D703}U/\unicode[STIX]{x1D708}$
,
 $We_{\unicode[STIX]{x1D703}}=\unicode[STIX]{x1D70C}\unicode[STIX]{x1D703}U^{2}/\unicode[STIX]{x1D70E}$
and
 $Fr_{\unicode[STIX]{x1D703}}=U/\sqrt{\unicode[STIX]{x1D703}g}$
, with
 $\unicode[STIX]{x1D708}$
,
 $\unicode[STIX]{x1D70C}$
and
 $\unicode[STIX]{x1D70E}$
the liquid kinematic viscosity, density and surface tension, respectively.
 $g$
is the gravitational acceleration. Boundary layer thickness, which scales proportionally with momentum thickness by a factor of 7.5 (Blasius solution), could have also been used as a length scale for this flow. However, momentum is conserved during the relaxation (neglecting momentum transfer by interfacial shear stress), while shear layer thickness is not (Brennen Reference Brennen1970).
The stability of the shear layer depends on
 $Re_{\unicode[STIX]{x1D703}}$
, while
 $We_{\unicode[STIX]{x1D703}}$
is useful for characterizing the resulting surface deformation. Study of the shear layer instability, roll up and formation of moderate steepness 2-D surface waves is presented in André & Bardet (Reference André and Bardet2015a
) for
 $Re_{\unicode[STIX]{x1D703}}=143$
to 177 and
 $We_{\unicode[STIX]{x1D703}}=4.79$
to 6.61. The measured roll-up frequency is in agreement with the inviscid linear theory of Brennen (Reference Brennen1970) for
 $Re_{\unicode[STIX]{x1D703}}>160$
. Viscous effects decrease this frequency at lower
 $Re_{\unicode[STIX]{x1D703}}$
. Surface disturbances are observed to always stay in phase with the underlying vortices, confirming the forced nature of the waves.
Data presented here focus on higher
 $Re_{\unicode[STIX]{x1D703}}$
and
 $We_{\unicode[STIX]{x1D703}}$
regimes than in André & Bardet (Reference André and Bardet2015a
), where waves become very steep (
 $ak>1$
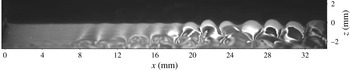
) and eventually transition to a 3-D surface profile. Figure 3 shows a typical aspect of the free surface streamwise profile for developed instability. The free surface is initially flat upon exiting the nozzle. The surface then shows disturbances that rapidly lead to large-amplitude waves. The region of interest in the present study, where phenomena such as flow separation at the free surface, transition to three dimensions and air entrainment occur, is located where these large-amplitude waves start interacting with each other, such as for
 $x>20$
mm in figure 3.
Due to the presence of vortices, dimensionless numbers based on circulation,
 $\unicode[STIX]{x1D6E4}$
, are also defined. In this flow, circulation is location dependent since vorticity fluxes out as the shear layer relaxes. Over one wavelength,
 $\unicode[STIX]{x1D6E4}$
ranges from
 $\unicode[STIX]{x1D6E4}_{0}=U\unicode[STIX]{x1D706}$
at the nozzle exit where the surface tangent velocity
 $u_{s}=0$
to
 $\unicode[STIX]{x1D6E4}=0$
as
 $x\rightarrow +\infty$
where
 $u_{s}\rightarrow U$
. The resulting dimensionless numbers based on
 $\unicode[STIX]{x1D6E4}_{0}$
are
 $Re_{\unicode[STIX]{x1D6E4}}=\unicode[STIX]{x1D6E4}_{0}/\unicode[STIX]{x1D708}$
,
 $We_{\unicode[STIX]{x1D6E4}}=\unicode[STIX]{x1D70C}\unicode[STIX]{x1D6E4}_{0}^{2}/\unicode[STIX]{x1D70E}\unicode[STIX]{x1D706}$
, and
 $Fr_{\unicode[STIX]{x1D6E4}}=\unicode[STIX]{x1D6E4}_{0}/\sqrt{g\unicode[STIX]{x1D706}^{3}}$
. Table 1 summarizes the flow parameters for the data presented here. Note that case 121 makes use of a 25.4 mm long flat extension plate at the nozzle exit to increase
 $\unicode[STIX]{x1D703}$
for a given
 $U$
. As a result,
 $Re_{\unicode[STIX]{x1D703}}=222$
is obtained at a free stream velocity of
 $2.46~\text{m}~\text{s}^{-1}$
. No other case presented here uses an extension plate.
Typical low magnification profilometry showing the evolution of the surface profile. Nozzle exit is visible on the left of the image at
 $x=0$
mm and flow is to the right.
 $Re_{\unicode[STIX]{x1D703}}=211$
,
 $We_{\unicode[STIX]{x1D703}}=9.86$
.

Parameters and dimensionless numbers of the experimental cases presented in this work. Case 138 is almost identical to case 72, but was recorded two years later.

3 Flow visualization
3.1 PLIF set-up
In the PLIF configuration, the laser forms a vertical streamwise-oriented light sheet, while R6G at a concentration of about
 $10^{-4}$
M is entrained in the upper boundary layer, upstream of the nozzle. The dye is initially at the free surface of the jet and acts as a passive flow tracer, which reveals qualitative features of the flow there. It absorbs the 527 nm light from the frequency doubled dual cavity Nd:YLF pulsed laser (Photonics DM30-527-DH) and emits at longer wavelengths. A V710 Phantom high-speed camera with high magnification optics (
 $M=1{-}6$
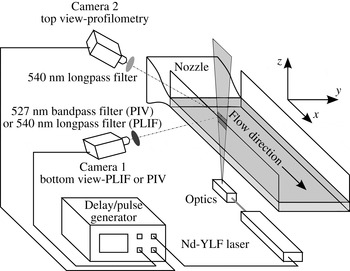
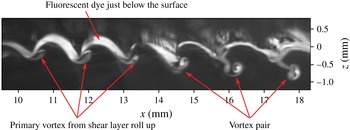
) fitted with a 540 nm long-pass filter records PLIF images from below the surface through the side wall of the channel. Images are recorded at a frame rate ranging from 7.5 kHz (full resolution of 1 megapixel) to 20 kHz (reduced resolution), allowing one to time resolve the flow and identify temporally coherent structures. A diagram of this set-up is shown in figure 4, and figure 5 shows an example of such data where the dye, initially contained just below the surface, has been entrained by coherent flow structures below the surface. The temporal evolution of the dyed structures confirms that the dye is not simply advected from upstream, but marks currently active structures. The region seen above the interface is a spurious reflection of the PLIF signal by the surface. For a flat surface, the image of this region is the symmetrical of the one below the surface, which allows reconstructing the interface location; however, for a wavy surface, the mirrored image is highly disturbed and identification of the surface location is difficult.
Diagram of the experimental set-up for PLIF flow visualization (only bottom camera is used) and combined profilometry
 $+$
PIV (both cameras are used).

PLIF image of case 72. Flow structures such as vortices are revealed with PLIF flow visualization.

3.2 Vortex pairing
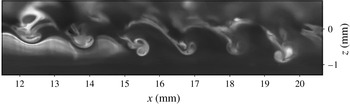
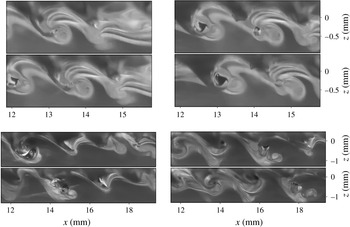
Figure 5 shows a high magnification PLIF image of case 72 exhibiting formation of CRVPs. The primary vortex that formed during the roll up of the shear layer is indicated by arrows. The second vortex originates from the trough and detaches from the surface as the trough recesses. This phenomenon is repeatably observed around
 $Re_{\unicode[STIX]{x1D703}}=177{-}222$
and
 $We_{\unicode[STIX]{x1D703}}=7.59{-}13.9$
. For instance, figures 5 and 6 have been recorded two years apart, and show the same pattern. After detachment from the surface, a CRVP travels downwards under its induced velocity. It also rotates counter-clockwise, indicating that the primary vortex has stronger circulation than the secondary. The wave is initially very steep and skewed by the primary vortex. The trough is not precisely resolved in the PLIF images, but the curvature is higher there than at the crest. After the injection of the CRVP, the surface curvature at the trough decreases.
PLIF image of case 138. Flow regime and location similar to that of figure 5, but recorded two years later.

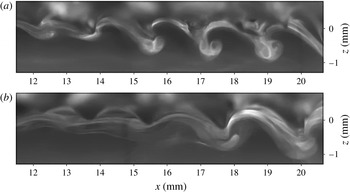
At the inception of the CRVP phenomenon, vortex pairs are created in short series of less than ten events, separated by intervals when they are not observed. In the latter case, the primary vortex and its pull on the trough are still visible. This is illustrated in the two images of figure 7, where CRVPs are visible in one frame, but not in the other. The rightmost vortex of the second image of figure 7 has a PLIF signature similar to that of the first image in the early stage of CRVP formation; thus it is possible that the CRVP formation occurs further downstream, out of the current field of view (FOV).
PLIF images of case 134. CRVPs are intermittently observed.

Therefore, there are some variations in the streamwise location at which the CRVPs are injected into the flow. The waves generating these CRVP are initially two-dimensional (uniform in the spanwise direction). In light of the previous observations, the 2-D nature of the CRVPs can be questioned: if streamwise variations of the phenomenon exist, it is possible that spanwise variations are present as well. Furthermore, asymmetrical CRVP are unstable. Additional data, shown in the following section, address this question.
3.3 Air entrainment
At
 $Re_{\unicode[STIX]{x1D703}}>190$
air bubbles are observed in the PLIF images and appear to be entrained from the wave troughs. Direct illumination of bubbles by the laser sheet results in reflections, which create glare on the images despite the long-pass filter. Better images of air entrainment are obtained when the bubbles are located in front (foreground) of the laser sheet. This becomes a shadowgraphy technique: the set-up is the same as for PLIF, except that the camera is focused slightly in front of the laser sheet plane. Fluorescent dye uniformly dissolved in the flow (from previous PLIF runs for instance) produces a uniform background lighting.
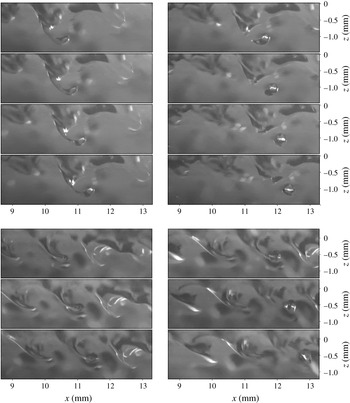
Time series shadowgraphy of two air entrainment events of case 79. The trough of a wave forms a ligament of air that pinches off, releasing an air bubble in the liquid.
 $50~\unicode[STIX]{x03BC}\text{s}$
between images of first sequence.
 $100~\unicode[STIX]{x03BC}\text{s}$
between images of second sequence.

Figure 8 shows two time series PLIF shadowgraphy of air entrainment events. In these sequences, the chronological order goes from top to bottom, then left to right. Both sequences present a similar evolution: before the creation of the bubble, the trough is extremely stretched, forming a thin air ligament. Its length-to-diameter ratio increases up to 4, after which it breaks up. The resulting bubble has a diameter of approximately 0.3–0.4 mm. At such a diameter, bubbles quickly tend towards a spherical shape to minimize surface energy (Clift, Grace & Weber Reference Clift, Grace and Weber2005) which causes the bubble to oscillate, as visible in figure 8. Although only one break-up event is shown in each sequence, multiple other air ligaments are visible in figure 8 such as in the background (out of focus) in the first sequence and upstream and downstream in the second sequence.
Air ligaments and bubbles clearly indicate that the flow is now three-dimensional in nature. To qualitatively investigate the relationship between air entrainment and CRVP, the shadowgraphy technique used above is combined with PLIF as done for the CRVP visualization. This is possible because the background dye concentration used for shadowgraphy is much lower than that of the injected dye. The close proximity of the air entrainment event to the flow structure identified with PLIF is guaranteed by the narrow depth of focus at high magnification (
 ${<}1$
mm), which limits the distance between laser sheet plane and foreground features that can be resolved.
For the same flow regime as figure 6, dye is injected to visualize the flow structures surrounding air entrainment events, and results are presented in figure 9 for two sequences. In both cases, a CRVP is clearly visible in the background of the ligament that pinches off. The bubble is located in the foreground and in the wake of this CRVP, which has significantly rotated compared to what is seen in figure 7. Another deep trough is formed in the last two images of the first sequence of figure 9. This structure is larger than the previously described ligament, and does not lead to bubble pinch off within the FOV.
Quantitative data are required to shed more light onto the mechanism creating these CRVP, their nature and how they play a role on air entrainment.
Time series PLIF shadowgraphy of two air entrainment events of case 138. CRVP (PLIF in the background) and air entrainment (shadowgraphy in the foreground) are visible.
 $133.3~\unicode[STIX]{x03BC}\text{s}$
between images of first sequence.
 $400~\unicode[STIX]{x03BC}\text{s}$
between images of second sequence. Images have been contrast enhanced and cropped to the regions of interest.

4 PIV measurements
4.1 PIV set-up
4.1.1 Data acquisition and processing
PIV is performed in the liquid in the direct vicinity of the surface with a camera mounted similarly to the vertical streamwise PLIF set-up. The flow is seeded with
 $2~\unicode[STIX]{x03BC}\text{m}$
diameter silver coated hollow glass spheres (Potters Industries SG02S40). A second high-speed camera (Phantom V311) records from above the surface (top view profilometry) to resolve the interface profile which is not readily available from the PIV images alone due to reflections from the interface. During the PIV measurements, the flow is homogeneously dyed with R6G at
 $10^{-6}$
M to extract the surface profile from the top view images, which are employed as a PLIF system. A 540 nm long-pass filter transmits this signal to the top view camera while removing light scattered by the particles and refracted by the interface. A narrow band-pass filter centred on the laser wavelength (527 nm) is mounted on the bottom view camera to remove the PLIF signal and collect only the PIV signal scattered from the particles. The interface location is extracted from the top view images, which provides a mask for processing the PIV data. The layout of the experimental set-up is shown in figure 4. Data are processed with the commercial software Davis 8.1 from LaVision Inc. using a multipass FFT (fast Fourier transform) cross-correlation scheme with decreasing interrogation window size. The final window size is
 $24\times 24$
pixels with a 50 % overlap for case 121, and
 $32\times 32$
pixels with a 75 % overlap for case 132. The experimental technique, profilometry, and PIV processing are described in more details in André & Bardet (Reference André and Bardet2014).
Acquisition parameters for the PIV data are detailed in table 2. The PIV recording rate varies between 8 and 16 kHz depending on the flow velocity. For instance, at lower velocity, such as case 121, data are recorded at 16 kHz (
 $\unicode[STIX]{x1D6FF}t=62.5~\unicode[STIX]{x03BC}\text{s}$
between images pairs and
 $\unicode[STIX]{x0394}t=62.5~\unicode[STIX]{x03BC}\text{s}$
between PIV vector fields) leading to a time series of PIV frames. Higher velocity runs, such as case 132, can still be time resolved, but require frame straddling to maintain an acceptable particle displacement between image pairs. In this mode, images pairs are recorded at 8 kHz (
 $\unicode[STIX]{x0394}t=125~\unicode[STIX]{x03BC}\text{s}$
) and a delay of
 $\unicode[STIX]{x1D6FF}t=20~\unicode[STIX]{x03BC}\text{s}$
was selected between the firing of each laser cavity. Continuously pumped pulsed lasers, even from the same manufacturer, exhibit small biases between cavities when measuring the timing between
 $Q$
-switch triggering and actual optical pulse (Bardet, André & Neal Reference Bardet, André and Neal2013). For the present laser, a timing discrepancy of 175 ns was measured between cavities using a high-speed photodiode (Thorlabs DET10A). If not corrected in the timing sequence or accounted for in the processing of the PIV data, this would induce a systematic error of 0.3 % and 0.9 % on instantaneous and mean velocities for the time series and frame straddling modes, respectively. The image magnification (
 $M$
) is 2.78 for the PIV data of case 132 which results in a spatial resolution of
 $\unicode[STIX]{x0394}x=58~\unicode[STIX]{x03BC}\text{m}$
between adjacent velocity vectors. This is of the order of the Stokes boundary layer for the present flow length scale (
 ${\sim}10^{-5}$
m). Thus surface vorticity can be approximatively measured for case 132 by extrapolation of the vorticity field adjacent to the surface (details given in André & Bardet (Reference André and Bardet2014)), but not for case 121, as
 $\unicode[STIX]{x0394}x$
is larger.
Acquisition and processing parameters of the PIV data.

4.1.2 Data post-processing
From the combined PIV/profilometry data, surface profile, curvature and velocity are calculated, as well as surface vorticity, following the methods described in André & Bardet (Reference André and Bardet2014). The equation for the out of plane surface vorticity in the present 2-D curvilinear coordinate system shown in figure 1 is given by (4.1) where
 $\unicode[STIX]{x1D705}$
is the surface curvature,
 $\unicode[STIX]{x1D707}$
the dynamic viscosity and
 $\unicode[STIX]{x1D70F}_{n=0}$
the interfacial shear stress:
 $$\begin{eqnarray}\unicode[STIX]{x1D714}_{n=0}=2\frac{\unicode[STIX]{x2202}u_{n}}{\unicode[STIX]{x2202}s}-2u_{s}\unicode[STIX]{x1D705}-\frac{\unicode[STIX]{x1D70F}_{n=0}}{\unicode[STIX]{x1D707}}.\end{eqnarray}$$
On the liquid side, the shear-free boundary condition allows neglecting
 $\unicode[STIX]{x1D70F}_{n=0}/\unicode[STIX]{x1D707}$
. Measurement of
 $\unicode[STIX]{x1D70F}_{n=0}$
showed that this assumption is valid, and introduces an error of only 2 % on
 $\unicode[STIX]{x1D714}_{n=0}$
(André & Bardet Reference André and Bardet2015b
). The shear-free boundary condition is therefore equivalent to a surface vorticity boundary condition, equation (4.2), which corresponds to (1.1) expressed in the current coordinate system:
 $$\begin{eqnarray}\unicode[STIX]{x1D714}_{n=0}^{BC}=2\frac{\unicode[STIX]{x2202}u_{n}}{\unicode[STIX]{x2202}s}-2u_{s}\unicode[STIX]{x1D705}.\end{eqnarray}$$
Similarly, the flux of out of plane vorticity through the interface, equation (1.2), becomes
 $$\begin{eqnarray}\unicode[STIX]{x1D708}\boldsymbol{n}\boldsymbol{\cdot }\unicode[STIX]{x1D735}\unicode[STIX]{x1D714}=\frac{\unicode[STIX]{x2202}u_{s}}{\unicode[STIX]{x2202}t}+u_{n}\unicode[STIX]{x1D714}_{n=0}+\frac{1}{2}\frac{\unicode[STIX]{x2202}(u_{s}^{2}+u_{n}^{2})}{\unicode[STIX]{x2202}s}+\frac{1}{\unicode[STIX]{x1D70C}}\frac{\unicode[STIX]{x2202}p}{\unicode[STIX]{x2202}s}-g\sin \unicode[STIX]{x1D6FE},\end{eqnarray}$$
with
 $\unicode[STIX]{x1D6FE}$
the streamwise surface slope. The five terms contributing to the flux are surface acceleration, advected surface vorticity, advective acceleration, pressure gradient and gravity, in the same order as they appear in the right-hand side of (4.3). The surface normal dynamic boundary condition gives access to the pressure at the interface (Lundgren & Koumoutsakos Reference Lundgren and Koumoutsakos1999):
 $$\begin{eqnarray}p=p_{gas}+\unicode[STIX]{x1D70E}\unicode[STIX]{x1D705}-2\unicode[STIX]{x1D707}\left(\frac{\unicode[STIX]{x2202}u_{s}}{\unicode[STIX]{x2202}s}+u_{n}\unicode[STIX]{x1D705}\right).\end{eqnarray}$$
Assuming a constant surface tension and constant pressure on the gas side, the pressure gradient of (4.3) can be written according to
 $$\begin{eqnarray}\frac{\unicode[STIX]{x2202}p}{\unicode[STIX]{x2202}s}=\unicode[STIX]{x1D70E}\frac{\unicode[STIX]{x2202}\unicode[STIX]{x1D705}}{\unicode[STIX]{x2202}s}-2\unicode[STIX]{x1D707}\left(\frac{\unicode[STIX]{x2202}^{2}u_{s}}{\unicode[STIX]{x2202}s^{2}}+u_{n}\frac{\unicode[STIX]{x2202}\unicode[STIX]{x1D705}}{\unicode[STIX]{x2202}s}+\unicode[STIX]{x1D705}\frac{\unicode[STIX]{x2202}u_{n}}{\unicode[STIX]{x2202}s}\right).\end{eqnarray}$$
As done by Dabiri & Gharib (Reference Dabiri and Gharib1997), the running integral with respect to
 $s$
of (4.3) is calculated to obtain the net vorticity flux,
 $\unicode[STIX]{x1D719}$
, through the surface between arbitrary points
 $s_{0}$
and
 $s_{1}$
:
 $$\begin{eqnarray}\unicode[STIX]{x1D719}=\int _{s_{0}}^{s_{1}}\unicode[STIX]{x1D708}\boldsymbol{n}\boldsymbol{\cdot }\unicode[STIX]{x1D735}\unicode[STIX]{x1D714}\,\text{d}s.\end{eqnarray}$$
These equations are derived for a 2-D flow to be used with the 2-D velocity fields obtained with PIV. Although the flow transitions to three dimensions at some point, 2-D data are still valuable to understand it, but the results have to be carefully interpreted considering the possible effects of out of plane motion.
4.2 Vortex pairing
4.2.1 Vorticity fluxes
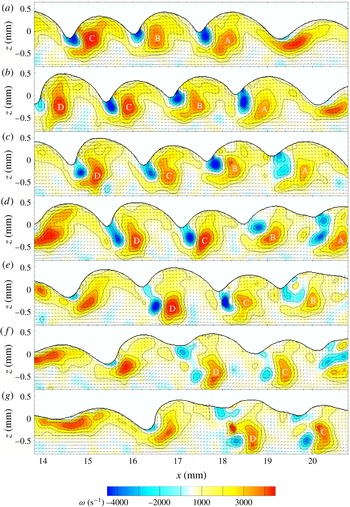
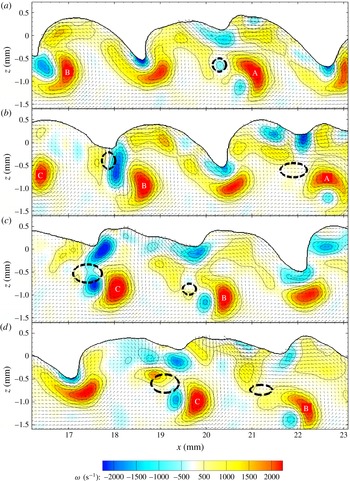
Figure 10 shows a time series of PIV vector fields with vorticity contour plot for case 132. Formation of several CRVPs can be followed from frame to frame. The vortices resulting from the shear layer roll up are visible as patches of high positive vorticity below the surface and are identified with capital letters. The surface above the vortices is raised and skewed towards the upstream direction. Negative vorticity is seen in the vicinity of sharp troughs such as at
 $x=14.7$
, 16.1 and 17.7 mm in panel (a). In the following panels, the flow is separating in these troughs. Separation is promoted there by the large surface curvature and flow induced by the primary vortex. Surface-generated negative vorticity that was confined near the surface, and only viscously diffusing, is now advected following separation, injecting large amount of negative circulation into the bulk of the flow. Generation and diffusion of vorticity from the surface is first analysed, then the separation process is detailed.
Time series of PIV vector fields with vorticity colour plot for case 132.
 $250~\unicode[STIX]{x03BC}\text{s}$
between frames (every other PIV frame). Every other vector is displayed for clarity. The primary vortex of each CRVP is labelled in every frame to help following the CRVPs.

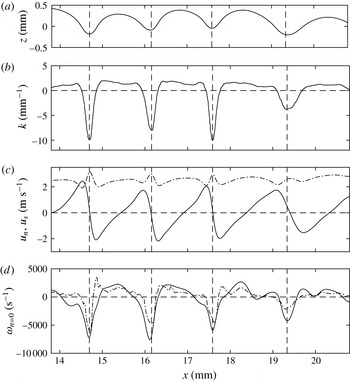
Surface profile, curvature, velocity and vorticity for figure 10(a) are presented in figure 11. Calculations are performed in curvilinear coordinates, and the results are converted back in Cartesian coordinate (
 $x,z$
) to allow visualizing of the data in the reference of the surface profile. The curvature is plotted in figure 11(b) where troughs have negative values down to (
 $-10~\text{mm}^{-1}$
). Crests have a positive curvature, of lower magnitude and almost constant (
 $2~\text{mm}^{-1}$
) as the crests are more rounded than the troughs. Such curvature asymmetry between crests and troughs is similar to that of the pure capillary wave theory derived by Crapper (Reference Crapper1957). The surface velocity is projected along
 $\boldsymbol{n}$
and
 $\boldsymbol{s}$
and plotted in figure 11(c). The surface vorticity is computed using (4.2) and plotted along with the vorticity obtained directly with a central difference scheme of the PIV data extrapolated at the surface location, figure 11(d). The two curves follow the same trends and show a good agreement. Surface vorticity is higher in magnitude in the troughs (down to
 $-7500~\text{s}^{-1}$
) as a consequence of the high curvature there, as noted by Longuet-Higgins (Reference Longuet-Higgins1992).
Surface data results figure 10(a), case 132. (a) Surface profile. (b) Surface curvature. (c) Surface normal (solid line) and tangential (dot-dashed line) velocities. (d) Surface vorticity calculated using (4.2) (solid line) and vorticity extrapolated at the surface from the PIV vorticity field obtained with a central difference scheme (dot-dashed line). The vertical dashed lines mark the trough locations.

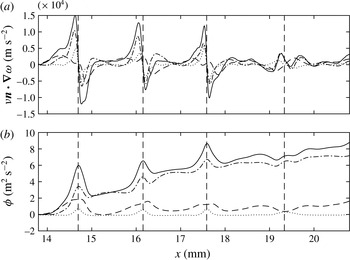
Vorticity flux results for figure 10(a), case 132. (a) Local vorticity flux calculated using (4.3) (solid line). (b) Integrated vorticity flux along the surface (4.6) (solid line). Contributions of advected surface vorticity (dot-dashed line), advective acceleration (dashed line) and pressure gradient (dotted line) from (4.3) are also plotted in both cases. Contributions of gravity and surface acceleration are negligible and are not plotted for clarity. The vertical dashed lines mark the trough locations.

Figure 12(a) presents the results for the surface normal flux of surface parallel (out of plane) vorticity for figure 10(a) calculated according to (4.3). The overall flux is plotted along with each of the contributing terms. Gravity contributes negligibly to the vorticity flux, as expected from the high Froude number, table 1. Contribution of surface acceleration is also small because when viewed in the frame of reference of the waves, the temporal gradients are small compared to the spatial gradients. Advective acceleration of the surface and advected vorticity are the main contributors to the overall flux. The magnitude of the vorticity flux is larger near the troughs. Contribution of the pressure gradient term is not negligible either. An analysis of the magnitude of the terms of the pressure gradient, equation (4.5), shows that the predominant contributor is the first curvature gradient term
 $(\unicode[STIX]{x1D70E}/\unicode[STIX]{x1D70C})\unicode[STIX]{x2202}\unicode[STIX]{x1D705}/\unicode[STIX]{x2202}s$
which results from the pressure difference across a curved surface induced by surface tension. The second curvature gradient term
 $(-2\unicode[STIX]{x1D707}u_{n}/\unicode[STIX]{x1D70C})\unicode[STIX]{x2202}\unicode[STIX]{x1D705}/\unicode[STIX]{x2202}s$
is negligible because
 $|-2\unicode[STIX]{x1D707}u_{n}|\approx 0.006~\text{N}~\text{m}^{-1}$
and
 $\unicode[STIX]{x1D70E}=0.072~\text{N}~\text{m}^{-1}$
, thus
 $|-2\unicode[STIX]{x1D707}u_{n}|\ll \unicode[STIX]{x1D70E}$
.
The net vorticity flux into the flow is better visualized by integrating along the surface following (4.6), which is plotted in figure 12(b) for each of the components of the flux. As for the local flux, contributions of gravity and surface acceleration are negligible. The pressure gradient is now only a minor contributor to the net flux. Indeed, when integrating the predominant contributor of the pressure gradient term (first term of (4.5)) between two arbitrary points of the surface,
 $s_{a}$
and
 $s_{b}$
, one obtains
 $(\unicode[STIX]{x1D70E}/\unicode[STIX]{x1D70C})(\unicode[STIX]{x1D705}(s_{b})-\unicode[STIX]{x1D705}(s_{a}))$
. Therefore, the net flux due to pressure gradient between two points where the curvature is equal is approximately zero. Nevertheless, the effect of the pressure gradient on the net flux in the trough is still visible as small spikes at the locations of maximum curvature.
Because
 $\boldsymbol{n}$
is defined pointing outward of the liquid,
 $\unicode[STIX]{x1D708}\boldsymbol{n}\boldsymbol{\cdot }\unicode[STIX]{x1D735}\unicode[STIX]{x1D714}>0$
can be interpreted either as a flux of positive vorticity out of the liquid or a flux of negative vorticity into the liquid. The advected surface vorticity flux component (dot-dashed line in figure 12
b) exhibits net positive jumps across each trough, which is consistent with the diffusion of negative vorticity into the liquid observed in the troughs in the PIV data shown in figure 10. The advective acceleration component (dashed line in figure 12
b) also shows a total positive net flux, with a periodic pattern along the surface. This term relates to the spatial acceleration of the free surface as the shear layer relaxes, which can be observed as an overall increase of
 $u_{s}$
in figure 11(c). This acceleration leads to a flux of positive vorticity out of the liquid, which also results in a positive flux with a periodic modulation due to the vortices. Finally, figure 12(b) shows that the total net flux is mostly due to the advected vorticity and a small contribution from the advective surface acceleration.
4.2.2 Flow separation and CRVP formation
The analysis of the surface quantities confirms the generation of vorticity at the surface and its viscous diffusion into the flow. However, negative circulation initially remains located close to the trough. Injection of large amount of circulation deep in the flow is caused by flow separation from the surface as explained thereafter.
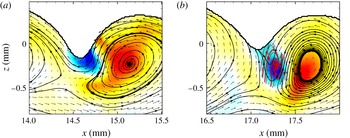
The flow field in the vicinity of a trough before and after separation is shown in figures 13(a) and 13(b) respectively, where streamlines are plotted in the frame of reference moving with the primary vortex. The primary vortex and its effect on the surface are clearly visible in the first frame. For a non-separated flow at moderate wave steepness, the streamlines near the surface follow closely the surface profile as the latter moves at about the same speed as the primary vortices, see André & Bardet (Reference André and Bardet2015a ). As the wave steepens, the near-surface streamlines get further apart and away from the trough, meaning that the flow slows down in that region.
Just after separation, figure 13(b), the streamlines previously near the trough are now deep in the flow, then connect to the surface at the trough, at an angle close to
 $90^{\circ }$
. Two streamlines appear to merge near the trough which could correspond to a stagnation point, or be a result of the flow becoming three-dimensional. The size of this flow feature is at the limit of the current spatial resolution and no definitive conclusion can be drawn here. These streamlines point up, which confirms the surface is now moving upward there, and the trough is recessing as observed in figure 10(d–f) near the CRVPs C and D. Negative vorticity is found where the streamlines curve clockwise, and the presence of the secondary vortex, detached from the surface, is confirmed by looking at the swirling strength (Zhou et al.
Reference Zhou, Adrian, Balachandar and Kendall1999). This secondary vortex is better visualized by plotting the streamlines in a frame of reference moving with that vortex (overlaid in red in figure 13
b).
The negative vorticity that was initially confined near the surface when the flow was still attached is now convected downward under the influence of the primary positive vortex. The generation of negative vorticity in the trough drops as the surface velocity and curvature decrease in magnitude following the separation event.
Streamline plots of the flow before (a, from figure 10(a) event C) and after separation (b, from figure 10(d) event C).
 $750~\unicode[STIX]{x03BC}\text{s}$
between frames. Every vector is displayed. Same vorticity colour plot as figure 10. The black streamlines are plotted in the frame of reference moving with the primary vortex while the red streamlines in (b) are plotted in the frame of reference moving with the secondary vortex and only where vorticity is negative.

4.2.3 CRVP evolution
Once detached from the surface, the secondary vortex interacts with the primary vortex to form a CRVP, as shown in the time series of figure 10. Negative vorticity can also be shed in the wake of the secondary vortex, as for CRVP D in figure 10. This is a consequence of negative vorticity forming more than one vortex as it is injected. The CRVP located at
 $x=15.5$
mm in figure 6 shows a residual negative vorticity vortex in the wake of the CRVP.
The time-resolved data allow one to follow the evolution of several variables of interest such as vortex centroids, circulation, enstrophy and 2-D kinetic energy (KE). In order to compute only the data relevant to the vortices, the swirling strengths,
 $\unicode[STIX]{x1D706}_{ci}$
, are used for conditional integration of the quantities of interest. More precisely, where vortical structures exist, there is a pair of complex eigenvalues of the velocity tensor, i.e.
 $\unicode[STIX]{x1D706}_{ci}\neq 0$
. Furthermore, to also distinguish between quantities related to positive vortex and negative vortex, the vorticity field is split into a positive field,
 $\unicode[STIX]{x1D714}^{+}=\max (0,\unicode[STIX]{x1D714})$
, and a negative field,
 $\unicode[STIX]{x1D714}^{-}=\min (0,\unicode[STIX]{x1D714})$
, which satisfy
 $\unicode[STIX]{x1D714}=\unicode[STIX]{x1D714}^{+}+\unicode[STIX]{x1D714}^{-}$
. In the following, only expressions for the quantity related to the positive vortex are presented; negative quantities are obtained similarly using
 $\unicode[STIX]{x1D714}^{-}$
instead of
 $\unicode[STIX]{x1D714}^{+}$
. Note that possible residual or neighbouring vortices are not included in the following computations by manually limiting the integration domain to an area slightly larger than the maximum size of the vortex being investigated. This spatial mask is required because several primary and secondary vortices are present in each frame. Vortex cross-section area is given by:
 $$\begin{eqnarray}A^{+}=\iint _{\unicode[STIX]{x1D706}_{ci}\neq 0,\unicode[STIX]{x1D714}^{+}\neq 0}\,\text{d}x\,\text{d}z.\end{eqnarray}$$
Circulation is given by:
 $$\begin{eqnarray}\unicode[STIX]{x1D6E4}^{+}=\iint _{\unicode[STIX]{x1D706}_{ci}\neq 0}\unicode[STIX]{x1D714}^{+}\,\text{d}x\,\text{d}z\end{eqnarray}$$
and the vorticity centroid:
 $$\begin{eqnarray}(x_{\unicode[STIX]{x1D6E4}^{+}},z_{\unicode[STIX]{x1D6E4}^{+}})=\frac{1}{\unicode[STIX]{x1D6E4}^{+}}\iint _{\unicode[STIX]{x1D706}_{ci}\neq 0}(x,z)\unicode[STIX]{x1D714}^{+}\,\text{d}x\,\text{d}z.\end{eqnarray}$$
The CRVP angle is defined as the angle between the line intersecting the vorticity centroids and the horizontal. It is computed using the four-quadrant inverse tangent in order to account for angles greater than
 $90^{\circ }$
:
 $$\begin{eqnarray}\unicode[STIX]{x1D6FC}=\text{a tan2}(z_{\unicode[STIX]{x1D6E4}^{+}}-z_{\unicode[STIX]{x1D6E4}^{-}},x_{\unicode[STIX]{x1D6E4}^{+}}-x_{\unicode[STIX]{x1D6E4}^{-}}).\end{eqnarray}$$
The enstrophy and 2-D kinetic energy of the CRVP are calculated as follows:
 $$\begin{eqnarray}\displaystyle & \displaystyle EN=\iint _{\unicode[STIX]{x1D706}_{ci}\neq 0}\unicode[STIX]{x1D714}^{2}\,\text{d}x\,\text{d}z, & \displaystyle\end{eqnarray}$$
 $$\begin{eqnarray}\displaystyle & \displaystyle KE=\frac{1}{2}\iint _{\unicode[STIX]{x1D706}_{ci}\neq 0}\Vert \boldsymbol{u}\Vert ^{2}\,\text{d}x\,\text{d}z. & \displaystyle\end{eqnarray}$$
Note that kinetic energy is calculated using the absolute velocity (in the frame of reference of the laboratory), therefore it includes vortical and translational motions. Change in circulation, enstrophy and 2-D kinetic energy are related to viscous dissipation and 3-D nature of the flow (Ortega, Bristol & Savas Reference Ortega, Bristol and Savas2003). For example, Helmholtz’s theorem states that circulation is conserved in an inviscid, barotropic flow with conservative body forces. If these assumptions hold, a decrease of circulation measured in a streamwise plane must be compensated by an increase of circulation in a different plane, which implies the flow cannot be considered two-dimensional anymore. A change in vorticity magnitude and vortex cross-section area in incompressible flows can be also the signature of vortex tilting and stretching.
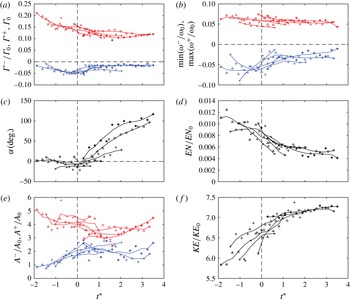
Figure 14 shows the evolution of circulation, maximum vorticity, angle, enstrophy, cross-section surface area and 2-D kinetic energy for 5 CRVP events of case 132, including those labelled A, C and D from figure 10. CRVP B is not plotted because of noisy data, as visible in figure 10(e,f). Time is normalized by the time scale based on the circulation per wavelength at the nozzle exit
 $t^{\ast }=t/t_{\unicode[STIX]{x1D6E4}_{0}}$
with
 $t_{\unicode[STIX]{x1D6E4}_{0}}=\unicode[STIX]{x1D706}^{2}/\unicode[STIX]{x1D6E4}_{0}=\unicode[STIX]{x1D706}/U=4.64\times 10^{-4}$
s. Circulation is normalized by
 $\unicode[STIX]{x1D6E4}_{0}$
, vorticity is normalized by
 $\unicode[STIX]{x1D714}_{0}=U/\unicode[STIX]{x1D703}$
, enstrophy is normalized by
 $EN_{0}=U^{2}\unicode[STIX]{x1D706}/\unicode[STIX]{x1D703}$
, area is normalized by
 $A_{0}=\unicode[STIX]{x1D703}\unicode[STIX]{x1D706}$
and kinetic energy is normalized by
 $KE_{0}=U^{2}\unicode[STIX]{x1D706}\unicode[STIX]{x1D703}$
.
Evolution of (a) circulations, (b) extremum vorticities, (c) angle of the CRVP to the horizontal, (d) enstrophy, (e) cross-section surface area and (f) 2-D kinetic energy for 5 CRVP events of case 132. Primary vortex data are plotted in red, secondary vortex data in blue. Quantities encompassing both are plotted in black. Symbols are raw data points, and solid lines are data smoothed with a moving average filter of length 5.
 $t^{\ast }=0$
corresponds to flow separation in the trough, marked by a vertical dashed line. PIV data are recorded at 8 kHz, resulting in a time separation of
 $125~\unicode[STIX]{x03BC}\text{s}$
(or
 $0.270t_{\unicode[STIX]{x1D6E4}_{0}}$
) between data points. Symbols
 $\times$
,
 $\triangle$
and
 $+$
correspond to the CRVPs labelled A, C and D in figure 10, respectively.

The data collapse relatively well when the time origin,
 $t^{\ast }=0$
, is taken as the instant of flow separation from the surface in each respective event. The circulation of the primary vortex decreases during the injection process, and stabilizes around
 $7.5\times 10^{-4}~\text{m}^{2}~\text{s}^{-1}$
(
 $\unicode[STIX]{x1D6E4}^{+}/\unicode[STIX]{x1D6E4}_{0}=0.12$
) after
 $t^{\ast }=1$
. The measured circulation of the primary vortex is one order of magnitude lower than the chosen circulation scale
 $\unicode[STIX]{x1D6E4}_{0}$
because it depends on the surface velocity. The latter is initially 0 at the nozzle exit, but quickly increases as the shear layer relaxes, resulting in vorticity fluxing out of the liquid. At the present measurement location, the mean value of
 $u_{s}$
is approximately
 $0.7U$
according to figure 11, which means the total circulation per wavelength is now down to 30 % of its initial magnitude. The vortex circulation is only a fraction of this as it is summed only over the region of non-zero swirling strength, equation (4.8). Additionally, the vortex dimension is only a fraction of a wavelength, therefore the square root of the vortex area is chosen as a length scale to calculate the actual
 $Re_{\unicode[STIX]{x1D6E4}}$
,
 $We_{\unicode[STIX]{x1D6E4}}$
and
 $Fr_{\unicode[STIX]{x1D6E4}}$
based on measured circulation. These numbers are
 $7.7\times 10^{2}$
, 14.3 and 17.9, respectively.
Negative circulation in the secondary vortex increases in magnitude before separation, which corresponds to the build-up of negative circulation from the vorticity flux in the trough. This build-up is also shown by the increase in secondary vortex surface area, figure 14(e). The negative vorticity extremum (b) stays constant during the build-up preceding separation, (
 ${\approx}-5\times 10^{3}~\text{s}^{-1}$
or
 $\unicode[STIX]{x1D714}^{-}/\unicode[STIX]{x1D714}_{0}=-0.06$
) as the value is related to the surface generated vorticity.
Before separation, the CRVP is horizontal (
 $\unicode[STIX]{x1D6FC}=0$
), figure 14(c). Once detached from the surface, the difference in circulation magnitude induces a rotation around the CRVP centroid, at a nearly constant rate.
When separation occurs (
 $t^{\ast }=0$
), the secondary vortex size stays nearly constant, figure 14(e), but the vorticity and circulation magnitudes drop. High magnitude negative vorticity is observed only in the vicinity of the troughs before separation, figure 10. Generation of surface vorticity drops following flow separation, as the curvature of the trough quickly decreases and the interface moves away from the CRVP.
During the whole event, the vorticity maximum of the primary vortex decreases only slightly due to viscous effects. Based on the Lamb formula for a single vortex, vorticity is expected to decay by 50 % after
 $t_{50\,\%}=Re_{\unicode[STIX]{x1D6E4}}/2\unicode[STIX]{x1D714}_{(t=0)}$
(Ohring & Lugt Reference Ohring and Lugt1991). For the measured values of
 $Re_{\unicode[STIX]{x1D6E4}}$
and
 $\unicode[STIX]{x1D714}_{(t=0)}^{+}$
,
 $t_{50\,\%}\approx 0.1$
s. This duration is equal to
 $216t^{\ast }$
and therefore is relatively long compared to the present time scale. Over the time scale of a CRVP injection (
 ${\approx}4t^{\ast }$
), vorticity is expected to decay viscously by approximately 2 %.
The cross-section area of the primary vortex decreases by about 25 % up to
 $t^{\ast }=2$
, resulting in a decrease in positive circulation. Enstrophy decreases after separation and seems to plateau around
 $2.5\times 10^{6}~\text{mm}^{2}~\text{s}^{-2}$
(
 $EN/EN_{0}=0.005$
) after
 $t^{\ast }=2$
. Kinetic energy is measured in the stationary frame of reference of the laboratory, therefore, it increases when the CRVP moves away from the surface. Once it reaches the bulk velocity, the 2-D KE also plateaus after
 $t^{\ast }=2$
, at approximately
 $8.2\times 10^{6}~\text{mm}^{4}~\text{s}^{-2}$
(
 $KE/KE_{0}=7.2$
) as the CRVP translates at the free stream velocity.
For case 132, no air entrainment is observed. The CRVPs behave very similarly during build-up and separation, as shown by the collapse of the data in figure 14. Some differences concerning the secondary vortex (maximum vorticity and cross-section area) and angle of the CRVP appear towards the later stage, which also suggests a possible transition to three dimensions, although the number of data points there is too low to conclude. These variations are not visible in the enstrophy and KE plot, most likely because the contribution of the primary vortex is dominant in these quantities. Nevertheless, since separation does not occur at the same time or streamwise location for these CRVPs (for the 5 samples plotted here, the downstream location of separation ranges from
 $x=14$
to 17 mm), it can be assumed that separation may not occur at the same spanwise location for a given CRVP. Confirming this requires tracking the CRVP over a longer time, or using other techniques as presented in § 5.
In summary, the formation of a CRVP results from generation of negative vorticity at the free surface. Diffusion then increases the circulation just below the surface. However, it is not until the flow separates at the surface that a secondary vortex is released, as shown in figure 13. Separation criteria are not definitely identified, but figure 14(a) suggests for this case a possible limiting value of negative circulation since this quantity reaches an extremum of
 $\unicode[STIX]{x1D6E4}^{-}/\unicode[STIX]{x1D6E4}_{0}=-0.05$
(
 $\unicode[STIX]{x1D6E4}^{-}=-3.2\times 10^{-4}~\text{m}^{2}~\text{s}^{-1}$
) just before separation in all cases. At separation, streamlines connect the free surface in the trough which moves upwards, leaving the secondary vortex in the flow where it interacts with the primary vortex. The temporal evolution of the quantities related to the CRVPs is relatively consistent when observed relative to the separation time. Therefore, although a CRVP may be modulated spanwise, the behaviour seems independent of the spanwise location where it is observed.
4.3 Air entrainment
Air entrainment is initiated in a mechanism similar to vortex pairing. In particular, figure 8 showed that CRVPs are also present during air entrainment events. To compare the case of CRVP alone with CRVP and air entrainment, time-resolved PIV is performed for the latter, and the time series data are analysed. A time series vector field for case 121 is presented in figure 15. As mentioned earlier, this set-up makes use of an extension plate to obtain
 $Re_{\unicode[STIX]{x1D703}}=222$
at
 $U=2.46~\text{m}~\text{s}^{-1}$
. This compares to a value of
 $Re_{\unicode[STIX]{x1D703}}$
of 205 and 195 for the data shown in figures 8 and 9, respectively. Due to the extension plate, the Weber number is smaller for case 121 (
 $We_{\unicode[STIX]{x1D703}}=7.59$
) than for the other air entrainment cases without extension plate (
 $We_{\unicode[STIX]{x1D703}}>12$
).
PIV time series for CRVP accompanied by air entrainment for case 121.
 $750~\unicode[STIX]{x03BC}\text{s}$
between frames (one in every twelve PIV frames). Every vector displayed. Dashed line ellipses mark the location of bubbles observed at the edge of the laser sheet. The primary vortex of each CRVP is labelled in every frame to help follow the CRVPs.

In the sequence reported in figure 15, both cavities of the PIV laser were used to reach a 16 kHz repetition rate. Because one cavity produces a beam slightly wider than the other, a small part of the bubbles located near the far edge of the laser sheet is illuminated every other frame. This allows tracking these bubbles – located just behind the PIV plane – which are reported in figure 15 as dashed line ellipses. The shape of the bubble is not expected to be accurate since only a portion of the bubble is intersected. Furthermore, as shown in the PLIF visualization data, bubbles undergo oscillations after entrainment as they stabilize to the minimum energy spherical shape. The flow just in front of a bubble is still resolved with PIV since most of the laser sheet thickness is not clipped by the bubble. In this regime, the surface is highly three-dimensional and reflects some laser light towards the PIV camera causing glares and preventing some regions of the flow from being correctly resolved. Therefore, there are some outliers near the interface, and no attempt at resolving the surface data, as done in the previous section, is made here. Instead, attention is focused on the subsurface flow.
Air bubbles are seen in the wake of the CRVPs of figure 15, similarly to the PLIF observations of figure 9. In these two cases, the CRVPs are in a plane just next to the bubbles (CRVP behind the bubble for the PLIF images and in front of it for PIV data). However unlike case 132, the various CRVPs of case 121 shown in figure 15 evolve differently from each other. For instance, after separation, the magnitude of the negative vorticity of CRVP labelled B decreases significantly, and the pair rotates quickly and moves the secondary vortex away from the bubble. The CRVP A also rotates quickly and looks similar to B (CRVP A in panel (a) compares to CRVP B in panel (d)). Conversely, the CRVP labelled C in figure 15 rotates only slightly and the bubble stays close to the secondary vortex. For all air entrainment events, positive vorticity is being shed in the wake of the bubble. As also noted in the previous section, not every wave leads to a CRVP; for instance, no separation is visible in the present FOV for the trough located between CRVP A and B and the primary vortex simply passes under the trough.
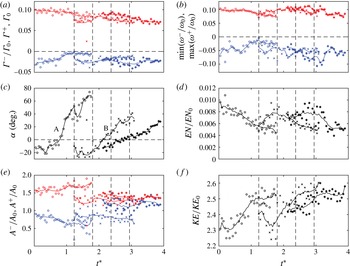
Figure 16 shows temporal evolution (with
 $t_{\unicode[STIX]{x1D6E4}_{0}}=1.32\times 10^{-3}$
s) and integral quantities defined earlier for the three CRVP events of figure 15. Note that due to the presence of bubbles in the flow and 3-D interface, the results are noisier than in the case of CRVP only, in particular for the secondary vortex, which is initially in the vicinity of the bubble. However, the sampling rate here is twice that of § 4.2.3, and the free stream velocity is lower, resulting in more data points per CRVP. Thus the length of the moving average filter is increased to span 9 data points, instead of 5 in the results of § 4.2.3. Because separation time is not available for each CRVP, and they behave differently, the time reference is the same for all three events, arbitrarily set at
 $t^{\ast }=0$
when the first CRVP (A) enters the FOV.
Similar analysis as in figure 14 for the three CRVP of case 121 shown in figure 15. Letters in (c) correspond to CRVPs labelled in figure 15.
 $t^{\ast }=0$
marks the appearance of the first CRVP in the FOV. Vertical dashed lines marked the time corresponding to the frames shown in figure 15. PIV data are recorded at 16 kHz, resulting in a time separation of
 $62.5~\unicode[STIX]{x03BC}\text{s}$
(or
 $0.0473t_{\unicode[STIX]{x1D6E4}_{0}}$
) between data points. For each CRVP, trend lines are obtained with a moving average over 9 data points.

The CRVP labelled A follows a similar evolution as the CRVPs presented in § 4.2.3 with an overall decrease of circulation and vorticity magnitude.
 $Re_{\unicode[STIX]{x1D6E4}}$
,
 $We_{\unicode[STIX]{x1D6E4}}$
and
 $Fr_{\unicode[STIX]{x1D6E4}}$
based on measured circulation and area of the primary vortex are
 $8.0\times 10^{2}$
, 13.3 and 15.0, respectively. Separation occurs around
 $t^{\ast }=0.8$
, as visible on the angle plot, and the negative circulation is
 $\unicode[STIX]{x1D6E4}^{-}/\unicode[STIX]{x1D6E4}_{0}=-0.03$
(
 $\unicode[STIX]{x1D6E4}^{-}=-2.4\times 10^{-4}~\text{m}^{2}~\text{s}^{-1}$
), instead of
 $-0.05$
for case 132 in § 4.2.3. Normalized primary vortex area is also much smaller here (
 ${\approx}1.5$
versus 4 in case 132). This can also be seen in the PIV vector fields where the primary vortices of figure 15 occupy a smaller fraction of the wave than those of figure 10.
After separation, the primary vortex cross-section area increases, and conversely for the secondary vortex. Enstrophy and kinetic energy quickly decreases and increases, respectively, followed by a lower rate of change in the later times. All these observations are similar to those of figure 14. The quantities of CRVP C are markedly different: negative circulation (a) is higher in magnitude, and leads to a lower rotation rate (c). Vortex areas (e) are approximately constant, and almost equal. After a period of increase in magnitude, the negative vorticity (b) drops at
 $t^{\ast }=3.3$
from
 $-0.1$
to
 $-0.05$
. Since the vortex area is constant, decrease in vorticity correlates with the decrease in circulation (a) and enstrophy (d) around the same time. The evolution of the CRVP B is in-between that of A and C. This is remarkably true for almost all quantities plotted in figure 16, and particularly for the rotation rate. Circulation decreases slightly, maximum and minimum vorticities are about constant, vortex surface areas are more similar than A but not as close as for C. The enstrophy plot is very similar to C while kinetic energy plot is similar to A.
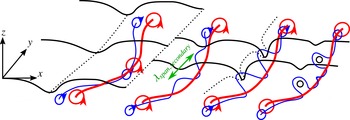
The 3-D nature of the flow field, even in the early stage just after separation, is supported by the observed diversity of the evolution of the CRVPs. In particular, increases in circulation, vorticity and enstrophy, as well as changes in vortex cross-section area are possible signature of vortex tilting and stretching. Air entrainment appears associated with CRVP undergoing spanwise and streamwise non-uniformity, as suggested by the PLIF images. Explanations for the transition of the CRVP from two to three dimensions, and their interaction with the air entrainment process are presented in the following section.
5 Spanwise observations
The measurements so far have been performed in a vertical streamwise plane (constant spanwise location). By taking advantage of the numerous optical accesses to the flow, several qualitative imaging techniques are deployed to examine the 3-D nature of the CRVPs and air entrainment in the spanwise direction.
5.1 Surface profile
The 3-D surface profile is first observed. The technique is similar to that used for obtaining the 2-D profilometry described in § 3.1, except that the flow is now illuminated volumetrically with the laser. The lens aperture is reduced and the camera angle with respect to the horizontal is increased to approximately
 $45^{\circ }$
to resolve the surface in the spanwise direction.
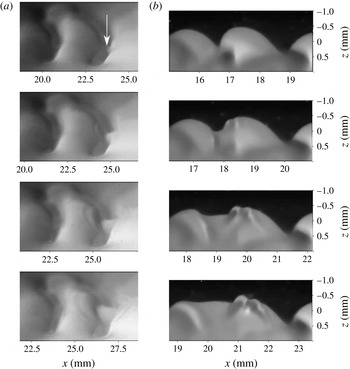
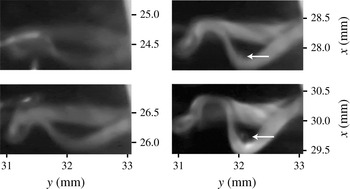
Figure 17(a), shows a time series of such images for case 121, during separation of the flow in the trough of the wave. The waves are still locally two-dimensional in the first frame, although there is a slight curve of the crest profile in the spanwise direction corresponding to the chevron-like features reported in the literature. The white arrow indicates the location of initial flow separation, which coincides with the spanwise part of the trough that is the most downstream. From this initial separation point, concentric transverse waves or ripples, propagate and are observed over the following frames. Particularly, the ripples are present on both the upstream and downstream crests. One wavelength of these capillaries is measured at about 0.3 mm, which is of the order of the diameter of curvature of the trough before separation. The phase speed is measured at
 $1.2~\text{m}~\text{s}^{-1}$
, in agreement with free capillary wave theory (
 $c=\sqrt{2\unicode[STIX]{x03C0}\unicode[STIX]{x1D70E}/\unicode[STIX]{x1D706}\unicode[STIX]{x1D70C}}=1.5~\text{m}~\text{s}^{-1}$
).
A similar event is observed in figure 17(b), for the same case, in a 2-D profilometry sequence. Ripples are also seen coming from the trough. It cannot be determined from this sequence alone whether initial separation occurred in this plane, or in a different plane, then propagated to be visible in these images. The trough elevation rises at
 $0.5~\text{m}~\text{s}^{-1}$
. This set of images of the surface shows that separation and CRVP injection do not occur simultaneously along the wave span for a given trough. Instead it is initiated at one point then propagates along the wave span. It also reveals that the initial flow separation triggers secondary concentric ripples that freely propagate. Other imaging techniques and views are deployed in the next two subsections to further characterize this event.
It should be mentioned that careful analysis of the PLIF profilometry data of case 132 shows the presence of ripples, although they are not readily visible in figure 10.
PLIF images of the surface for case 121. (a) 3-D (volumetric illumination) surface profile from an angle of
 $45^{\circ }$
above the surface. Vertical scale (spanwise) is therefore shrunk by a factor of
 ${\approx}1.4$
. The arrow indicates the initial location of flow separation.
 $400~\unicode[STIX]{x03BC}\text{s}$
between frames. (b) 2-D (planar illumination) calibrated profilometry (aspect ratio is 1).
 $400~\unicode[STIX]{x03BC}\text{s}$
between frames. Sequences were recorded independently.

5.2 Multiple plane PLIF
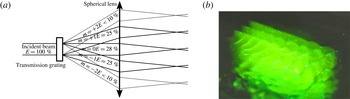
To confirm the effect of non-uniform flow separation on CRVP injection, it is attempted to simultaneously illuminate and record the flow structures at several spanwise locations below the surface. To do so, a transmission diffractive grating is used to split the laser beam into multiple beamlets. A converging lens, placed at its focal distance from the grating, collimates these beamlets, as shown in figure 18(a). The beamlets distance from the centreline is given by
 $F\tan (\arcsin (m\unicode[STIX]{x1D6EC}/L))\approx m\unicode[STIX]{x1D6EC}F/L$
, with
 $L$
the grating line spacing,
 $\unicode[STIX]{x1D6EC}$
the laser wavelength,
 $F$
the lens focal length and
 $m$
the diffraction order. Beamlets are then shaped into sheets with a cylindrical lens, and their lateral spacing further adjusted with a telescope.
The energy distribution (
 $E$
) for this particular grating (
 $110~\text{lines}~\text{mm}^{-1}$
) is indicated in figure 18(a). Figure 18(b) shows three bright sheets, corresponding to the diffraction orders
 $m=-1$
, 0 and +1, which have similar intensity. The orders
 $m=-2$
and
 $m=+2$
are slightly visible too, but do not carry enough energy to be useful for imaging.
Actual sheet spacing when recording PLIF images is approximately 1 mm. The camera is positioned at a greater angle below the horizontal (
 ${\approx}30^{\circ }$
) compared to the single plane PLIF recording in order to vertically offset each plane on the images. Although magnification was decreased to increase depth of field, only two planes could be simultaneously brought into focus.
(a) Optical set-up to generate parallel beams using a diffraction grating. (b) Photograph of the multiple plane PLIF set-up from above the surface. Waves and residual PIV particles are visible. The spacing of the sheets is approximately 2 mm here.

Time series PLIF of case 72 showing CRVPs in two parallel planes separated by 1 mm.
 $800~\unicode[STIX]{x03BC}\text{s}$
between frames. The white arrows track a CRVP in the two planes on each frame. The red arrow points at an air ligament.

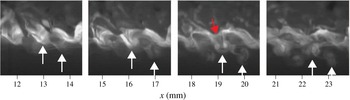
Figure 19 presents a time series of such images during a vortex pairing event for case 72. The arrows at the bottom of the images identify a single CRVP on both planes and from frame to frame. The tracked CRVP appears similar in each plane in the first and second frames. The trajectory then differs in the last two frames. This is particularly clear in the third frame, where the CRVP angle is close to zero (horizontal) and very close to the trough in the foreground plane, while it is almost at
 $90^{\circ }$
(vertical) and far from the surface in the background plane. A similar CRVP event can be distinguished one wavelength downstream. These observations are direct evidence of the 3-D nature of the CRVP event. No air entrainment is visible in this sequence, although long air ligaments are visible in the foreground of the first frame and in the wake of the CRVP in the third frame, as marked by a red arrow.
5.3 Horizontal plane PLIF
PLIF is here performed in a horizontal plane to obtain further information on the spanwise structures, and investigate the relationship between ripples and propagation of separation in the spanwise direction. The laser sheet is arranged horizontally just below the mean free surface, and the camera is pointing up and recording vertically through the bottom wall of the channel. The flow is from bottom to top in the images, and the chronological order is from top to bottom, as before.
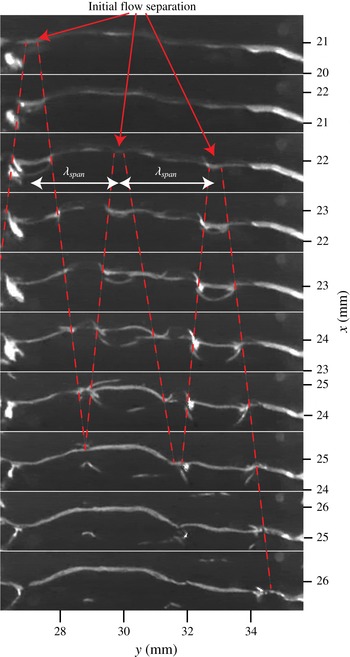
A time series of a wave undergoing flow separation for case 72 is shown in figure 20. In these images, no dye is injected and the light is simply reflected by the surface. Because the light sheet is below the mean surface profile (
 $z=0$
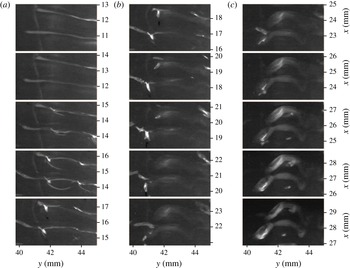
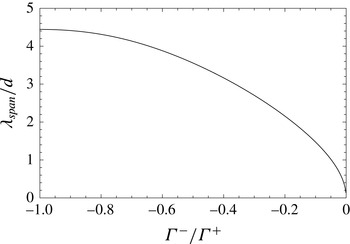
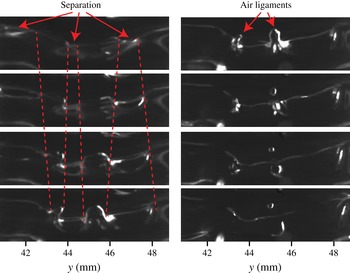
mm) only surface features below that level are visible. In the first two frames, the trough shows as a nearly straight line spanning entirely the FOV. The following frames reveal several curved features that appear to move away from localized regions of the trough. In light of the observations of § 5.1, these features are identified as ripples emanating from flow separation in the trough. More precisely, separation is here initiated at three distinct spanwise points, indicated by arrows, and regularly spaced as indicated by
 $\unicode[STIX]{x1D706}_{span}$
in figure 20. Each separation event is associated with the generation of a train of ripples that propagate radially. The spanwise wavefronts of these ripples are marked by dashed lines.
Here, ripples are visible primarily near the trough and upstream of it. In these views, only the steepest waves are likely to be detected and hence this view is less rich in waves than observed in figure 17. In particular, the downstream component of the waves disappears from the image faster than the upstream. This is assumed to be because the downstream ripples quickly rise up on the steep wave, out of the horizontal illuminating sheet. The circular pattern of these ripples can still be clearly inferred even though they look somewhat oval due to their propagation on a curved, steep interface. It is conjectured that the point of flow separation in the trough moves spanwise with the ripples and that the CRVP is entirely detached from the free surface when adjacent ripples meet, i.e. where dashed lines intersect.
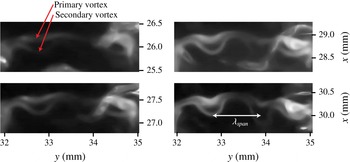
Between the dashed lines marking the flow separation, structures appear to be generated on the downstream side of the troughs. These features are referred to as tongue-like structures and might be the signature of the troughs becoming three-dimensional as the vortex pair detaches. This is better observed for higher Reynolds number flows and described in more details in the next section on air entrainment.
Time series images following a trough from below the surface for case 72.
 $133.3~\unicode[STIX]{x03BC}\text{s}$
between frames. No dye is injected, and light is simply reflected by the negative elevation surface features. Flow separation occurs at 3 points marked by arrows which differ in streamwise and spanwise location. Ripples are generated from the initial separation points and their propagation is marked by dashed lines.

It is attempted to visualize the CRVPs in this horizontal plane imaging by injecting fluorescent dye in the boundary layer, as done in § 3.1. Due to the Gaussian nature of the laser intensity profile, the fluorescent signal becomes strong only once the dye is convected down, by a CRVP for instance. As mentioned earlier, this temporal evolution also ensures the observed structures are active, and not just the results of earlier events being simply advected.
Time series images following two consecutive troughs from below the surface for case 72.
 $267~\unicode[STIX]{x03BC}\text{s}$
between frames. The entire sequence spans 4 ms. Sharp and brighter signal is caused by light reflection at the surface while diffuse and smooth signal is due to fluorescence.

Figure 21 shows a sequence where CRVPs are injected following flow separation in two consecutive troughs for case 72. The first phase (a) is similar to figure 20: the flow separates in the troughs, around the centre of the FOV, and ripples propagate from there, as visible starting in the third frame. In this case, separation occurs at the same spanwise location and same time for the two consecutive waves. During the second phase (figure 21 b), the troughs and ripples disappear as the surface returns to a less disturbed profile. At the same time, a fluorescent signal, aligned with the former location of the troughs, starts appearing. The fluorescent nature of this signal is inferred from its smooth appearance, in contrast with the sharp signal from light reflected by the free surface. The fluorescent signal intensity is increasing, which means that the dyed flow structures are moving downwards, into the brighter region of the laser sheet.
The structures are identifiable in figure 21(c) as a two CRVPs, one per trough. The CRVPs are not uniform spanwise; the spanwise location where flow separated first is now further downstream as it has had more time to rotate and translate. In figure 21(c), each vortex tube of a CRVP can be resolved. The secondary vortex, initially upstream of the primary one, is seen moving past and below the primary (towards the camera in this FOV) as observed in § 4.2.3.
The wavelength of the spanwise modulation of initial separation,
 $\unicode[STIX]{x1D706}_{span}$
, is approximately 3.0 mm (
 $=1.9\unicode[STIX]{x1D706}$
) in figure 20. The initial separation point can be located at a similar spanwise location for several waves in a row such as in figure 21, which results in train of CRVP as observed in figure 10 for instance. Nevertheless, there is no overall preferred spanwise location that could indicate an effect from the nozzle geometry.
One possible cause of modulation is primary vortex instability (Crow Reference Crow1970). The surface can be considered flat in the early stage of the flow for a distance that depends on
 $\unicode[STIX]{x1D703}$
and
 $We_{\unicode[STIX]{x1D703}}$
(André & Bardet Reference André and Bardet2015a
). No significant amount of vorticity has been generated by the surface at this point, and the flow can then be locally modelled using a virtual vortex that is the mirror image of the primary vortex by the interface. This is equivalent to a 2-D vortex pair with a circulation ratio of
 $-1$
and vortex centroid distance,
 $d$
, equal to twice the vortex depth. The vortex roll up occurs at a depth of the order of the initial boundary layer thickness, or
 $7.5\unicode[STIX]{x1D703}$
(0.33 mm) using Blasius approximation, thus
 $d=15\unicode[STIX]{x1D703}$
. Klein, Majda & Damodaran (Reference Klein, Majda and Damodaran1995) derived a linear stability theory for the spanwise instability of parallel vortex pairs of arbitrary circulation ratio. The most unstable wavelength as function of the circulation ratio is plotted in figure 22. For a ratio of
 $-1$
,
 $\unicode[STIX]{x1D706}_{span}/d=4.4$
, or
 $\unicode[STIX]{x1D706}_{span}=4.4d=66\unicode[STIX]{x1D703}=1.8\unicode[STIX]{x1D706}$
(2.9 mm for case 72). This analysis is for infinitesimal vortex disturbances (no vortex tilting or stretching), and does not consider effect of surface disturbances. Nevertheless the theory predicts a wavelength in agreement with the experimental measurement, and makes primary vortex instability a possible cause for the observed spanwise modulation. This could also be the cause of the spanwise chevron-like modulation observed at the surface, shown in figure 17(a).
A similar analysis as done by Yoon & Heister (Reference Yoon and Heister2004) using Ponstein (Reference Ponstein1959) theory was performed to find the spanwise wavelength that receives maximum growth rate. The predicted wavelength happens to be sensitive to
 $\unicode[STIX]{x1D6E4}^{+}$
, which decreases over time here. Based on figure 14,
 $\unicode[STIX]{x1D6E4}^{+}=0.1\unicode[STIX]{x1D6E4}_{0}{-}0.2\unicode[STIX]{x1D6E4}_{0}$
is evaluated, leading to
 $\unicode[STIX]{x1D706}_{span}=3$
and
 $2$
mm respectively. Despite the large uncertainty, this result also agrees with the experiment and with Klein’s theory.
Most unstable wavelength for vortex pair instability obtained by the linear theory analysis of Klein et al. (Reference Klein, Majda and Damodaran1995) as a function of the circulation ratio of the vortices.

The role of the ripples in the spanwise propagation of the separation is now studied. The speed at which separation propagates in the spanwise direction is estimated as follow: on average, a CRVP has locally rotated by
 $90^{\circ }$
between the time of initial and final separation, see figures 19 and 21. Based on the rotation rate from figure 16(c), the time it takes for a CRVP to rotated by
 $90^{\circ }$
is 1–1.5 ms. The propagation speed is obtained by dividing half the spanwise wavelength (since CRVP separation propagates in both direction in the trough) by that time, and is equal to
 $1{-}1.5~\text{m}~\text{s}^{-1}$
. This is similar to the ripples propagation speed (
 $1.2~\text{m}~\text{s}^{-1}$
), and supports the hypothesis that flow separation is propagated spanwise by these ripples.
6 Air entrainment mechanisms
Two air entrainment mechanisms are observed and reported.
6.1 Air entrainment from primary vortex instability
The formation process of the air bubbles observed in the wake of CRVPs is traced back to the point where adjacent ripples converge. Figure 23 presents a sequence of such events observed in horizontal plane PLIF. The first part is similar to that of CRVP formation, with local flow separation then spanwise propagation of ripples as depicted in figure 20. The spanwise wavelength is still consistent with the results of the previous section. The part of the trough where the flow is still attached is initially wide and tongue shaped, as reported in figure 20, then progressively narrows and becomes an air ligament as the surface rises on both sides. The apparent large ligament size reported in figure 9 might actually be such tongue-like structure.
Two ligaments are indicated in figure 23, and only the one located at
 $y=45$
mm results in entrapment of an air bubble approximately 0.25 mm in diameter. This is of the order of the ligament diameter, which is also consistent with diameter of curvature of the through and wavelength of ripples. The remain of the ligament disappears quickly, and the surface returns to a flatter profile. A final circular ripple, visible in the last two frames of figure 23, is created by the quick upward motion of the surface. For this air entrainment mechanism, ripples seem to be a necessary, but not sufficient condition for air entrainment. For instance, they are observed in figure 21 without resulting in air entrainment.
Time series images following a trough from below the surface for case 72.
 $133~\unicode[STIX]{x03BC}\text{s}$
between frames. An air bubble is entrapped at the spanwise location
 $y=45$
mm.

Following these observations, a model of the mechanism responsible for this type of air entrainment is proposed, and a schematic is shown in figure 24. Primary vortex is in red, and negative vorticity generated in the trough is in blue. The flow is initially two-dimensional from the boundary layer relaxation at the nozzle exit to the formation of moderate steepness waves (
 $ak<0.5$
) caused by shear layer roll up, shown on the left of figure 24. During this phase, some spanwise disturbances grow, presumably due to primary vortex instability as described in § 5.3. As the waves grow, these modulations induce local flow separation in the trough, and negative circulation is injected in the flow at these discrete spanwise locations, such as in the foreground and background planes of figure 24.
Upon separation, the trough elevation rises quickly due to the large surface tension force resulting from the high surface curvature. This generates secondary concentric surface waves, or ripples, that freely propagate radially from the initial separation point. The location of flow separation (also equivalent to the location of ripples wavefront) is marked by green dot-dashed lines on figure 24, which correspond to the red dashed lines of figures 20 and 23. As the ripples and separation propagate, the trough turns from a tongue-like shape to an air ligament.
The cause of the final break-up process is not clearly identified, but two possible mechanisms are considered: Rayleigh–Plateau instability and nonlinear interaction of the converging ripples. Based on PLIF images such as figures 5 and 9, the average length-to-diameter ratio of ligaments during break up is approximately 3. This is shorter than predicted by a pure Rayleigh–Plateau instability (ratio of most unstable mode is 4.5 for infinite ligament), and thus suggests that the ripples play a role in the break up, by forcing the Rayleigh–Plateau instability at a shorter wavelength for instance.
In the model of figure 24, the interaction between the secondary vortex and the bubble is not detailed, but would possibly involve vortex break up and reconnection.
Model of air entrainment by primary vortex instability. Instability wavelength indicated by green double-headed arrow. Primary vortex is in red, and negative vorticity generated in the trough is in blue. Green dot-dashed lines locates where separation occurs, also associated with surface ripples. An air bubble is entrapped where these ripples converge.

6.2 Air entrainment from secondary vortex instability
Another possibility of air entrainment mechanism has been identified from horizontal plane PLIF images in events where the CRVP completely detaches without entrapping air through the ligament break-up process described in § 6.1. Instead the CRVP undergoes a spanwise instability as shown in figure 25, with a spanwise wavelength measured at
 $\unicode[STIX]{x1D706}_{span}=1.0$
mm (or
 $23\unicode[STIX]{x1D703}$
), which is approximately one-third of the spanwise wavelength of the primary vortex instability discussed before. The primary vortex presents spanwise fluctuations, but of magnitude smaller than the secondary. The latter is weaker, and starts to wrap around the former to form so-called
 $\unicode[STIX]{x1D6FA}$
-loops. Such instability has been observed (Ortega et al.
Reference Ortega, Bristol and Savas2003) and modelled (Marshall, Brancher & Giovannini Reference Marshall, Brancher and Giovannini2001) for asymmetrical counter-rotating vortex pairs.
The surface acts as a virtual mirror on the flow, thus the CRVP has a self-induced flow which would be equivalent to a second CRVP located on the other side of the interface if the latter were flat. For simplicity, the effect of the image flow is not considered in the following analysis. From the PIV data of case 138 (conditions very close to case 72), the vortices centroids distance shortly after separation is measured at
 $d=0.35$
mm (
 $8\unicode[STIX]{x1D703}$
), and the circulation ratio
 $\unicode[STIX]{x1D6E4}^{-}/\unicode[STIX]{x1D6E4}^{+}=-0.25$
. Using figure 22 again, a most unstable mode at
 $\unicode[STIX]{x1D706}_{span}/d=2.5$
or
 $\unicode[STIX]{x1D706}_{span}=20\unicode[STIX]{x1D703}=0.9$
mm is predicted. This number is in agreement with the value measured in figure 25, which supports the hypothesis that the observed disturbance is due to a CRVP instability.
Time series of PLIF images in a horizontal plane just below the surface for case 72 showing spanwise CRVP instability with a wavelength of 1 mm.
 $400~\unicode[STIX]{x03BC}\text{s}$
between frames.

Time series of horizontal plane PLIF of case 72 following a single CRVP.
 $533~\unicode[STIX]{x03BC}\text{s}$
between frames. An air bubble or ligament, marked by arrows, is visible inside the
 $\unicode[STIX]{x1D6FA}$
-loop of the last two frames.

These
 $\unicode[STIX]{x1D6FA}$
-loops result in a downward-induced flow inside the loop, which is likely to pull on the surface above and lead to air entrainment. Figure 26 presents a time series of horizontal PLIF images showing such event for case 72. The wrapping of the secondary vortex – consistent with the sign of the vortices circulation – is seen as the CRVP moves downstream. The CRVP gets brighter as it moves down the flow where the laser sheet is more intense. The last two frames show a circular patch inside the
 $\unicode[STIX]{x1D6FA}$
-loop which resembles to the tip of an air ligament or a bubble. This is seen over several frames, and becomes more marked with time, which gives confidence that it is not an image artefact.
Following these observations, a model of the CRVP instability, and its interaction with the surface is proposed. A diagram of the model is shown in figure 27, where vortex lines are shown instead of vortex tubes for clarity. The first part of the flow is similar to the previous model, except that air is not entrapped at the end of the separation process. When the secondary vortex detaches from the surface, the CRVP undergoes a spanwise instability which modulates the secondary vortex to form
 $\unicode[STIX]{x1D6FA}$
-loops, two of which are depicted in figure 27.
Where the secondary vortex wraps around the primary, the CRVP is seen rotating and moving away from the surface. The initially rapid rotation of the CRVP
 $\boldsymbol{A}$
in the analysis of figure 16 is possibly the signature of such event.
At the centre of the
 $\unicode[STIX]{x1D6FA}$
-loops, the close proximity of the counter-rotating vortex pair results in the formation of a pseudo vortex ring. The latter is asymmetric in nature: the downstream branch of this ring is formed from the primary vortex which has stronger circulation than the upstream branch, composed of the stretched secondary vortex. Such flow structure leads to a downward-induced flow, which pulls on the surface to create an air ligament. This is actually shown in figure 19: the CRVP instability is well developed in the third frame, with the background plane showing the CRVP rotated by
 $90^{\circ }$
compared to the foreground plane. In the latter, an air ligament is pulled down through the centre of the CRVP. Although as mentioned earlier, no air entrainment is reported in that sequence, but it can be conceived that a stronger CRVP could cause the ligament to pinch off through Rayleigh–Plateau instability and entrap an air bubble in the liquid.
Model of air entrainment by CRVP. Same colour code as figure 24 with vortex lines instead of vortex tubes for clarity. Following separation, the CRVP instability form two
 $\unicode[STIX]{x1D6FA}$
-loops which pull the surface down in their centre.

7 Conclusions
Air entrainment in the relaxation of a horizontal shear layer below a free surface has been experimentally investigated. In this canonical and highly repeatable flow, vorticity generated at the free surface is observed to play a major role. It results in the injection of counter-rotating vortex pairs from the surface to the bulk of the flow for a range of parameters
 $Re_{\unicode[STIX]{x1D703}}=177{-}222$
and
 $We_{\unicode[STIX]{x1D703}}=7.59{-}13.9$
.
Using time-resolved PLIF and PIV, the CRVPs are established to originate from the interaction between shear layer roll up and free surface: positive circulation vortices deform the free surface in an initially periodic 2-D wavy profile, and negative vorticity is generated in the troughs as a consequence of the shear-free condition at the deformed surface. As the waves steepen, negative circulation accumulates in the troughs, until flow separation occurs there releasing a secondary vortex. Separation first happens locally, then extends in the spanwise direction accompanied with smaller freely propagating surface ripples. Primary and secondary vortices form a pair which moves away from the surface. The motion of the CRVPs is consistent between PLIF and PIV, and the latter allows measuring quantities of interest such as circulation and vortex cross-section area to infer possible 3-D phenomena. For
 $Re_{\unicode[STIX]{x1D703}}<190$
the CRVPs evolve consistently, and the various measured quantities collapse under a single trend. No air entrainment is observed then.
At
 $Re_{\unicode[STIX]{x1D703}}>190$
, air entrainment is observed in the trough of the waves. CRVPs are still present, but now exhibit different rotation rate, surface area and vorticity, which suggests vortex tilting and stretching. PLIF images taken in a horizontal plane below the surface show two air entrainment mechanisms. Their initiations can be explained by vortex instability: spanwise instability of the primary vortex with its image across the interface resulting in modulation of the initial separation points by approximately
 $2\unicode[STIX]{x1D706}$
, and causing the formation of tongue-shaped troughs which focus into air ligaments and pinch off into a bubble; and instability of the CRVP after complete separation from the surface. This leads to
 $\unicode[STIX]{x1D6FA}$
-loops at a spanwise wavelength of
 $0.6\unicode[STIX]{x1D706}$
and causes the surface to be pulled down into the loop and possibly to entrap air. The measured wavelengths of the first and second mechanisms are consistent with that predicted by linear stability analysis for the primary vortex and its virtual image across the surface, and for the CRVP, respectively. The pinch-off mechanism is not explained further, but likely involves a combination of Rayleigh–Plateau instability and ripple interaction.
Acknowledgements
This work was funded with start-up funding from the George Washington University to Dr Bardet and by the US Office of Naval Research, under the leadership of Drs T. C. Fu and K.-H. Kim.