1. Introduction
The Middle Miocene climate is an abrupt and dramatic instance of global warming and cooling during the long-term cooling trend of the Cenozoic Era (Savin et al. Reference Savin, Douglas and Stehli1975; Flower & Kennett, Reference Flower and Kennett1994; Zachos et al. Reference Zachos, Pagani, Sloan, Thomas and Billups2001; Böhme, Reference Böhme2003). It is characterized by two distinct features: the Middle Miocene Climatic Optimum (MMCO; 17–15 Ma), characterized by annual mean surface temperatures 3∼6 °C higher than today (Flower & Kennett, Reference Flower and Kennett1994; Zachos et al. Reference Zachos, Pagani, Sloan, Thomas and Billups2001; Böhme, Reference Böhme2003), and the Middle Miocene Climate Cooling (MMCC; 14.2–13.8 Ma), in which the global average temperature dropped more than 5 °C, a change associated with the formation of the East Antarctic ice sheet, eventually leading to the aridity of the middle- and high-latitude continental interiors, such as inland Asia, Australia, Africa, North America and South America (Retallack, Reference Retallack1992; Flower & Kennett, Reference Flower and Kennett1994; Webb, Reference Webb1997; Holbourn et al. Reference Holbourn, Kuhnt, Lyle, Schneider, Romero and Anderson2014). The Middle Miocene is considered the most critical interval, known as ‘the Middle Miocene Climatic Transition’ (Flower & Kennett, Reference Flower and Kennett1994; Zachos et al. Reference Zachos, Pagani, Sloan, Thomas and Billups2001), and represents a transition period from a relatively humid to arid climate. Because the Middle Miocene climate changes were unrelated to human activities, it is a research hotspot (Böhme, Reference Böhme2003). Until now, the MMCO and MMCC events have been widely reconstructed via oxygen isotope records from marine sediments (Flower & Kennett, Reference Flower and Kennett1994; Zachos et al. Reference Zachos, Pagani, Sloan, Thomas and Billups2001; Böhme, Reference Böhme2003).
The Tibetan Plateau experienced a strong uplift during Miocene time that changed the local precipitation patterns (Fang et al. Reference Fang, Zhang, Meng, Gao, Wang, King, Song, Dai and Miao2007; Lu & Xiong, Reference Lu and Xiong2009; Miao et al. Reference Miao, Fang, Herrmann, Wu, Zhang and Liu2011, Reference Miao, Herrmann, Wu, Yan and Yang2012; Lin et al. Reference Lin, Wyrwoll, Chen and Cheng2015). This effect made the Middle Miocene climatic transition more complicated in Central Asia; as a result, the cause of this regional climate change, whether global climatic changes or Tibetan Plateau uplift, is difficult to determine. Therefore, the identification and detailed characterization of the critical Middle Miocene climate transition in Central Asia is very important, as it can help us to comprehend this issue. The present investigations of the MMCO and MMCC in Asia mainly come from the humid regions (i.e. the east Asian monsoon region) at the eastern edge of the Tibetan Plateau (e.g. Hou et al. Reference Hou, Li, Song, Zhang, Hui, Chen and Xian2014; Lin et al. Reference Lin, Wyrwoll, Chen and Cheng2015; Zan et al. Reference Zan, Fang, Yan, Zhang and Lu2015; Lebreton-Anberrée et al. Reference Lebreton-Anberrée, Li, Li, Spicer, Zhang, Su, Deng and Zhou2016; Song et al. Reference Song, Wang, An, Qiang, Dong, Chang, Zhang and Guo2017; Dong et al. Reference Dong, Liu, An, Liu, Zhou, Qiang and Lu2018; Hui et al. Reference Hui, Zhang, Ma, Li, Peng, Li and Wang2018). Considering that the Tibetan Plateau has expanded towards the north and northeast since the Miocene Epoch (Tapponnier, Reference Tapponnier2001; Rowley & Currie, Reference Rowley and Currie2006), the climate evolution in arid regions close to the interior Tibetan Plateau may supply us with more sensitive information about climate drying and tectonics compared with information from the monsoon-sensitive regions.
The Qaidam Basin is an important petroliferous basin in the Tibetan Plateau that is characterized by fine-grained mixed sediments that developed during the Cenozoic Era (Xiong et al. Reference Xiong, Wu, Tan, Zhang, Bo, Ling, Ling, Yun, Qiao and Wang2018; Xu et al. Reference Xu, Du, Huang, Song and Li2018; Yu et al. Reference Yu, Zhang, Xing, Zuo, Hou, Wang and Zhao2018). Mixed sediments are formed by mixing terrigenous clasts and intrabasinal carbonate. They can be deposited in various environments, such as lakes, transitional, shelf and slope facies. The mixing ratio of allogenic and authigenic components in mixed sediments is considered to be significantly influenced by climate and environment (Mount, Reference Mount1984; Brooks et al. Reference Brooks, Doyle, Suthard, Locker and Hine2003; Campbell, Reference Campbell2005; Garcia-Garcia et al. Reference Garcia-Garcia, Soria, Viseras and Fernandez2009; Chiarella et al. Reference Chiarella, Longhitano and Tropeano2017); thus, they can be used for reconstructing palaeoclimate changes after excluding the interference of tectonics, detrital sources and sedimentary cycles. In this study, we investigate the petrology and geochemistry of mixed sediments from the Qaidam Basin to reconstruct the palaeoclimate and palaeoenvironment during Middle Miocene time. The paper (1) identifies and explains the Middle Miocene climate transition in the Tibetan Plateau, and (2) discusses the driver of climatic change in Central Asia during this period.
2. Geologic setting
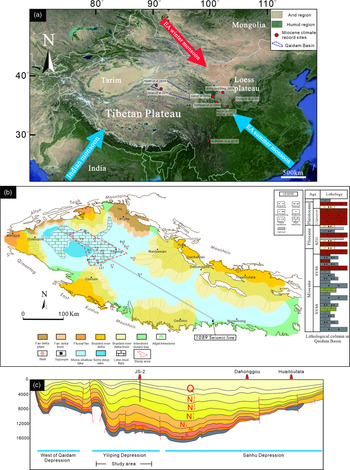
The Qaidam Basin, with an average elevation of 2000–3000 m, is the largest intermontane basin at the northern part of the Tibetan Plateau (Fig. 1a). It is surrounded by the Altyn-Tagh Fault, Qilian Mountain and Kunlun Mountain in the northwest, northeast and south, respectively (Tapponnier, Reference Tapponnier2001; Cowgill et al. Reference Cowgill, Yin, Arrowsmith, Feng and Shuanhong2004; Gold et al. Reference Gold, Cowgill, Arrowsmith, Chen, Sharp, Cooper and Wang2011). The Cenozoic stratigraphy of the Qaidam Basin is divided into seven formations, namely the Lulehe Formation (E1+2), Xiaganchaigou Formation (E3) and Shangganchaigou Formation (N1), deposited during the Palaeogene Period; and the Xiayoushashan Formation (XYSS Fm; N2 1), Shangyoushashan Formation (SYSS Fm; N2 2), Shizigou Formation (SZG Fm; N2 3) and Qigequan Formation (QGQ Fm; Q1+2), deposited during the Neogene and Quaternary periods (Yang, et al. Reference Yang, Ma, Xu and Ye1992; Sun et al. Reference Sun, Yang, Ge, Pei, Guo, Li, Ma and Xu2004; Lu & Xiong, Reference Lu and Xiong2009). During the Neogene Period, owing to the relatively arid palaeoclimate and the high salinity of the lake water, lacustrine fine-grained sedimentary rocks characterized as mixed sedimentary were widely distributed in the Qaidam Basin (Sha, Reference Sha2001; Xu et al. Reference Xu, Chen, Cao, Xue, Xiao and Wang2014; Xiong et al. Reference Xiong, Wu, Tan, Zhang, Bo, Ling, Ling, Yun, Qiao and Wang2018).
(a) Satellite map showing the arid and humid regions in Central Asia; the Tibetan Plateau is located in an arid region. (b) The sedimentary facies of the Qaidam Basin during the Miocene Epoch. (c) The 1089 seismic profile shows the west side of the Qaidam Basin Depression, the Yiliping Depression, the Sanhu Depression and the location of the JS2 drillcore. Note that the original data for (b) and (c) come from the Qinghai Oilfield Branch Company in China.

During the Miocene–Pliocene epochs, the depocentre of the Qaidam Basin migrated from west to east owing to the uplift of Kunlun Mountain; consequently, the Yiliping Depression became the long-term depocentre and accumulated very thick lacustrine strata (Guo et al. Reference Guo, Wang, Li, Zhang, Zhang and Kong2009; Fig. 1c). During this period, the SYSS and XYSS fms, composed of shore–shallow lacustrine sedimentary facies (including algal flats, lime-mud flats and beach bar subfacies), were deposited in the Yiliping Depression (Guo et al. Reference Guo, Wang, Li, Zhang, Zhang and Kong2009; Xu et al. Reference Xu, Du, Huang, Song and Li2018; Fig. 1b). The lithology of the SYSS and XYSS fms mainly consists of fine-grained sedimentary rocks, such as dark silty mudstone, argillaceous siltstone and marlstone, whereas the lithology of the SZG Fm mainly consists of light-coloured siltstone and argillaceous siltstone. In addition, the SZG Fm contains white halite and black gypsum interlayers, which are rarely found in the SYSS and XYSS fms (Fig. 1b).
3. Samples and methods
In this study, 148 samples of the XYSS and SYSS fms from seven wells (JS2, FX103, F8, F6, L1, H2, JS1) in the Yiliping Depression were used to determine the rock components, using the Rigaku D/max-2500X X-ray fluorescence spectrometer of the Analytical Centre at the Xi’an Centre of China Geological Survey.
Among these seven wells, the JS2 well is our primary object of study. This well penetrated ∼3000 m of Neogene–Quaternary strata, including the QGQ, SZG, SYSS and XYSS fms. In addition, a 400 m successive coring section of the JS2 drillcore was obtained. This coring section contains an 81 m thick segment of the SYSS Fm and a 319 m thick segment of the XYSS Fm. To determine the abundance of major and trace elements, 34 samples from JS2 with an average spacing were analysed using a Philips PW2404 X-ray fluorescence spectrometer and a Perkin-Elmer NexION-300D inductively coupled plasma mass spectrometer, respectively. These analyses were conducted at the Laboratory of Continental Dynamics at Northwest University. In addition, total organic carbon (TOC) concentrations from the JS2 samples were obtained using a Leco CS-200 carbon sulfur analyser at the Organic Geochemistry Laboratory of Exploration and Development Research Institute of PetroChina, Qinghai Oilfield Branch Company. Moreover, 2600 m long successive gamma-ray logging data from this well were used to analyse the long-term climatic change.
4. Results
4.a. Petrological features
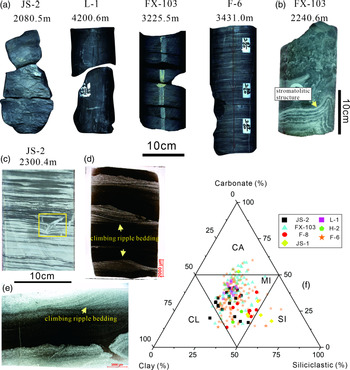
Fine-grained sedimentary rocks are dominant in the study area. Owing to their black, dark-grey and brownish-grey colours, they were easily recognized as dark mudstones (Fig. 2a). The X-ray diffraction results indicate that most of the 148 samples mainly contain siliciclastic, carbonate and clay components, with relative contents varying from 20.9 to 48.1 % (mean = 30.5 %), 17.1 to 45.0 % (mean = 34.4 %) and 18.4 to 48.4 % (mean = 35.1 %), respectively (Fig. 2f). According to the classification scheme of fine-grained sedimentary rocks from Jiang et al. (Reference Jiang, Liang and Wu2013) and Yan et al. (Reference Yan, Pu, Zhou, Chen and Han2015), these samples are classified as fine-grained mixed sediments. In addition, some interlayers of algal limestone, with thicknesses ranging from 20 to 100 cm, and stromatolitic structures can be observed (Fig. 2b).
(a) Macro-features of fine-grained mixed sediments from the JS2, FX103, F6 and L1 drillcores, similar to dark mudstones. (b) Macro-features of algal limestones in the FX103 drillcore, and the black filaments interbedded with white anhydrite lamina. (c) The stratified fine-grained mixed sediments from the JS2 well, and the slump deposit observed in microstratification (yellow box). (d, e) Large-scale thin-section showing the climbing ripple bedding composed of fine sand containing anhydrite in fine-grained mixed sediments. (f) Ternary plot illustrating carbonate, clay and siliciclastic contents of the Neogene fine-grained sedimentary rocks in the study area (based on Yan et al. Reference Yan, Pu, Zhou, Chen and Han2015 and Jiang et al. Reference Jiang, Liang and Wu2013). SI – siliciclastic sedimentary rocks; CA – carbonate rocks (dolomite and limestone); CL – clay rocks; MI – fine-grained mixed sediments.

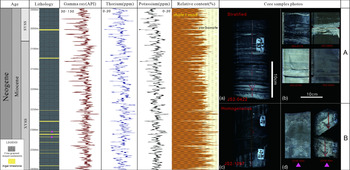
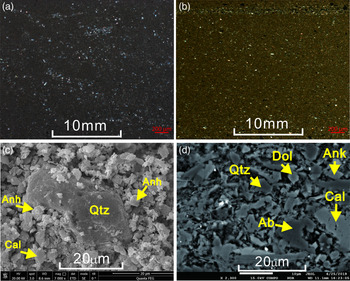
In the 400 m successive coring section of the JS2 drillcore, fine-grained mixed sediments dominate, with intermittent deposits of algal limestone interlayers (Fig. 3). According to the number of algal limestone interlayers, the whole coring section can be divided in two parts: A and B. The number of algal limestone interlayers in section B is clearly more than that in section A. Homogeneous structures and bedding structures can be observed in the fine-grained mixed sediments. The bedding structures include lenticular, veined, wavy bedding and climbing ripple bedding composed of fine sand containing anhydrite (Fig. 2c, d). In some samples from section A (JS2-0174, JS2-0505, JS2-0758 and JS2-0689) with a light colour, tiny lenticles or horizontal strips of gypsum can be observed (Fig. 3). In the algal limestones in section B, the colours are mainly greyish-white or yellowish-grey, and they have a stromatolitic structure composed of black filaments and white anhydrite laminations (Figs 2b, 3). Furthermore, observations made using a polarized light microscope, electron probe X-ray microanalysis and a scanning electron microscope indicate that these fine-grained mixed sediments are homogeneous mixing products of clay minerals, silt-sized felsic particles, micritic carbonate grains, tiny anhydrite particles and other substances (Fig. 4a–d).
Lithological column from the coring section of the JS2 drillcore in the Yiliping Depression showing fine-grained mixed sediments and algal limestone interlayers. Note that, according to the number of algal limestone interlayers, this section is divided in two, A and B. (a) Core photographs show the normal fine-grained mixed sediments from section A, which are similar in appearance to dark mudstones. (b) Core photographs illustrate the abnormal fine-grained mixed sediments from section A, which are clearly different in appearance from the normal fine-grained mixed sediments. (c) Core photographs show the normal fine-grained mixed sediments from section B, which have no obvious difference from that in section A. (d) Core photographs show algal limestones and their stromatolitic structure from section B.

Microscopic features of fine-grained mixed sediments in the Yiliping Depression. (a, b) Polarizing photomicrograph showing micrite, clay and silt mixed together in the fine-grained mixed sediments. It is difficult to directly estimate the relative contents of them. (c) Electron probe photomicrograph showing anhydrite (Anh), calcite (Cal) and quartz (Qtz) mixed together in a state of dispersive particles from the JS2 well. (d) Scanning electron photomicrograph showing quartz (Qtz), calcite (Cal), dolomite (Dol), ankerite (Ank) and albite (Ab) mixed together in the JS2 well, with particle size less than 30 μm.

4.b. Geochemical characteristics of the fine-grained mixed sediments
4.b.1. Major elements
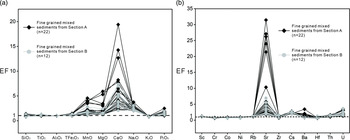
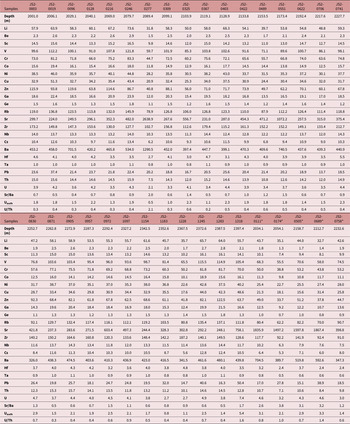
The major-element concentrations of the fine-grained mixed sediments from the coring section of the JS2 drillcore are listed in Table 1. The enrichment factor (EF) can be applied to estimate the degree of enrichment of elements in sediments, and it is defined as follows (Roussiez et al. Reference Roussiez, Ludwig, Probst and Monaco2005): EF = (X/Al)sample/(X/Al)NASC, where (X/Al)sample represents the ratio of the content of the element in question against the content of the element Al of the sample in question, and (X/Al)NASC represents the ratio of the content of the element against the content of Al in the North American Shale Composite (NASC; Gromet et al. Reference Gromet, Haskin, Korotev and Dymek1985). An EF value greater than 1 indicates that the elements are enriched, while a value less than 1 reflects that the elements are depleted compared to the NASC. In this study, the elements Ca, Mg, Na and Mn show obvious enrichment, and the element P shows slight enrichment. The elements Si, T, Al and K are comparable with those in the NASC, which have no obvious enrichment or depletion. The elements Ca and Mg are most enriched in the samples JS2-0174, JS2-0505, JS2-0689, JS2-0111 and JS2-0758 from section A (Table 1; Fig. 5a). Combining this with petrological observations, we find that all the samples are rich in carbonate and gypsum. Based on this, we define these samples (JS2-0174, JS2-0505, JS2-0689, JS2-0111, JS2-0758) as endogenous or carbonate-rich fine-grained mixed sediments, and the other samples can be regarded as exogenous fine-grained mixed sediments.
Vco, major-element abundances and some associated parameters of fine-grained mixed sediments from the coring section (unit in %)

*Samples JS2-0111, JS2-0174, JS2-0505, JS2-0689 and JS2-0758 are endogenous fine-grained mixed sediments.
Enrichment factors (EF) of (a) major elements and (b) some trace elements in fine-grained mixed sediments from the coring section of the JS2 drillcore.

4.b.2. Trace elements
Trace-element concentrations of the fine-grained mixed sediments from the coring section of the JS2 well are listed in Table 2. Ba (326.0–1290.5 ppm, mean = 505.0 ppm), Sr (224.0–2638.9 ppm, mean = 649.4 ppm), Zr (91.0–212.7 ppm, mean = 142.0 ppm) and Rb (62.2–145.9 ppm, mean = 110.6 ppm) are the most abundant elements. Some trace-element EFs for the fine-grained mixed sediments are shown in Figure 5b: Sc (EF = 1.12–1.26, mean = 1.18), Rb (EF = 1.07–1.27, mean = 1.18), Sr (EF =1.76–31.44, mean = 7.73), Cs (EF = 1.84–2.82, mean = 2.48), Ba (EF = 0.78–3.34, mean = 1.17), Th (EF = 1.03–1.64, mean = 1.42) and U (EF = 1.31–3.55, mean = 2.05) have an average EF higher than 1. Among them, Sr shows obvious enrichment, especially in the endogenous mixed sediments from section A.
Trace-element contents of fine-grained mixed sediments from the coring section (concentrations in ppm)

*Samples JS2-0111, JS2-0174, JS2-0505, JS2-0689 and JS2-0758 are endogenous fine-grained mixed sediments.
4.b.3. Rare earth elements
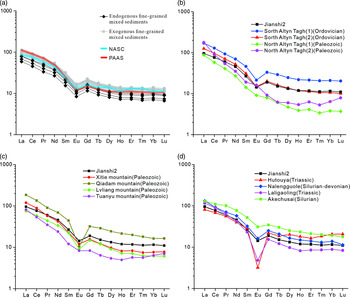
The results of the rare earth element (REE) analysis of the fine-grained mixed sediments are listed in Table 3. The values of total rare earth elements (ΣREEs) of the exogenous fine-grained mixed sediments vary from 124.7 to 176.9 ppm, with an average of 156.5 ppm; these values are lower than those for Post-Archaean Australian Shale (PAAS; 183.0 ppm; Taylor & McLennan, Reference Taylor and McLennan1985), but approximate to the NASC (167.4 ppm; Gromet et al. Reference Gromet, Haskin, Korotev and Dymek1985). The ΣREEs of the endogenous mixed sediments vary from 88.6 to 123.7 ppm, with an average of 107.9 ppm. The distribution pattern of REEs in the fine-grained mixed sediments is unified and shows a trend of from high to low from left to right, close to the NASC and PAAS (Fig. 8a).
TOC, REE contents and several associated parameters of fine-grained mixed sediments from the coring section (units in % and ppm)

*Samples JS2-0111, JS2-0174, JS2-0505, JS2-0689 and JS2-0758 are endogenous fine-grained mixed sediments.
4.b.4. Data validity analysis
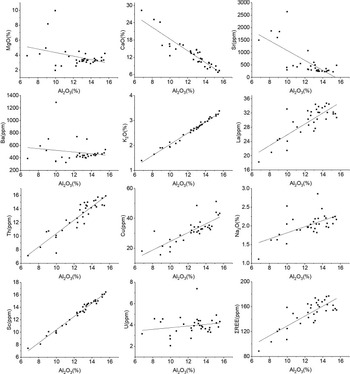
Geochemical data have been widely used to trace the provenance and reconstruct the palaeoclimate and palaeoenvironment (Shields & Stille, Reference Shields and Stille2001; Tribovillard et al. Reference Tribovillard, Algeo, Lyons and Riboulleau2006). However, a precondition of the reconstruction is that the elements must represent the synsedimentary characteristics of sediments and not be affected by late diagenesis or detrital input (Tribovillard et al. Reference Tribovillard, Algeo, Lyons and Riboulleau2006). As a portion of the components in the mixed sediments is of detrital provenance, validity analysis of their geochemical data is particularly important. Generally, if an element is not mainly of detrital provenance, it can be used for palaeoenvironmental analysis; by contrast, if an element is mainly detrital, it can be used for the analysis of provenance information (Tribovillard et al. Reference Tribovillard, Algeo, Lyons and Riboulleau2006). A reliable means to determine whether the content of a given element is controlled by detrital input is to cross-plot the trace and major elements versus Al, which is commonly of detrital origin and usually stable during diagenesis (Tribovillard et al. Reference Tribovillard, Desprairies, Lallier-Vergès, Moureau, Ramdani and Ramanampisoa1994; Böning et al. Reference Böning, Brumsack, Böttcher, Schnetger, Kriete, Kallmeyer and Borchers2004). The correlations of major, trace and REEs from 34 samples are shown in Figure 6. The contents of V, U, Co, Na2O, K2O, Th, Cu, Sc, La and ΣREEs are positively correlated with that of Al2O3, suggesting that these elements were mainly from terrestrial sources and can be used to reflect the provenance (Tribovillard et al. Reference Tribovillard, Algeo, Lyons and Riboulleau2006). In particular, a strong positive correlation between ΣREEs and Al2O3 indicates that the REEs in the fine-grained mixed sediments were not affected by post-depositional diagenesis (Shields & Stille, Reference Shields and Stille2001).
Correlation of major, trace and rare earth elements of 34 samples of fine-grained mixed sediments from the coring section of the JS2 drillcore.

As mentioned above, for carbonate components in mixed sediments, usually only the authigenic ones can be used to recover estimates of the palaeoclimate and palaeoenvironment. We suggest that the carbonate components in the mixed sediments studied here are mainly authigenic. This claim is supported by the following points. First, for carbonate grains in a lake basin, intraclasts are usually micritic carbonate grains and extraclasts are polycrystalline marble grains (Rieser et al. Reference Rieser, Neubauer, Liu and Ge2005); these observations were made using a scanning electron microscope and indicate that lacustrine carbonates from the fine-grained mixed sediments are almost all micritic grains in the Yiliping Depression (Fig. 4). Second, the mixed sediments of the Yiliping Depression (the contents of CaO and MgO, which represent calcite and dolomite, respectively) have a negative correlation with that of Al2O3, indicating that most carbonate in the fine-grained mixed sediments is authigenic; moreover, the contents of Sr and Ba are also negatively correlated with that of Al2O3, indicating that the elements Sr and Ba are related to the authigenic process and can be directly used to reconstruct the palaeoenvironment (Tribovillard et al. Reference Tribovillard, Algeo, Lyons and Riboulleau2006; Wang et al. Reference Wang, Wang, Liu, Xu and Li2021).
Third, numerous studies have suggested that the carbonate of the fine-grained mixed sediments deposited in the Cenozoic Qaidam Lake was authigenic (Xu et al. Reference Xu, Chen, Cao, Xue, Xiao and Wang2014, Reference Xu, Du, Huang, Song and Li2018; Xiong et al. Reference Xiong, Wu, Tan, Zhang, Bo, Ling, Ling, Yun, Qiao and Wang2018) and is characterized by micritic grains deposited in the fine-grained mixed sediments. Fourth, Cenozoic lacustrine carbonates were widely deposited in several basins of the Tibetan Plateau and were considered to be authigenic (e.g. Rowley & Currie, Reference Rowley and Currie2006; Zhuang et al. Reference Zhuang, Hourigan, Koch, Ritts and Kent-Corson2011; Hou et al. Reference Hou, Li, Song, Zhang, Hui, Chen and Xian2014). For example, in the Lunpola Basin, located in the central Tibetan Plateau, oxygen isotope data from authigenic lacustrine carbonates were used to estimate the palaeo-elevation of the plateau. Fifth, lacustrine carbonate was a typical and important component in saline lacustrine basins, such as the Jianghan Basin, Bohaiwan Basin and Qaidam Basin in China (Huang & Hinnov, Reference Huang and Hinnov2014, Reference Huang and Hinnov2019; Wu et al. Reference Wu, Jiang, Pan, Zhang and He2016; Xu et al. Reference Xu, Du, Huang, Song and Li2018).
5. Interpretations
5.a. Provenance
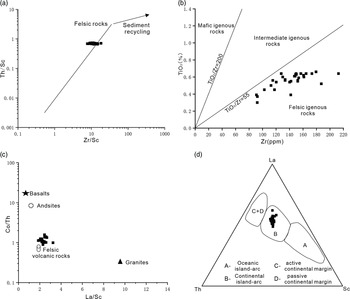
The linear relationship of Th/Sc and Zr/Sc indicates that the sedimentary recirculation of the fine-grained mixed sediments is weak, and only a small fraction comes from ancient sediments (Fig. 7a). In general, low TiO2/Zr ratios (<55) indicate that the source rock is felsic igneous rock; medium TiO2/Zr ratios (55–200) imply intermediate rock (Hayashi et al. Reference Hayashi, Fujisawa, Holland and Ohmoto1997); and high TiO2/Zr ratios (>200) reflect mafic rock (Moradi et al. Reference Moradi, Sari and Akkaya2016). TiO2/Zr ratios in the fine-grained mixed sediments range from 27.5 to 50.1, with an average of 39.6, indicating that the source rock is felsic igneous rock, consistent with the result for Co/Th versus La/Sc (Fig. 7b, c). Moreover, in the La–Th–Sc diagram, the data points fall within the continental island arc field, indicating that the tectonic attribution of provenance is a continental island arc source (Fig. 7d). The northern Tibetan Plateau was located in a multi-island arc environment at the edge of the Tethys Ocean as early as the early Palaeozoic period (Xu et al. Reference Xu, Yang, Li, Zhang, Zeng and Jiang2006), and the granite scattered around the Qaidam Basin is the potential source rock.
Provenance identification plots for the fine-grained mixed sediments. (a) Th/Sc versus Zr/Sc. (b) TiO2 versus Zr. (c) Co/Th versus La/Sc. (d) Ternary plot illustrating La, Th and Sc demonstrating the tectonic setting.

(a) Chondrite-normalized pattern of rare earth elements of fine-grained mixed sediments, NASC and PAAS. (b) REE distribution pattern of granite in the north Altyn-Tagh and south Altyn-Tagh (Yang et al. Reference Yang, Liu, Ding, Xiao, Cao and Kang2012; Wu et al. Reference Wu, Gao, Lei, Qin, Liu, Li, Frost and Wooden2014; Meng et al. Reference Meng, Chen, Wang, Sun, Wu, Zhang and He2016; Wu et al. Reference Wu, Chen, Chen, Wang, Meng, He, Wang and Han2017; Zheng et al. Reference Zheng, Wu, Wei, Gao, Guo, Chen, Wu and Gao2019). (c) REE distribution pattern of granite in the northern Qaidam Basin collected from Xitie Mountain, Qaidam Mountain, Lvliang Mountain and Tuanyu Mountain (Qin, Reference Qin2012). (d) REE distribution pattern of granite in the East Kunlun Mountains collected from Hutouya, Nalengguole, Laligaoling and Aakechusai (1:250 000 regional geological survey report from Bukadaban Peak, Qinghai Geological Survey Institute, 2004; Wang et al. Reference Wang, Chen, Luo, Chen, Wang and Guo2014; Hao et al. Reference Hao, Yuan, Zhang, Cao, Chen, Feng and Li2014; Li et al. Reference Li, Gao, Qian, He, Liu, Zhang, Zhang and Wang2015).

We collected the REE data for granite from Altyn-Tagh Mountain, the East Kunlun Mountains and the northern Qaidam Basin and compared their average distribution patterns with that of the fine-grained mixed sediments studied here. Although the REE distribution pattern of the fine-grained mixed sediments is most similar to that of Ordovician granite from the southern portion of Altyn-Tagh Mountain, it is completely different from that of the northern section (Fig. 8b). Moreover, the REE distribution pattern of the fine-grained mixed sediments is similar to that of Silurian granite in Qimantag Mountain, but is different from that of Triassic granite in this area and Palaeozoic granites in the northern Qaidam Basin (Fig. 8c, d). On the whole, the source rocks of the fine-grained mixed sediments are Palaeozoic granites, which are widespread in the southwestern basin. Although the ΣREEs of the endogenous fine-grained mixed sediments is clearly lower than that of the exogenous fine-grained mixed sediments, the distribution patterns are consistent, indicating that provenance does not change during their deposition.
5.b. Palaeosalinity, palaeoredox and sedimentation rate
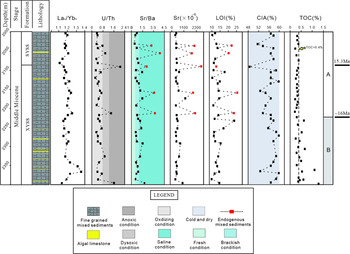
High authigenic Sr content in lacustrine sediments indicates an arid climate (Zhang et al. Reference Zhang, Fan, Zhang and Wang2004). A Sr/Ba ratio higher than 1 points to saline water conditions, and ranges from 0.5 to 1 point to brackish water conditions; those lower than 0.5 indicate fresh water conditions (Wang & Wu, Reference Wang and Wu1983; Zheng & Liu, Reference Zheng and Liu1999). In this study, the Sr/Ba ratios of the exogenous fine-grained mixed sediments reveal brackish water conditions, whereas the Sr/Ba ratios of the endogenous fine-grained mixed sediments in section A show high values, indicating saline water conditions (Table 2; Fig. 9).
Columns of indicators (U/Th, TOC, LaN/YbN, Sr/Ba, Sr, CIA, LOI) for fine-grained mixed sediments from the coring section.

Considering the complex composition of the fine-grained mixed sediments and that their ΣREE values approach those of the NASC, the element values from the NASC can be used to eliminate the interference of terrestrial sources via the following method (Reitz et al. Reference Reitz, Pfeifer, Lange and Klump2004; Tribovillard et al. Reference Tribovillard, Algeo, Lyons and Riboulleau2006): Xclastic =(X/Al)NASC × Alsample, and Xauthigenic = XTotal − Xclastic. Judging from the calculation results, the elements Co, V, Cr and Ni are nearly all from terrestrial sources, while the contents of authigenic Th and U are 0.24–5.40 ppm and 0.49–5.35 ppm, respectively. Therefore, in this study, the U/Th ratios and authigenic U (Uaut) are reliable for reconstructing the redox conditions. It has been widely accepted that U/Th ratios lower than 0.75 point to oxidizing conditions, those from 0.75 to 1.25 point to dysoxic conditions, and those higher than 1.25 indicate anoxic conditions. Meanwhile, Uaut values lower than 5 suggest oxidizing conditions, and those higher than 5 point to anoxic conditions (Hatch & Leventhal, Reference Hatch and Leventhal1992; Jones et al. Reference Jones, David and Manning1994). The U/Th ratios (0.23–2.05) and Uaut values (0.49–5.35) of the fine-grained mixed sediments in this study reveal oxidizing conditions (Fig. 9; Table 2).
The degree of REE fractionation, namely, LaN/YbN (the subscript N represents the NASC, normalized), is generally used to estimate the sedimentation rate in fine-grained sedimentary rocks. It is suggested that a weak REE fractionation results from a high sedimentation rate (LaN/YbN ratios ≈ 1; Tenger et al. Reference Tenger, Liu, Xu, Chen, Hu and Gao2006; Fu et al. Reference Fu, Wang, Chen, Feng, Wang, Song and Zeng2015). Thus, the high LaN/YbN ratios (1.10–1.36, mean = 1.20) of the fine-grained mixed sediments in the study area indicate a high sedimentation rate (Fig. 9; Table 3). The sedimentation rate demonstrates no obvious change from section A to B, also indicating a stable provenance.
5.c. Palaeoclimate as indicated by the geochemical index and petrology characteristics
The Yiliping Depression, as the depocentre of the Qaidam Basin in the Miocene period, accumulated successive lacustrine sediments, with few effects caused by geomorphological change, tectonics and provenance during Middle Miocene time, making it excellent for reconstructing palaeoclimate (Fig. 1) (based on provenance analysis and seismic data). The chemical index of alteration (CIA) and Sr/Cu ratio can be used to quantify an evaluation of climate in contrast to Mg/Ca, FeO/MnO and Al2O3/MgO (Sly, Reference Sly and Lerman1978; Nesbitt & Young, Reference Nesbitt and Young1982). However, Cu is mainly supplied by detrital input under oxidizing conditions (Tribovillard et al. Reference Tribovillard, Algeo, Lyons and Riboulleau2006), resulting in its unsuitability for reconstructing the climate. The aforementioned analysis indicated oxidizing conditions during the deposition of the mixed sediments, and the correlation analysis of the elements also showed characteristics of detrital input for Cu. Consequently, we only use authigenic Sr to reflect the climate changes here.
The CIA is defined as CIA = (Al2O3/(Al2O3 + CaO* + Na2O + K2O)) × 100, and all oxide contents are molar contents (Nesbitt & Young, Reference Nesbitt and Young1982). CaO* is the molar content of CaO in silicate minerals instead of in carbonate and phosphate (Young & Nesbitt, Reference Young and Nesbitt1999). The calculation method of CaO* content here is modelled after McLennan et al. (Reference McLennan, Hemming, McDanniel and Hanson1993). Generally, low CIA values (50–60) reveal cold and arid climatic conditions with weak chemical weathering; moderate CIA values (60–80) reflect warm and humid climatic conditions with medium chemical weathering; and high CIA values (80–100) reveal hot and humid tropical climatic conditions with intensive chemical weathering (Nesbitt & Young, Reference Nesbitt and Young1982; Fedo et al. Reference Fedo, Nesbitt and Young1995). The CIA values of the fine-grained mixed sediments range from 49 to 60 in this study (Table 1), indicating cold and arid climatic conditions with weak chemical weathering (Fig. 9).
A large quantity of authigenic anhydrite and dolomite was deposited in this saline lake, indicating non-humid climatic conditions. However, interbedding of light-coloured sandy lamina and dark fine-grained lamina can be observed in the fine-grained mixed sediments; they are similar to typical seasonal lamina found in the Newark supergroup core, which was interpreted as a winter/summer growth pattern under a semi-arid climate (Olsen et al. Reference Olsen, Watkins, Boei, Vermeulen, Natarajan and Kent1996). This pattern is also reflected by the interbedding of light and dark laminations in stromatolites (de Wet et al. Reference de Wet, de Wet, Linda, Driscoll, Patzkowsky, Xu, Gigliotti and Feitl2020), which are also observed in this study (Fig. 2b). In addition, the slump deposit in microstratification and a large number of climbing ripples observed in the mixed sediments also indicate a sedimentary environment controlled by a seasonal river (Shan et al. Reference Shan, Shi, Clift, Seddique, Liu, Tan, Liu, Hasan, Li and Song2020) (Fig. 2c, d). Indeed, the Asian monsoon system was preliminarily established in Early Miocene time (Liu & Ding, Reference Liu and Ding1998; Guo et al. Reference Guo, Ruddiman, Hao, Wu, Qiao, Zhu, Peng, Wei, Yuan and Liu2002; Sun & Wang, Reference Sun and Wang2005; Lin et al. Reference Lin, Wyrwoll, Chen and Cheng2015); subsequently, the retreats or expansions of the winter and summer monsoon mainly influenced precipitation in the Qaidam Basin (Miao et al. Reference Miao, Fang, Herrmann, Wu, Zhang and Liu2011). Therefore, we suggest the presence of a semi-arid climate in the Qaidam Basin during Middle Miocene time. Moreover, a strong seasonality dominated these climatic conditions, and the arid–humid fluctuation also contributed to the formation of fine-grained mixed sediments during this period.
The data also indicate a more arid tendency from sections B to A. There are higher values of the Sr/Ba ratio, Sr content and loss on ignition (LOI) in section A compared with section B; in particular, the endogenous fine-grained mixed sediments in section A have extremely high values (Fig. 9). As mentioned above, the higher values of the Sr/Ba ratio and Sr content indicate saline water conditions and a more arid climate (Wang & Wu, Reference Wang and Wu1983; Zheng & Liu, Reference Zheng and Liu1999; Zhang et al. Reference Zhang, Fan, Zhang and Wang2004). LOI refers to the percentage of the sample lost from the total mass under certain high-temperature conditions (∼1000 °C), which usually has a positive relationship with carbonate content and/or organic content in lacustrine sedimentary rocks (Bengtsson & Enell, Reference Bengtsson, Enell and Berglund1986; Heiri et al. Reference Heiri, Lotter and Lemcke2001). We note that the LOI values synergistically change with the Sr/Ba ratios and Sr values in the whole core section; specifically, the higher LOI values correspond with the lower TOC values in our study (Fig. 9). Thus, we conclude that the LOI values are mainly related to carbonate content here.
Together with the two conclusions drawn above, (1) the source of the fine-grained mixed sediments during Middle Miocene time is stable, both for the endogenous and exogenous fine-grained mixed sediments, and (2) the carbonate component in the mixed sediments studied here is mainly authigenic, we suggest that the higher LOI values do not affect the provenance, and they indicate a more arid climate. Furthermore, we interpret this phenomenon as indicating that relatively arid climatic conditions led to the weakening of terrigenous clastic physical transportation and the enhancement of chemical precipitation.
The variation in TOC values of the fine-grained mixed sediments also indicates this climate change as occurring over time. The TOC values are lower than 0.4 % for all the samples from section A; meanwhile, more than half of the samples from section B have TOC values greater than 0.5 %, and some even greater than 1.0 % (Fig. 9; Table 3). More algal limestone interlayers were deposited in section B than in section A, indicating the prosperity of algae under a relatively humid climate and their contribution to the higher TOC.
In conclusion, the semi-arid climate dominates the salinity, carbonate contents and organic matter contents of the lacustrine basin in the Qaidam Basin during Middle Miocene time. Moreover, the multiple indexes indicate that a drying trend moved from section B to section A. However, the sedimentation rate and palaeoredox did not move with this climate change.
5.d. Palaeoclimate indicated by gamma-ray logging
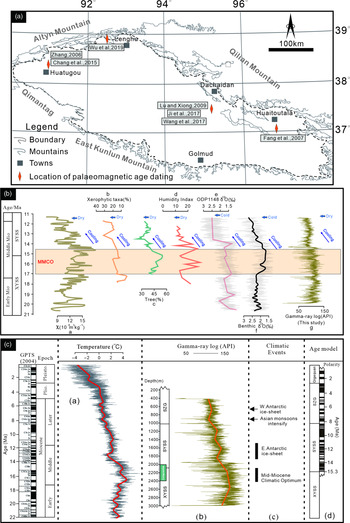
Generally, gamma-ray values are consistently high in shale layers and low in carbonate layers (Gong & Li, Reference Gong and Li2020). Noticeably, gamma-ray values represent the total effect of all radioactive elements (Th, K, U) in the stratum, and only Th and K contents usually have a linear relationship with shale contents (Chai et al. Reference Chai, Li and Liu2000; Wu et al. Reference Wu, Guo, Huang and Fu2011). In our study, the gamma-ray values synergistically change with Th and K contents, indicating that the gamma-ray curves can be directly used for lithological characterization. The fine-grained mixed sediments studied here are homogeneous mixing products without obvious grain-size cycles, and they contain ∼30 % (and even higher) authigenic carbonate; thus, their gamma-ray values better represent the mixing ratio of terrigenous clasts and intrabasinal carbonate. Consequently, the change in gamma-ray values is significant for reconstructing climatic evolution in saline lakes. The 2600 m long successive gamma-ray logging data from the whole JS2 drillhole show very good consistency with the δ18O values spanning the past 20 million years from the ocean drilling core (Fig. 10c), indicating the effect of global climatic change on the Neogene palaeoclimate in the Qaidam Basin. Several climate change events can also be identified from this dataset (Fig. 10c), such as the MMCO, East Antarctic ice-sheet expansion, Asian monsoons intensification and West Antarctic ice-sheet expansion. In particular, the coring section of the JS2 drillhole overlapped with the MMCO event.
(a) Palaeomagnetic age dating from some profiles in the basinal margin, which includes the boundary age of the SYSS/XYSS fms and the SYSS/SZG fms. (b) Comparison of regional and global climatic records during the Miocene Epoch, including the Middle Miocene Climatic Optimum and Middle Miocene Climate Cooling. a – magnetic susceptibility record of the HTG section in the Qaidam Basin (Guan et al. Reference Guan, Chang, Yan, Li, Xia, Zan and Liu2019); b – percentages of the pollen of xerophytic taxa from core KC-1 from the Qaidam Basin (Miao et al. Reference Miao, Fang, Herrmann, Wu, Zhang and Liu2011); c – tree pollen percentages from the Yanwan section in the Tianshui Basin (Hui et al. Reference Hui, Li, Xu, Song, Zhang, Wu and Zhao2011); d – humidity index from the pollen record of the Sikouzi section (Jiang & Ding, Reference Jiang and Ding2008); e – δ18O record of ODP Site 1148 (Tian et al. Reference Tian, Zhao, Wang, Li and Cheng2008); f – global marine δ18O record (Zachos et al. Reference Zachos, Pagani, Sloan, Thomas and Billups2001); g – the gamma-ray curves of the JS2 drillcore. (c) Age model of the JS2 drillcore. a – global temperature records (Westerhold et al. Reference Westerhold, Marwan, Drury, Liebrand, Agnini and Anagnostou2021); b – the JS2 drillcore gamma-ray log between 3000 and 400 m; c – climatic events during the Neogene Period (Zachos et al. Reference Zachos, Pagani, Sloan, Thomas and Billups2001); d – age model in the Huatoutala section (Fang et al. Reference Fang, Zhang, Meng, Gao, Wang, King, Song, Dai and Miao2007).

6. Discussion
6.a. Age model of the JS2 drillcore
An accurate chronology is crucial for discussing the palaeoclimate within the Tibetan Plateau. Abundant work from the oilfield has established a basin-wide lithostratigraphic framework for the Qaidam Basin. According to this framework, the coring section of the JS2 drillhole studied here covers the bottom of the SYSS Fm and the top of the XYSS Fm. Therefore, the boundary age of the SYSS and XYSS fms was relatively easy to obtain for this study. However, the boundary age of the SYSS and XYSS fms in the Qaidam Basin remains controversial.
Based on palaeomagnetic age dating from some profiles in the basinal margins, two main models for the boundary age of the SYSS and XYSS fms suggest ages of ∼13 Ma (Lu & Xiong, Reference Lu and Xiong2009; Chang et al. Reference Chang, Li, Qiang, Garzione, Pullen and An2015) and 15.3 Ma (Fang et al. Reference Fang, Zhang, Meng, Gao, Wang, King, Song, Dai and Miao2007; Wu et al. Reference Wu, Lin, Cowgill, Xiao, Cheng, Chen, Zhao, Shen and Yang2019; Fig. 10a). Notably, Wang et al. (Reference Wang, Zheng, Zhang, Li, Kirby, Yuan, Zheng, Liu, Wang, Zhang and Pang2017) and Nie et al. (Reference Nie, Ren, Saylor, Su, Horton, Bush, Chen and Pfaff2019) hold the view that the boundary age of the SYSS and XYSS fms is 9.0 Ma, as estimated by the Honggou fauna, and the onset of basin filling occurred at ∼25.5 Ma, challenging the previous interpretations. Therefore, we need to choose a boundary age for the SYSS and XYSS fms, as mentioned for this study.
We tend to prefer the estimate of 15.3 Ma after Fang et al. (Reference Fang, Zhang, Meng, Gao, Wang, King, Song, Dai and Miao2007) as the boundary age of the SYSS and XYSS fms here. This estimate is supported by the following facts. Many previous studies show that the climate changes of Central Asia were synchronous with global climate changes on a large scale during the Miocene Epoch. This is determined through a comparison of high-resolution proxy indexes, including pollen and magnetic susceptibility and oxygen isotopes from the Qaidam Basin, Tianshui Basin, Ningxia Basin, Linxia Basin, South China Sea and global sea (99-point moving average; e.g. Zachos et al. Reference Zachos, Pagani, Sloan, Thomas and Billups2001; Jiang & Ding, Reference Jiang and Ding2008; Tian et al. Reference Tian, Zhao, Wang, Li and Cheng2008; Hui et al. Reference Hui, Li, Xu, Song, Zhang, Wu and Zhao2011; Miao et al. Reference Miao, Fang, Herrmann, Wu, Zhang and Liu2011; Guan et al. Reference Guan, Chang, Yan, Li, Xia, Zan and Liu2019; Figs 1a, 10b). Indeed, our gamma-ray data also support this view very well (Fig. 10b). By comparing this gamma-ray curve with global temperature and other climatic proxies, the MMCO event (17–15 Ma) can be easily identified, and the boundary of the SYSS and XYSS fms falls within this span and near the top of this event. Thus, the boundary age of the SYSS/XYSS fms is suggested to be ∼15 Ma. Moreover, according to this method, the boundary age of the SYSS/SZG fms can be estimated as 8 Ma (Fig. 10c). In fact, the palaeomagnetic age of the boundary of the SYSS and SZG fms from different profiles in the Qaidam Basin is 8.1 Ma without obvious controversy (Zhang, Reference Zhang2006; Fang et al. Reference Fang, Zhang, Meng, Gao, Wang, King, Song, Dai and Miao2007; Ji et al. Reference Ji, Zhang, Clift, Zhuang, Song, Ke and Xu2017), further illustrating the reasonable approach of our age model (Fig. 10a).
According to this age model, the boundary age of sections A and B within the coring section is earlier than 15.3 Ma (Fig. 9). The above study shows that the sedimentary rate underwent no obvious change during the deposition of the coring section of the JS2 drillhole. Subsequently, given an assumption of a constant sedimentation rate, the boundary age of sections A and B is between 15.3 and 16 Ma. In any case, this boundary is within the MMCO event, meaning that there was a corresponding climatic change in the Qaidam Basin; this is reflected by the increase in carbonate-rich mixed sediments, decrease in algal limestone layers, decrease in lacustrine organic matter and the change in palaeosalinity in terms of basin filling.
6.b. Factors affecting climatic change during Middle Miocene time
Previous studies suggest that, during Middle Miocene time, there were warm and wet climatic conditions in monsoon-sensitive regions, such as the Yunnan Basin (Lebreton-Anberrée et al. Reference Lebreton-Anberrée, Li, Li, Spicer, Zhang, Su, Deng and Zhou2016), Loess Plateau (Dong et al. Reference Dong, Liu, An, Liu, Zhou, Qiang and Lu2018), Tianshui Basin (Hou et al. Reference Hou, Li, Song, Zhang, Hui, Chen and Xian2014) and Xining Basin (Zan et al. Reference Zan, Fang, Yan, Zhang and Lu2015), and that the climate began drying at ∼13 Ma. Taken together, these records indicate a relatively warm and humid climate during the MMCO period, and that the climate progressively deteriorated at 14–13 Ma in Central Asia, consistent with global climate changes. This climatic change in the Qaidam Basin can be illustrated by the successive gamma-ray logging data from the whole JS2 drillhole in this study; based on our age model, its onset time was ∼14 Ma, which is related to the East Antarctic ice-sheet expansion (Fig. 10) and consistent with other research (Zachos et al. Reference Zachos, Pagani, Sloan, Thomas and Billups2001; Westerhold et al. Reference Westerhold, Marwan, Drury, Liebrand, Agnini and Anagnostou2021). However, our geochemical data and analysis of petrology indicate that, during the MMCO period, the palaeoclimate in the Qaidam Basin was characterized as semi-arid; thus, we suggest that the palaeoclimate of the Qaidam Basin during the MMCO was dryer than once thought.
This suggestion is supported by other investigations; for example, the palynological analysis of the KC-1 core from the Qaidam Basin also shows that the climate became dryer throughout the Miocene Epoch (Miao et al. Reference Miao, Fang, Herrmann, Wu, Zhang and Liu2011, Reference Miao, Herrmann, Wu, Yan and Yang2012). The existence of a dryer climate in the Qaidam Basin than in other areas in Central Asia during the MMCO period, as interpreted here, might be caused by the change of topography resulting from the uplift of the northeastern Tibetan Plateau at that time. Furthermore, numerous studies indicate that the main part of the Tibetan Plateau could have reached ∼4 km or more as early as ∼23 Ma, and then mainly affected the northeastern part against the background of a high-altitude plateau (e.g. Rowley & Currie, Reference Rowley and Currie2006; DeCelles et al. Reference DeCelles, Quade, Kapp, Fan, Dettman and Ding2007; Rowley & Garzione, Reference Rowley and Garzione2007). The ‘barrier effect’ of the plateau may have altered the vapour transport pathways, preventing moisture from the south and southeast from moving into the Asian arid region and eventually creating the non-humid climate in the Qaidam Basin.
Notably, one climatic change that occurred earlier than 15 Ma identified in this study falls in the MMCO period. Indeed, this climatic fluctuation is seldom mentioned worldwide, and its cause is worthy of being discussed. The Paratethys that covered large areas of Central Asia during late Eocene–Oligocene times and influenced regional climate by immediately providing water vapour (Ramstein et al. Reference Ramstein, Fluteau and Besse1997) had retreated from the Asian inland during Middle Miocene time (∼15 Ma; Popova et al. Reference Popova, Rögl, Rozanov, Steininger, Shcherba and Kovac2004). The Early–Middle Miocene planktonic foraminifera at Miran River in the SE Tarim Basin, very close to the western Qaidam Basin, have not been observed in the post-Middle Miocene strata. Although attributing this planktonic foraminifer assemblage to either marine or terrestrial products remains open for discussion, the inference of a westward water retreat at that time seems reasonable (Ritts et al. Reference Ritts, Yue, Graham, Sobel, Abbink and Stockli2008). Moreover, this palaeogeographic change coincided with the synchronous tectonic reorganization of the Altyn-Tagh fault system and northeastern Tibetan Plateau (Wu et al. Reference Wu, Lin, Cowgill, Xiao, Cheng, Chen, Zhao, Shen and Yang2019). Therefore, this tectonic and related palaeogeographic event may have created a barrier to water vapour in the Qaidam Basin from the west and consequently produced a drier climate in the Qaidam Basin.
Ultimately, global climate changes, as the primary factor, controlled the overall characteristics and changes of the Neogene climate in the Qaidam Basin, including the occurrence of the MMCO and the cooling and drying tendency. Regional events were the secondary factor contributing to the dryer climate in the Qaidam Basin relative to other areas in Central Asia and the secondary climatic change during the MMCO period.
7. Conclusion
Fine-grained mixed sediments, as a sensitive indicator of palaeoclimate, were widely deposited in the Miocene Qaidam Lake. These rocks were formed by the mixing of siliciclastic, carbonate and clay components, and the relative content of each is less than 50 %. The long-term global cooling trend and typical abrupt events (such as the MMCO during 17–15 Ma) in the past 20 million years are well identified in the Qaidam Basin via petrological observation, geochemical data and 2600 m long successive gamma-ray logging data analysis of the fine-grained mixed sediments. The difference, however, is that the Middle Miocene Qaidam lacustrine basin developed in oxidizing, high-sedimentation rate and brackish-saline water conditions in a semi-arid climate, indicating a dryer climate in the Qaidam Basin than in the monsoon-sensitive regions of Central Asia during the MMCO period. Also identified in this study is one climatic change that occurred before 15 Ma; this is characterized by an increase in carbonate-rich mixed sediments, a decrease in algal limestone layers, a decrease in lacustrine organic matter and a change in palaeosalinity in terms of basin filling. This event falls in the MMCO period and is seldom mentioned worldwide; we interpret it as the potential result of regional tectonic events, such as the retreat of the Paratethys from Central Asia at ∼15 Ma and the synchronous tectonic reorganization of the Altyn-Tagh fault system and the northeastern Tibetan Plateau.
We suggest that global climate changes were the primary factor affecting the Neogene climate in the Qaidam Basin, influencing the overall climatic characteristics and cooling tendency; meanwhile, regional events were secondary, resulting in the dryer climate in the Qaidam Basin relative to other areas in Central Asia during the MMCO period, and the secondary climatic change during the MMCO period.
Acknowledgements
This study was funded by grants from the National Natural Science Foundation of China (#41602111). We thank the Exploratory Development Institute of Qinghai Oilfield Company for providing part of the data used in this analysis. We thank Professor Lin Xiubin and other anonymous reviewers for their valuable reviews of earlier versions of this manuscript.