Implications
The milk flow trait can be considered as functional, of great importance in dairy cattle, both related to udder health on the efficiency of labor. A increased milk flow is associated with a decrease in occupancy time of labor and thus a decrease in spending on it. In addition, a faster milking implies a reduction in electricity costs and maintenance of machines. Studies investigating milk flow are still limited and the best approach for analyzing this trait has not been well defined.
Introduction
Dairy cattle breeding programs have been based on the selection for traits related to milk production and composition and other traits such as conformation, udder health and longevity. However, in view of the advances in milking techniques and equipment and the ease of measurement of milk yield and milking time, important functional traits such as milk flow can be included in the selection scheme.
Milk flow is associated with milking efficiency and milkability and udder health, factors that effectively interfere with the susceptibility of animals to mastitis (Zwald et al., Reference Zwald, Weigel, Chang, Welper and Clay2005). In addition, this functional trait seems to be related to herd profitability because selection of animals that produce more milk within a shorter milking time may reduce electrical energy costs (Boettcher et al., Reference Boettcher, Dekkers and Kolstad1998) and increase the durability of milking equipment.
Studies investigating milk flow are still limited and the best approach for analyzing this trait has not been well defined. One of the factors contributing to this difficulty is the variety of methods used for the measurement of this trait, which range from the use of visual scores to electronic measurements. Estimates of genetic parameters for milk flow depend on the type of model and measurement used. Thus, heritability estimates reported in the literature vary widely, with values of 0.42 for flow measured during the first 2 min of milking, 0.19 for total milk flow and 0.15 for flow data obtained subjectively (Seykora and Mcdaniel, Reference Seykora and Mcdaniel1985; Boettcher et al., Reference Boettcher, Dekkers and Kolstad1998; Vicario et al., Reference Vicario, Degano and Carnier2006).
Some models used for the evaluation of milk yield might be candidates for the study of milk flow. In this respect, test-day models have been used in dairy cattle for the analysis of longitudinal data, such as test-day milk, fat or protein production and somatic cell count. These models consider the production or the somatic cell count obtained for each test-day as a distinct trait, which can be evaluated by single- or multiple-trait analysis.
Test-day models allow the quantification of environmental factors specific for each day that vary between animals and test days, such as the number of milkings, dry period length, pregnancy and disease (Ferreira et al., Reference Ferreira, Teixeira, Euclydes, Verneque, Lopes, Torres, Wenceslau, Silva and Magalhaes2003). In addition, these models allow the evaluation of an animal with only one test-day record or during ongoing lactation, thus accelerating the process of genetic evaluation because the information can be included in the database before the end of lactation (El Faro and Albuquerque, Reference El Faro and Albuquerque2003). However, test-day models use larger datasets and usually require estimates of more parameters than the lactation model (Hammami et al., Reference Hammami, Rekik, Soyeurt, Ben Gara and Gengler2008). The increasing number of countries that have participated in the international evaluations for production traits of Holstein bulls have used test-day models (Miglior et al., Reference Miglior, Gong, Wang, Kistemaker, Sewalem and Jamrozik2009). In developing countries, there is limited level of milk recording, and the use of test-day models would result in reduced cost of recording as we could have longer intervals between milk recording and less-frequent collection of milk samples. In this way, the amount of information that can accrue from incorporating the majority of smallholders who have small herd sizes would be large (Njubi et al., Reference Njubi, Wakhungu and Badamana2010).
The objective of this study was to estimate variance components and genetic parameters for test-day milk flow (TDMF) using different models to contribute to the inclusion of this trait in breeding programs.
Material and methods
Monthly milk flow data were obtained from 2175 first lactations of Holstein cows belonging to Agropecuária Agrindus S.A., Descalvado, São Paulo, Brazil. Calving occurred between 1997 and 2005 and the cows were daughters of 211 sires and 1562 dams. Test-day milk production and the respective milking times were recorded daily. Mechanical milking was performed three times per day using electronic equipment. Milk flow was calculated by dividing the milk yield (kg) of three milkings by the total milking time (min) and is reported as kg/min.
Lactations were truncated at 305 days and monthly TDMF records were obtained between 7 and 305 days after calving, for a total of ten monthly classes of milk flow (TDMF 1 to 10). Lactations containing fewer than three monthly tests were excluded from the analysis.
Single- and multiple-trait animal models considering each TDFM as a distinct trait and a repeatability model were used for the analysis of milk flow. The contemporary group for TDMF was defined as year and month of test, with the restriction that each group should contain a minimum of seven records. The models included the direct additive genetic effect as a random effect and contemporary group and age of cow at calving (linear and quadratic regression) as fixed effects. The effects of the age of a cow at calving and the number of days in milk were determined in a preliminary study using the least-square method. The effect of number of days in milk was only included in the repeatability model. The relationship matrix contained 9572 animals for all models.
The matrix form of the general model used for single- and multiple-trait analyses can be written as follows:

where y = vector of milk flow (kg/min) on each test day; b = vector of fixed effects including contemporary group and the covariate age of a cow at calving; a = vector of random additive genetic effects; X and Z = incidence matrices for fixed and additive genetic effects, respectively; and e = vector of residual effects.
The assumptions in terms of means and variances for single- and multiple-trait analyses were as follows:

where G0 = A ⊗ G is the additive genetic (co)variance matrix between the 10 traits and

A = the relationship matrix between animals;
⊗ = the Kronecker product between matrices;
 = the additive genetic variances;
 = the genetic covariance between traits i and j;
R = I ⊗ R0, the residual (co)variance matrix between the 10 traits and

I = the identity matrix;
 = residual variances; and
 = the residual covariance between traits i and j.
The assumptions for the repeatability model were V(a) = A σ 2a, V(c) = Iσ 2c and V(e) = Iσ 2e, where σ 2c is the variance of the permanent environmental effect of the animal.
The variance components were estimated by the restricted maximum likelihood method using the MTDFREML program (Boldman et al., Reference Boldman, Kriese, Van Vleck, Van Tessel and Kachman1995) for single-trait and repeatability analyses and the REMLF90 program (Misztal, Reference Misztal2001) for multiple-trait analysis. The convergence criterion adopted was 10−9.
The models were compared in terms of the estimates of genetic parameters and variance components. Spearman's correlation was used to compare the predicted breeding values obtained with each model.
Results and discussion
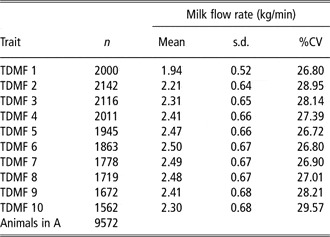
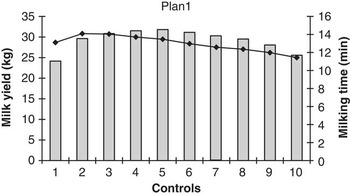
The maximum milk flow rate was observed in the sixth month of lactation (2.50 kg/min), followed by a decline until the end of lactation, whereas the lowest flow rate was observed in the first month of lactation (Table 1). The longest milking time in the second month of lactation did not coincide with the peak milk yield, which was observed between the fourth and the fifth month (Figure 1). Normally, it would be expected that longer milking occurred at the highest test-day milk yield. With respect to lactation physiology, according to Dukes (Reference Dukes1996), the velocity of milk ejection depends on the pressure accumulated inside the mammary gland. Thus, larger quantities of milk stored in the udder increase intramammary pressure, with a consequent increase in the rate of milk ejection.
Summary of the data structure, number of animals (n), mean, s.d. and CV% for (TDMF 1 to 10) and the number of animals in the relationship matrix

TDMF = test-day milk flow; A = relationship matrix.
Test-day milk yield (bars) and milking time (⧫).

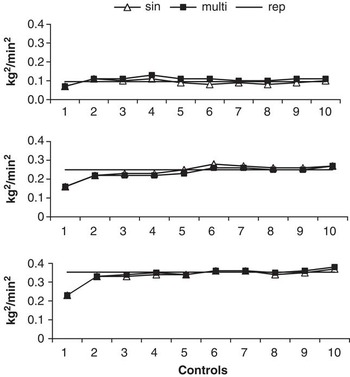
The same trend was observed for phenotypic variances estimated by single- and multiple-trait analyses (Figure 2). In general, these estimates increased up to the sixth month and remained practically constant until the end of lactation. The estimates obtained with these models practically did not differ from one another, with the repeatability model providing estimates close to the mean of the other models.
Additive genetic (top), residual (middle) and phenotypic variances (bottom) for milk flow obtained by single-trait (▴), multiple-trait (▪) and repeatability analyses (—).

Additive genetic variances estimated by single- and multiple-trait analyses increased until the fourth test month, followed by a decline from the fifth to the eighth month and a subsequent increase during the last two months of lactation (Figure 2). Despite showing the same trend, slightly higher estimates were found by multiple-trait analysis. Because the 10 traits are analyzed simultaneously, the (co)variance matrices are more informative compared with the other two models. The repeatability model provided additive genetic variances similar to the mean of the estimates obtained with the other models.
Residual variances increased gradually until the sixth test month when estimated by single- and multiple-trait analyses and remained almost constant until the end of lactation. Unexpectedly, the highest estimate was observed in the sixth month of lactation while it would be expected at the beginning and at the end of lactation. The two models provided similar residual variances. For the repeatability model, residual variance (0.25) was added to the permanent environmental variance (Figure 2) and assumed a value slightly higher than those obtained with the other model for the first half of lactation and a similar value during the remaining period.
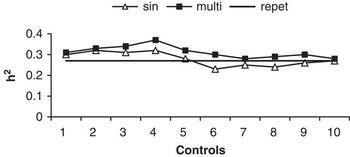
The heritability estimates (h 2) for monthly milk flow differed between models, with multiple-trait analysis providing higher estimates when compared with the other models (Figure 3). The single-trait model provided higher estimates for the first half of lactation, ranging from 0.23 (TDMF 6) to 0.32 (TDMF 2 and 4), with the highest values observed from the first (0.30) to the fourth month of lactation (0.32). The heritabilities estimated by multiple-trait analysis were higher than those obtained by single-trait analysis, ranging from 0.28 (TDMF 7 and 10) to 0.37 (TDMF 4). The highest heritabilities for milk flow were observed during the first half of lactation. There were no wide oscillations in the estimates after the sixth month of lactation as shown in Figure 3.
Estimates of heritability (h 2) for milk flow obtained by single-trait (▴), multiple-trait (▪) and repeatability analyses (—).

Several studies have discussed the difference in h 2 estimates between single- and multiple-trait analyses. In this respect, multiple-trait analysis has been shown to provide more accurate estimates of genetic parameters because this type of analysis uses the information of all traits to obtain the estimate of a specific trait (Meyer, Reference Meyer1991). Thus, multiple-trait analysis is expected to be less tendentious and its estimates should allow more accurate genetic evaluations.
In general, h 2 estimates varied over the course of lactation, with the first half of lactation being more heritable than the second half. The estimates were of a moderate magnitude, indicating that a considerable part of the variation in milk flow between animals is influenced by the additive genetic component. Thus, this trait may respond satisfactorily to selection, promoting rapid genetic gains. The estimates obtained in this study were higher than those reported by Bagnato et al. (Reference Bagnato, Rossoni, Maltecca, Vigo and Ghiroldi2003), who found an h 2 of 0.21 for milk flow measured monthly during lactation. These authors used data from 200 animals belonging to three different herds, which might have contributed to the lower estimates found. However, the range of h 2 observed in this study was close to the estimates reported in the literature, which range from 0.15 to 0.28 for data measured objectively (Seykora and Mcdaniel, Reference Seykora and Mcdaniel1985; Povinelli et al., Reference Povinelli, Romani, Degano, Cassandro, Dal Zotto and Bittante2003; Rensing & Ruten, Reference Rensing and Ruten2005; Zwald et al., Reference Zwald, Weigel, Chang, Welper and Clay2005; Vicario et al., Reference Vicario, Degano and Carnier2006).
The h 2 estimated using the repeatability model was 0.27, a value close to the lower limit of the estimates obtained by multiple-trait analysis. The repeatability model considers genetic variances to be constant through the lactation. Thus, the differences in the shape of the curve are considered partly in the residual effect and partly in the permanent environmental effect, explaining the lower heritabilities obtained with this model. The coefficient of repeatability was 0.66; this parameter indicates the existence of a high degree of association between the milk flow measures obtained during the different period of first lactation of a cow. The h 2 provided by the repeatability model was close to that reported by Rensing and Ruten (Reference Rensing and Ruten2005). However, repeatability was higher than that estimated by these authors (0.47). This difference might be explained by the fact that in this study the records analyzed were obtained from a single herd and each animal possessed up to 10 repeated measures. In contrast, the study of Rensing and Ruten (Reference Rensing and Ruten2005) included both animals with repeated measures of milk flow obtained during first lactation and animals with only one record when the data were obtained from progeny tests.
The genetic correlations between monthly milk flow rates obtained by multiple-trait analysis were positive and ranged from 0.72 (TDMF 1 and 10) to 0.97 (TDMF 4 and 5). Higher correlations were observed between adjacent test days, with a decrease in magnitude with increasing distance between test days. Only correlations between the initial test days and tests performed at the end of lactation (test days 9 and 10) were <0.80. These results suggest that a repeatability model, in which genetic correlations between test days are considered to be 1, is able to fit these data.
Milk flow data are still scarce in the literature, especially because of the difficulty in measuring this trait. However, comparison in terms of the trend in values between test days shows that the genetic correlations estimated using the multiple-trait model are similar to those reported in studies on test-day milk yield (El Faro and Albuquerque, Reference El Faro and Albuquerque2003; Ferreira et al., Reference Ferreira, Teixeira, Euclydes, Verneque, Lopes, Torres, Wenceslau, Silva and Magalhaes2003; Melo et al., Reference Melo, Packer, Costa and Machado2005; Bignardi et al., Reference Bignardi, El Faro, Albuquerque, Cardoso and Machado2008).
The phenotypic correlations estimated by multiple-trait analysis were positive and ranged from 0.45 (TDMF 1 and 10) to 0.84 (TDMF 2 and 3), with most estimates being <0.80. The trend in these results was similar to that observed for the genetic correlations.
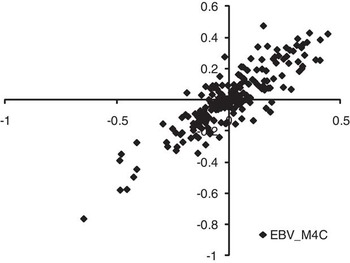
Another criterion that might help choose the best model is the rank correlation (Spearman) between predicted sire breeding values for milk flow measured on the fourth test day obtained by multiple-trait analysis and breeding values predicted using the repeatability model. This correlation was 0.82, that is, different from 1.0. This estimate suggests that changes may occur in the classification of animals and, consequently, in the selection of the best animals. For example, if selecting 2% (n = 4), 5% (n = 10) and 10% (n = 20) of the best sires based on breeding values estimated using the multiple-trait model for the fourth test day, only 50%, 50% and 60% of the sires, respectively, would also be selected based on breeding values predicted using the repeatability model.
Considering all sires, the average accuracy of the breeding values was higher for the multiple-trait model (0.68) compared with the repeatability model (0.59). This difference in accuracy might be explained by the difference in heritability estimates obtained with these two models, which were higher when the multiple-trait model was used. The comparison of both the repeatability model- and the multiple-trait model (fourth test day)-predicted breeding values of sires (Figure 4) shows a linear and positive relationship between them, as presented earlier.
Dispersal of breeding values predicted using the repeatability model (EBV_rep) and multi-trait model for test-day 4 (EBV_M4c).

In general, in terms of selection criteria, the high genetic correlations between monthly milk flow rates indicate that direct selection for one test day may result in genetic gains for the other test days. If selection is applied in the fourth test month for which a high heritability was observed, higher genetic gains will be expected, especially until the eighth month of lactation because of the higher genetic correlations. One of the main advantages of selection based on partial test days is that evaluations of sires can be performed earlier, thus reducing the generation interval.
For traits that are not easily measurable, as in the case of milk flow, the adoption of a single measurement during lactation contributes to the inclusion of these traits in selection programs. In this case, these measures should preferentially be taken between the third and the fifth test day. The fourth test day generally corresponds to the period following peak lactation and should therefore be less influenced by environmental effects, especially those related to the negative energy balance.
The present results indicate that either the repeatability model or the multiple-trait model can be used for the evaluation of milk flow and that selection for this trait should promote rapid genetic gains. However, the adoption of milk flow in breeding programs is still difficult in practice because few farms possess electronic equipment coupled to the milking rooms to measure this trait. On the other hand, a single measurement during lactation can be obtained manually during official dairy control, thus allowing the evaluation of this trait. Taken together, the results of this study may guide the decision of how to incorporate milk flow in breeding programs, suggesting that milk flow obtained around the fourth test day should be adopted.
Conclusion
The present results indicate that milk flow should respond satisfactorily to selection, promoting rapid genetic gains because the estimated heritabilities were moderate to high. Selection of animals based on the first test months rather than on later periods of lactation is more effective because the former are more heritable. The highest genetic gains are obtained if selection is mainly performed in the fourth test month. Both the repeatability model and the multipletrait model can be used for the genetic evaluation of animals for milk flow, but the latter provides more accurate estimates of breeding values.
Acknowledgements
This study was supported by the Coordination for the Improvement of Higher Education Personnel (CAPES).