1. Two Ideas about Phenomena
As Jim Woodward and I use the term, some of the things, facts, events, effects, causal processes, regularities, and so on, to be found in natural and laboratory settings are phenomena, and others are not. What we call phenomena are detected, and questions about them are answered by analyzing, interpreting, and drawing conclusions from data. Some data indicate the existence of phenomena and the features they possess; other data do not. Ignoring artificially produced effects, we claim that neither the existence nor the characteristic features of a phenomenon depend on the interests, practices, or theoretical commitments of investigators who study it.
James McAllister disagrees: “Any data set—whether it takes the form of a pen trace, sequence of numbers, or array of dots—can be regarded as the sum of two components: a relatively simple and regular pattern and a certain level of noise. This is a consequence of the fact that any mathematical function, however irregular, can be expressed as the sum of a relatively simple and regular function, such as a harmonic function, and another term that accounts for the difference” (McAllister Reference McAllister1997, 219). As I understand it, McAllister talks of “patterns” instead of signals to avoid the suggestion that noise is “a margin of … factual inaccuracy in data” (220). In keeping with the last line of the quote, he thinks noise is nothing other than “the purely mathematical discrepancy between a given pattern and a data set” (219). Since McAllister wants his account to apply to data of all kinds, I suppose he assumes that nonnumerical data like pen traces can be replaced by mathematical expressions without changing their evidential role. McAllister's leading idea is that every one of the infinitely many “pattern-noise” pairs into which a data set can be decomposed constitutes equally strong evidence for the existence of a corresponding structure necessary for the production of the data set (McAllister Reference McAllister2008). “Structures” are factors in the actual world that stand in a causal relation to data sets that enable us to infer the existence of a different “structure” from every different pattern-noise decomposition. What McAllister means by phenomena are structures that interest investigators and that correspond to patterns investigators can extract without accepting noise levels that are methodologically unacceptable to them. Since investigators have different interests and noise-level tolerances, one person's phenomenon need not be another's. McAllister concludes that “which patterns [in data] count as those corresponding to phenomena is entirely a matter of stipulation” (Reference McAllister1997, 224). Accordingly, phenomenon is a relative concept whose application depends upon investigators interests and noise tolerances rather than on any ontological difference between things, processes, regularities, and so on, in the world (McAllister Reference McAllister1997).
For Woodward and me, phenomenon is not a relative notion, and investigators’ interests and mathematical treatments of data sets are neither necessary nor sufficient to decide what are and what are not phenomena. What we call phenomena include stable regularities produced and sustained by a relatively small number of causal factors that are present and that interact in pretty much the same way within a range of different background conditions at different places and times.Footnote 1 We also include entities, effects, and events that meet similar conditions, as well as processes that develop and mechanisms that operate more or less uniformly in a variety of different situations at different times and places. Investigators’ interests influence the conduct of their investigations, the things they attend to, and the conclusions they draw about phenomena. Astronomers would not have discovered regularities among the movements of planets and moons, or the factors that sustain them, if they had not been interested enough to investigate them. But their interests and the methods they used to collect and analyze data play no role in determining whether the heavenly bodies actually move in regular ways under the influence of a small number of widespread, uniformly behaving causal factors. If interest-driven, mathematically permissible data analysis sufficed to establish the existence of phenomena, there would be no ontological or epistemic difference between objects of astrological and astronomical expertise (Bogen and Woodward Reference Bogen and Woodward1988, 315–26).
Woodward and I claim that the truth conduciveness of inferences from data to phenomena depends upon whether, and what kinds of, causal connections obtain between a phenomenon (if there is one) and features of the data. This makes it epistemically imprudent, if not irresponsible, to accept a claim about a phenomenon without good reason to think that the features of the data that argue for its existence are not merely the effects of extraneous causes. More generally, since the relevance of data to phenomena depends upon causal connections, causal considerations are essential to the acceptability of inferences from data to claims about phenomena. Evaluations of such inferences do not depend upon a comprehensive and detailed account of all the causal factors that conspire to produce the data. It does require answers to some causal questions about data production. Different factors need to be considered in different cases (Bogen and Woodward Reference Bogen and Woodward1988, 326–42). The pattern-noise decomposition McAllister emphasizes may be used to address causal concerns in some cases, but it is only one among many tools that may be used for this purpose. Sometimes it plays only a minor role. Sometimes it is epistemically irrelevant.Footnote 2 Even where pattern-noise decomposition plays a significant part, it is important not to confuse it with the causal analysis it is typically employed to serve.
On McAllister's view, instead of looking for answers to questions about how the data were caused, all you have to do is analyze the data set into the pattern-noise pair of your choice and infer the existence of a structure that corresponds to the pattern. It makes no difference how irregular the causal influence of the structure in the production of the data may be or what contribution it makes to the pattern. Nor does it matter if the components of the structure co-occurred and acted together only by coincidence. By contrast, Woodward and I claim that at least some causal questions about the production of the data set must be answered in order to draw and evaluate conclusions about phenomena.
After sketching some different ideas of noise, I will discuss an example of the interpretation of a maximally noisy data set undertaken by György Buzsáki. Ignoring its intrinsic scientific interest, the example of Buzsáki illustrates that investigators can use data to detect phenomena without trying to extract a signal from a noisy background. The example also illustrates the importance of causal analysis to data interpretation and suggests that it is not always a good idea to think of noise in terms of the kind of mathematical decomposition McAllister describes.
2. Noise Is Said in Many Ways
What I will call “interference noise” is exemplified by crackles and buzzes obscuring shortwave newscasts and the cacophony that frustrates one's attempt to follow a conversation in a noisy bar. Noise in this sense is identified and characterized as it contrasts with the signal (e.g., the newscast or the conversation) it obscures. Shannon-Weaver information theory treats noise as interference. It concerns itself with noise as a limiting influence on how much a signal can reduce uncertainty about which of a number of alternative messages is being transmitted. But sometimes the term “noise” is applied without regard to signals. One may attend to or investigate experienced features (like volumes, pitches, or timbres) or physical features of sound waves in the racket produced by street traffic in concert with jet planes and helicopters overhead, jackhammers, boom boxes, police, ambulance and fire-engine sirens, and people yelling on a summer afternoon in Los Angeles. I will use the term “din” to refer to disorganized sounds like that, considered without regard to whether or how much they obscure a signal. Some sounds can be considered both as din and as interference noise. John Cage wanted people who listened to his radio pieces to savor the sound of static without trying to pick up a broadcast. But a mathematical information theorist might ignore Cage's wishes and treat the static as interference. To recapitulate: noise is interference only relative to a signal, and din is noise considered independently of signals (if any) it might happen to obscure.
What McAllister means by noise resembles interference by virtue of being what is left once an investigator has extracted a pattern of interest from a data set, but he does not think of it as obscuring or interfering with the reception of the signal that a uniquely correct analysis of the data should uncover. His characterization of noise as the mathematical difference between pattern and data invokes a feature that is essential to some familiar notions of error. Statisticians characterize errors as random discrepancies between one or more points in a data set and either the statistical mean or the best curve to which the data can be fitted. For example, error terms are introduced into linear equations to eliminate discrepancies between predicted and empirically determined values of their variables. If the error terms are unacceptably large, investigators may modify the equations, for example, by changing coefficients or introducing new variables, to reduce the discrepancies. This and the notion of errors as random departures from a mean or curve come as close to anything I know to what McAllister means by noise.
But ideas originally developed to analyze sound are sometimes employed to interpret data by treating noisy data on analogy to sonic din. I turn now to an example of this featuring the treatment of noise in electroencephalogram (EEG) and electrocorticogram (ECoG) tracings.
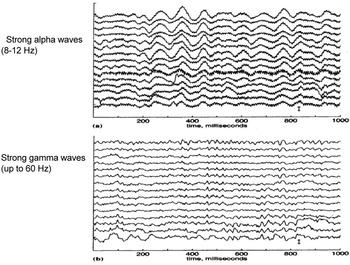
These tracings record voltage fluctuations registered by sensors placed on the scalp (EEG) or the upper surface of the brain (ECoG). Figure 1 reproduces two sets of ECoG tracings recorded from 15 adjacent electrodes over a period of 1,000 milliseconds. The tracings on figure 1a record electrical activity in a human subject sleeping under anesthesia. The other tracings come from an awake human.Footnote 3 These tracings are every bit as noisy as they look. Their noise can be treated as interference obscuring a weak signal to be extracted from the tracings. But contrary to McAllister, it can be illuminating to treat it as din without reference to a signal or pattern one might obtain by subtracting it from the data. So considered, EEG and ECoG noise exhibits two features of particular interest.
Fifteen adjacent electrocorticogram traces of a patient anesthetized (a) and awake (b).

First, the data are disorganized in the sense that none of the sequences of peaks and troughs recorded during any given temporal segment that is long enough to contain two or more oscillations recurs in any other segment of equal length. This sort of disorganization is definitive of random noise.
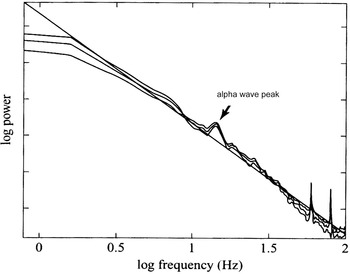
The second feature can be appreciated by considering a Fourier analysis that represents the noisy electrical activity recorded during a finite stretch of time as the sum of sine waves of different frequencies and amplitudes. These Fourier components can be compared to one another with respect to their power, energy, or amplitude. Figure 2 shows how the logs of Fourier component wave frequencies vary with logs of their powers in a nonseizing epileptic patient under anesthetic in a non-REM stage of sleep in a tracing of electrical activity traced during a little over a minute. (Bear in mind that fig. 2 exhibits the way the powers of the Fourier components vary with frequencies rather than temporal relations between oscillations in electrical activity or Fourier components; the higher, less powerful frequencies plotted on the right do not occur after the lower, more powerful frequencies on the left.) The diagonal running from the top left to the lower right-hand corner is an ideal curve. All the data points would fall on the diagonal if log power declined at a uniform rate of 1/log frequency. The midmost of the three lines that begin below the origin of the diagonal represents the average of records taken from several electrodes. The two lines that surround it indicate the range into which averaged actual values can be expected to fall. The abrupt power increases near 100 hertz were thought to be artifacts produced by electrical surges in the operating room where the recordings were made that are random relative to electrical activity in the brain (Freeman et al. Reference Freeman, Rogers, Holmes and Silbergeld2000, 113–14).Footnote 4 Alpha waves between 8–12 hertz predominate during early stages of non-REM sleep. Because the subject is sleeping, it is plausible that the 11-hertz power jump to the right of log frequency 1 is not an artifact (Buzsáki Reference Györgi2006, 120, 187–99).
Source: Buzsáki 2006, 120.

Color terms are used to refer to noises with different log power/log frequency ratios. The white-noise log power/log frequency curve is flat: all frequencies have roughly the same power. The EEG and ECoG noise approximates to pink noise whose power logs are the reciprocals of frequency logs. Buzsáki entertains the hypothesis that pink noise is typical of electrical activity in the normal brain except for departures from the 1/log frequency curve—like the alpha wave peak in a non-REM sleeper shown in figure 2—associated with specific mental or behavioral states (Buzsáki Reference Györgi2006, 121ff.).Footnote 5
Both disorder and log power/log frequency proportionality can be investigated by treating ECoG and EEG noise as din rather than as interference. As will be seen, Buzsáki interpreted his data by trying to figure out why the data are so noisy and why the noise is pink, for example, rather than white, instead of by trying to extract a signal. Buzsáki was well aware of methods he could have used to extract a pattern or signal from his data (he gives examples at Buzsáki [Reference Györgi2006], 106, 114, 119ff., 129). It is clear that he interpreted his data as he did out of choice rather than necessity. To decompose his data and discard the noise would be to throw out what Buzsáki needed to detect the log power/log frequency ratio that he came to think of as “a potential link between brain dynamics and behavior” (Buzsáki Reference Györgi2006, 132).
Someone who attended the symposium this essay came from objected that in identifying the log power/log frequency ratio Buzsáki was extracting a signal from noisy data. Identifying pink noise as a feature of brain activity involved a fair amount of mathematical manipulation, for example, averaging data from different electrodes, Fourier analysis, curve fitting, and calculating a confidence interval. But not every mathematical procedure can be informatively assimilated to subtracting a signal or a pattern from a mathematically represented data set. Buzsáki did not subtract data points on or near the pink-noise curve from mathematical representations of the EEG and ECoG data and treat the remainder as a signal. Instead, he asked what sort of din was characteristic of the data and plotted powers against frequencies in its Fourier decomposition to show that it approximates to pink noise.
3. Drawing Conclusions from Noise in the Brain
Buzsáki concluded that the brain's generation of something close to pink noise is indicative of something important about the way it operates in perception, cognition, and behavior. He rejected the alternative possibility that “brain tissue acts as a capacitive filter so that the faster waves are attenuated more than are slow waves” (Buzsáki Reference Györgi2006, 122). In that case, the noisiness of EEG and ECoG data would be an artifact reflecting the causal influence of tissues, electrical fields, and currents that an electrical impulse encounters as it travels through the brain on its way to the recording electrodes. Buzsáki rejects this on the grounds that fast waves should not attenuate in the same proportion to slow waves, regardless of where they originate or how far they must travel to reach the recording electrodes, and that the alternative view cannot explain why power declines for higher frequencies at the same rate as for lower ones, why the slopes of the relevant curves vary somewhat under different conditions (e.g., sleeping vs. waking), why power declines at close to an invariant rate from subject to subject, or why the noise should approximate to pink rather than white noise (Buzsáki Reference Györgi2006, 121 n. 20). A third possibility is that the noise is a sign of poor engineering and inefficiency. According to this view, pink noise emerges from extraneous and counterproductive electrical activity that clutters up neuronal signaling. But if pink noise is just an “inconvenient bi-product that the brain must ‘somehow overcome’ in order to execute its functions one would have to marvel at … the brain's extraordinary ability to compete with its self generated noise” (122). Buzsáki thinks that the brain is too well designed to expend so much of its energy on the production of functionally worthless noise and therefore that pink noise “must have important advantages and perceptual, behavioral consequences” (122). Its power distribution is a “telltale sign of self-organization. The speed at which the power decreases from low to high frequencies measures the length of the correlations or, using another phrase, the ‘temporal memory effects’ of the signal. This time memory effect is the main reason why the … relationship is so intriguing” (121).
Assuming that power is a function of how many cells are firing together (Buzsáki Reference Györgi2006, 115–16), the rate at which power declines with frequency indicates the rate at which the number of cells firing together declines with the frequency at which they spike. For the case of pink noise that means the size of populations whose cells fire synchronously varies inversely with their firing frequency. With this in mind consider a large population whose cells spike together slowly for some time t and a small population whose cells fire at a higher frequency from time to time during that same interval. Spikes from the larger and the smaller populations may come in and out of temporary synchronization.Footnote 6 This is functionally significant because throughout most of the cerebral cortex, each neuron receives inputs from so many others that most neurons cannot act alone to exert a nonnegligible influence on any others. Suppose a third population receives inputs from the other two. Appropriately coordinated signals from the larger and the smaller populations may sum to produce or inhibit spiking in the third (target) population even though firings in the smaller population are not numerous or well-enough coordinated to do so on their own. This allows slow waves of electrical activity to spread to and augment the activity of the small population during t, enabling it to promote or inhibit spiking in the target population later on. And so, for example, “an alpha wave at this instant in your occipital cortex can influence the amplitude of another alpha wave a thousand cycles later and all waves in between” (Buzsáki Reference Györgi2006, 121; alpha waves are low frequency, 8–12 hertz).
If frequency and power were related to one another after the manner of white noise, brain activity would be too disorganized to support cognitive, perceptual, or behavioral functioning. If the activities of different cortical regions were locked in synchrony for any considerable time, we would have a continuing epileptic seizure. If the time step development of electrical activity were analogous to the path of a random walk (producing what is called brown noise), the brain's responses to external or interval inputs over short periods of time would be less flexible than they actually are. Buzsáki concludes that “the brain not only gives rise to large scale, long term patterns [of electrical activity] but these self organized collective patterns also govern the behavior of its constituent neurons. In other words, the firing patterns of single cells depend not only on their instantaneous external inputs but also on the history of their firing patterns and the state of the network into which they are embedded.” Thus, complex systems whose power distributions approximate to pink noise “can be perturbed in predictable ways by various inputs. This susceptibility should apply to the brain as well” (Buzsaki Reference Györgi2006, 122–23).
In the grand scheme of things this idea belongs to an antibehaviorist, antireflexivist picture of the way the brain functions. Ignoring details great and small, behaviorist and reflexivist psychologists think that instead of acting on its own initiative, the brain usually or always acts only in response to internal or external environmental inputs. These outputs also help shape the responses they elicit. So conceived, most cortical activity is just one conditioned or unconditioned response after another. The opposing picture holds that much of the operation of the brain goes into the maintenance of “information” (in the ordinary, nontechnical sense of that term) for use in shaping responses to environmental demands. In 1890, William James wrote that “the general law of perception is … [that] whilst part of what we perceive comes through our senses from the object before us, another part (and it may be the larger part) always comes … out of our own head. … This is … the simplest case … of the general fact that our nerve centers are an organ for reacting on sense impressions, and our hemispheres, in particular, are given us in order that records of our private past experience may co-operate in the reaction” (Reference James1890/1950, 2:103).
James tells an associationist story about the acquisition, storage, and activation of the records (Reference James1890/1950, 2:104). Buzsáki's discussion of time memory suggests a mechanism through which neuronal activity in one or more brain regions at one or more times can “co-operate in the reaction” to subsequent inputs from the internal or external environment.Footnote 7
4. Phenomena versus Artifacts
The example I have just sketched illustrates a striking difference between Buzsáki's practice and McAllister's ideas about data analysis. McAllister thinks that decomposing data into pattern or signal and noise is necessary for establishing the existence of a phenomenon (and sufficient as well, given the relevant interests and attitudes toward noise magnitudes). The pattern-noise decomposition McAllister describes is neither necessary nor useful for Buzsáki's treatment of EEG and ECoG data.
A second difference becomes apparent if we consider what one would have to do to evaluate Buzsáki's claim that departures from the pink-noise curve for frequencies near 100 hertz are artifacts, while approximations to pink noise at other frequencies indicate the existence of a phenomenon of fundamental importance to brain functions that support cognition and behavior.Footnote 8 Recall that according McAllister, (a) each and every pattern-noise decomposition is sufficient to establish the existence of what he calls a “structure,” and (b) every structure qualifies as a phenomenon for anyone who finds the structure interesting. If a structure consists of the causal factors that give rise to data from which patterns are extracted, a is equivalent to the claim that every data set has causes. It is hard to disagree with that, but I am indebted to Paul Teller for observing that each point in a data set has its own causes, and McAllister does not require these causes to have anything of interest to do with one another. Claim b raises questions that do not arise with regard to Woodward's and my data/phenomena. Suppose Buzsáki is right to think that the abrupt power jumps at frequencies near 100 hertz (fig. 2) are artifacts. The systematically connected features of brain function that Buzsáki infers from the pink-noise curve are McAllisterian structures on a par with coincidentally connected causal factors belonging to the brain, the irregularly surging equipment in the operating room, and idiosyncratic features of the ECoG equipment and the experimentalists’ use of it. I think that if the frequency/power ratio Buzsáki detected indicates a feature of brain function as robust, stable, and fundamental to cognition and behavior as he thought, it is remarkably different from the accidentally assembled structure responsible for the 100-hertz power jump. If McAllister is right, which of these structures is a phenomenon depends upon and is relative to investigators’ interests. More generally, nothing except investigators’ interests and error tolerances prevent short-lived unique or infrequent interactions among coincidentally associated causal factors from qualifying as phenomena along with factors as influential, widespread, and uniform as Coulomb and gravitational attractions. McAllisterian patterns can be extracted from data by virtue of features due to ineptness, ignorance, bad luck, or dishonesty on the part of the experimentalists who produced them. For McAllister this is no reason to deny that the corresponding structures are phenomena.
Why should Buzsáki and others treat the fact that brain electrical output approximates to pink noise as a phenomenon and dismiss the 100-hertz power surges as artifacts? On McAllister's account of phenomena and phenomena detection, the way to answer that question is to find out what shaped their interests and thresholds of error tolerance. Thus, the considerations that separate the power surges from pink noise in the brain are matters of psychology, sociology, anthropology, and history. According to Woodward's and my views on data and phenomena, one cannot decide whether Buzsáki has correctly distinguished a phenomenon from an artifact without asking questions like the following:
• Was the Fourier analysis carried out correctly?
• What caused the power peaks near 100 hertz?
• How well do relations between the frequencies and amplitudes of Fourier components reflect facts about electrical activity in the brain?
• Assuming that brain wave frequencies and amplitudes are well represented by pink-noise ratios, are the power distributions among different bandwidths functionally significant?
A psychological, historical, and sociological explanation of how Buzsáki became interested in pink noise, or why he thought some of the power spikes were artifacts, should be interesting to anyone who wonders what motivated his research. But it would not explain why it makes sense for experimentalists and theoreticians to treat pink noise in the brain and the 100-hertz power jump as differently as they do.
5. Conclusion
My disagreement with McAllister is partly terminological: he uses the term “phenomenon” differently than Woodward and I do, and his conception of noise differs from what I call din. But I want to conclude by suggesting that it is not exclusively terminological.
Woodward and I believe (I think McAllister would agree) that theoretical claims are seldom if ever tested by comparing them to data. We also maintain that in most cases theories cannot predict or systematically explain data by appeal to general claims about factors that behave and interact more or less uniformly at different places and times in a variety of different circumstances. Data typically result from complex, loosely connected, short-lived assemblies of causal factors. Some of their members co-occur and interact largely by coincidence; others co-occur and interact only because experimenters have forced them to do so. The causes that produce data sets are never exactly the same from one trial to another. Environmental factors like the electrical surges from operating room equipment during ECoG recording occur irregularly from time to time. The recording equipment does not always perform in the same way. Investigators handle it differently at different times and in different laboratories. Measurements are subject to randomly produced variations. The mechanisms that produce data tend to operate stochastically. Thus, no matter how hard investigators try to replicate results, repetitions of the same experiment never produce the same data. This makes it easy to see why a scientific theory cannot be expected to deliver precise and acceptably accurate quantitative predictions or detailed explanations of data. Nor can they predict or systematically explain the operation of the collections of causes that produce them.
By contrast, what Woodward and I call phenomena are what scientists test their theories against and can hope to predict and explain in a systematic way by appeal to a relatively small number of general principles of more or less wide application. Furthermore, what Woodward and I call phenomena have a great deal more to do with what goes on in the world than the fleeting, unstable, and loosely connected causal assemblies that produce data. As a result, scientists can learn far more about how things are, what they do, and how they can be manipulated for practical purposes by investigating phenomena in our sense rather than many of the structures McAllister calls phenomena. If all of this is correct, we need terminology with which to distinguish what Woodward and I call phenomena from McAllisterian structures that do not meet our conditions for phenomena. Our disagreement is terminological in the sense that it does not matter whether “phenomenon” or some other term is used for this purpose. But the issue of whether any such distinction is philosophically useful is substantive rather than terminological.
Finally, I have suggested there are several notions of noise that are both interesting and well worth considering in connection with scientific practice. In particular, the example from Buzsáki indicates that noise as din is worth thinking about in contrast to noise as interference and to the mathematical remainders McAllister calls noise. If Buzsáki is right, pink noise in the brain is a genuine phenomenon that can be detected without extracting a signal from noisy data. Furthermore, Buzsáki's use of features of EEG and ECoG data to argue that pink noise is a functionally significant and pervasive characteristic of cortical activity, rather than an artifact of brain inefficiency or interference that electrical currents encounter as they travel through the brain, illustrates what I take to be a general fact about inferences from data to claims about phenomena. That fact is that, at bottom, such inferences are grounded in causal considerations. Buzsáki's interpretation of his data is unusual because it does not turn on standard statistical methods of signal extraction, noise elimination, error measurement, error correction, and so on. But even in the many cases where such techniques play a crucial role in interpreting data, I submit that they are employed for the purpose of settling questions about the causal factors responsible for various features of the data and, in particular, to find out which features of the data betray the causal influences of phenomena or causal factors indicative of their existence.