INTRODUCTION
Durum wheat (Triticum durum L.) is one of the most widely cultivated crops in the Mediterranean basin, where drought is the main abiotic stress limiting its production (Araus et al. Reference Araus, Slafer, Reynolds and Royo2002, Reference Araus, Villegas, Aparicio, García Del Moral, El Hani, Rharrabti, Ferrio and Royo2003). The Mediterranean climate is characterized by drought (a combination of water stress, high temperatures and excess radiation) during late spring, coinciding with the grain filling of cereal crops (Acevedo et al. Reference Acevedo, Silva, Silva, Solar, Satorre and Slafer1999). Knowledge of the physiological traits responsible for adaptation of durum wheat cultivars to Mediterranean environments may be relevant for future breeding strategies.
In the case of C3 cereals grown under Mediterranean conditions, although vegetative growth takes place at low vapour pressure deficit (VPD) and (eventually) with good soil moisture conditions, grain filling is almost always affected by late drought, associated with high irradiances and temperatures, together with a lack of precipitation. The use of less water to achieve high yield is a major objective of modern agriculture (Richards et al. Reference Richards, Condon, Rebetzke, Reynolds, Ortiz-Monasterio and McNab2001; Araus Reference Araus2004). The present study addresses some plant physiological aspects related to achieving increased water-use efficiency (WUE) in cereal crops.
Plant breeding in general, and cereal breeding in particular, have been remarkably successful during the second half of the 20th century, contributing substantially to keeping production ahead of population growth in spite of the world population increasing more rapidly than ever before (more than doubling in half a century). However, this pattern of increase has declined in recent years (Araus et al. Reference Araus, Slafer, Royo and Serret2008; Foulkes et al. Reference Foulkes, Slafer, Davies, Berry, Sylvester-Bradley, Martre, Calderini, Griffiths and Reynolds2011). Moreover, climate change will probably increase the impact of drought markedly in the Mediterranean basin, which may further constrain the productivity of durum wheat and other cereals.
While genetic increases in yield potential are best expressed in optimum environments, they are also associated with enhanced yields under drought (Araus et al. Reference Araus, Slafer, Reynolds and Royo2002; Trethowan et al. Reference Trethowan, Van Ginkel and Rajaram2002; Slafer & Araus Reference Slafer, Araus, Spiertz, Struik and van Laar2007; Latiri et al. Reference Latiri, Lhomme, Annabi and Setter2010). However, it is still debatable whether traits conferring higher yield potential can offer some advantages under drought conditions (Tambussi et al. Reference Tambussi, Nogués, Ferrio, Voltas and Araus2005b; Araus et al. Reference Araus, Slafer, Royo and Serret2008).
Capturing more soil water and utilizing stem reserves for grain filling under stress were highlighted by Blum (Reference Blum and Ribaut2006) as the primary factors responsible for superior performance of drought-adapted cereal cultivars.
For a secondary trait to be useful in a breeding programme (Bänziger et al. Reference Bänziger, Edmeades, Beck and Bellon2000; Araus et al. Reference Araus, Slafer, Royo and Serret2008), it must comply with several requirements: (1) it must be genetically correlated with grain yield (GY) in the environmental conditions of the target environment, that is to say, the relationship with yield must be causal not casual; (2) it should be less affected by environment than GY, i.e. it should have greater heritability than yield itself, and less genotype by environment interaction; and (3) enough genetic variability for the target trait to have worthwhile potential for genetic improvement.
The carbon (C) isotope composition (δ 13C) of plant dry matter, which is frequently expressed as the discrimination value (Δ13C), was proposed more than 20 years ago as a potential tool for screening wheat genotypes with higher transpiration efficiency (TE) (Farquhar & Richards Reference Farquhar and Richards1984; Rebetzke et al. Reference Rebetzke, Condon, Richards and Farquhar2002). Assuming the isotopic C composition of atmospheric carbon dioxide (CO2) is constant then the δ 13C of plant dry matter itself may be used as an indicator of WUE. The first genotypes selected using high δ 13C (or low Δ13C) as a selection trait for high WUE were subsequently released in Australia (Rebetzke et al. Reference Rebetzke, Condon, Richards and Farquhar2002; Condon et al. Reference Condon, Richards, Rebetzke and Farquhar2004). However, δ 13C may be affected by water status (through stomatal conductance) as well as by intrinsic photosynthetic capacity, driven for example by the amount of carboxylating enzyme (Rao et al. Reference Rao, Udayakumar, Farquhar, Talwar and Prasad1995; Condon et al. Reference Condon, Richards, Rebetzke and Farquhar2002).
Vigorous crop establishment is agronomically desirable as it helps to shade the soil, preventing direct evaporation from it and suppressing weeds that compete for water, therefore increasing the efficient use of water (Blum Reference Blum2009). Rapid groundcover is a crucial component and can be achieved by breeding for thinner, wider leaves, a more prostrate growth habit (Richards et al. Reference Richards, Rebetzke, Condon and Van Herwaarden2002), lower nitrogen (N) content per unit leaf area (Tambussi et al. Reference Tambussi, Nogués, Ferrio, Voltas and Araus2005b), large seed and embryo size (Aparicio et al. Reference Aparicio, Villegas, Araus, Blanco and Royo2002) and longer coleoptiles (Rebetzke et al. Reference Rebetzke, Bruce and Kirkegaard2005, Reference Rebetzke, Condon, Farquhar, Appels and Richards2008). Following some early references to the relationship between early vigour and δ 13C (Febrero et al. Reference Febrero, Blum, Romagosa, Araus, Buxton, Shibles, Forsberg, Blad, Asay, Paulsen and Wilson1993; Richards et al. Reference Richards, López-Castañeda, Gomez-Macpherson and Condon1993), a range of results has been obtained. Bort et al. (Reference Bort, Araus, Hazzam, Grando and Ceccarelli1998) did not find any correlation between early vigour and δ 13C, possibly due to the effect of low temperatures at the time when assessment of early vigour and leaf structure was being performed under field conditions. In contrast, both Condon & Richards (Reference Condon and Richards1992) and Rebetzke et al. (Reference Rebetzke, Condon, Richards and Farquhar2002) described strong genetic correlations between δ 13C and both GY and aerial biomass measured at the commencement of stem elongation. Genotypes with lower δ 13C (and higher GY potential) may still show higher GY under drought if lower δ 13C values are associated with higher water availability through increased root growth and early vigour (Villegas et al. Reference Villegas, Aparicio, Nachit, Araus and Royo2000; Tambussi et al. Reference Tambussi, Nogués, Ferrio, Voltas and Araus2005b).
Natural variation in plant N isotope composition (δ 15N) has been proposed as a useful trait for screening as it is linked to plant N metabolism, even though there is no precise knowledge of the underlying mechanisms or function (Handley et al. Reference Handley, Robinson, Forster, Ellis, Scrimgeour, Gordon, Nero and Raven1997; Robinson et al. Reference Robinson, Handley, Scrimgeour, Gordon, Forster and Ellis2000; Ellis et al. Reference Ellis, Forster, Gordon, Handley, Keith, Lawrence, Meyer, Powell, Robinson, Scrimgeour, Young and Thomas2002; Pritchard & Guy Reference Pritchard and Guy2005; Coque et al. Reference Coque, Bertin, Hirel and Gallais2006). Robinson et al. (Reference Robinson, Handley, Scrimgeour, Gordon, Forster and Ellis2000) proposed that measuring the natural abundance of both 13C and 15N may give an indication of responses to stresses such as drought and N starvation. Moreover, both δ 13C and δ 15N have been used to phenotype the response of barley mapping populations to salinity, as the natural abundances of these isotopes are strongly affected by salinity and there is genotypic variability in both stable isotopes (Ellis et al. Reference Ellis, Forster, Waugh, Bonar, Handley, Robinson, Gordon and Powell1997, Reference Ellis, Forster, Gordon, Handley, Keith, Lawrence, Meyer, Powell, Robinson, Scrimgeour, Young and Thomas2002; Handley et al. Reference Handley, Robinson, Forster, Ellis, Scrimgeour, Gordon, Nero and Raven1997). Yousfi et al. (Reference Yousfi, Serret and Araus2009) recently reported a good correlation between genotypic differences in biomass and δ 15N for durum wheat grown under moderate salinity.
The oxygen (O) isotope composition (δ 18O) of organic matter is known to reflect variation in: (i) the isotopic composition of source water; (ii) evaporative enrichment in leaves due to transpiration; and (iii) biochemical fractionation during synthesis of organic matter (Craig & Gordon Reference Craig, Gordon and Tongiorgi1965; Dongmann et al. Reference Dongmann, Nurnberg, Forstel and Wagener1974; Yakir Reference Yakir1992; Farquhar & Lloyd Reference Farquhar, Lloyd, Ehleringer, Hall and Farquhar1993). Hence, the oxygen isotope signature of plant matter, expressed either as composition (δ 18O) or as enrichment above source water (Δ18O), has been used to assess the leaf evaporative conditions at the time the material was formed (Yakir & DeNiro Reference Yakir and Deniro1990; Yakir et al. Reference Yakir, Deniro and Gat1990; Yakir Reference Yakir1992; Saurer et al. Reference Saurer, Aellen and Siegwolf1997; Barbour et al. Reference Barbour, Fischer, Sayre and Farquhar2000a, Reference Barbour, Schurr, Henry, Chin Wong and Farquharb; Barbour Reference Barbour2007). A lower δ 18O (Barbour et al. Reference Barbour, Fischer, Sayre and Farquhar2000a), together with a lower δ 13C (Fischer et al. Reference Fischer, Rees, Sayre, Lu, Condon and Saavedra1998) have been associated with a higher yield potential in bread wheat, suggesting that the genotypes exhibiting higher yield keep their stomata more open and probably exhibit a higher water use. However, the use of δ 18O for genotype selection under drought stress has had much less investigation.
Cabrera-Bosquet et al. (Reference Cabrera-Bosquet, Molero, Nogués and Araus2009, Reference Cabrera-Bosquet, Albrizio, Nogués and Araus2011) recently illustrated the usefulness of combining δ 18O and δ 13C in wheat in order to assess differences in plant growth and total transpiration, and also to provide a time-integrated record of the photosynthetic and evaporative performance of the plant during the course of crop growth. However, these studies were carried out with a limited number of genotypes grown in pots (Cabrera-Bosquet et al. Reference Cabrera-Bosquet, Molero, Nogués and Araus2009) or under field conditions (Cabrera-Bosquet et al. Reference Cabrera-Bosquet, Albrizio, Nogués and Araus2011) with a single genotype. Under field conditions on a set of 24 genotypes of bread wheat Ferrio et al. (Reference Ferrio, Mateo, Bort, Abdalla, Voltas and Araus2007) failed to identify genotypic variability in isotope composition. Recently, Condon (Reference Condon2012) failed to find differences in δ 18O between water treatments, possibly due to the small treatment difference in subsoil water use.
The current work presents GY and its agronomic components, biomass and the stable isotope signatures of C, N and O in different plant parts from a collection of recombinant inbred lines (RIL) of durum wheat grown under supplementary water supply and moderate water stress. The two trials (IR and RF) reported in the present study belong to a wider set of trials reported in Kehel et al. (Reference Kehel, Habash, Gezan, Welham and Nachit2010), but analysis of the stable isotope compositions of C, N and O is unique to the present work. The objective of the present study was to compare how the three different isotope signatures performed in predicting genotypic differences in early vigour and grain yield.
MATERIALS AND METHODS
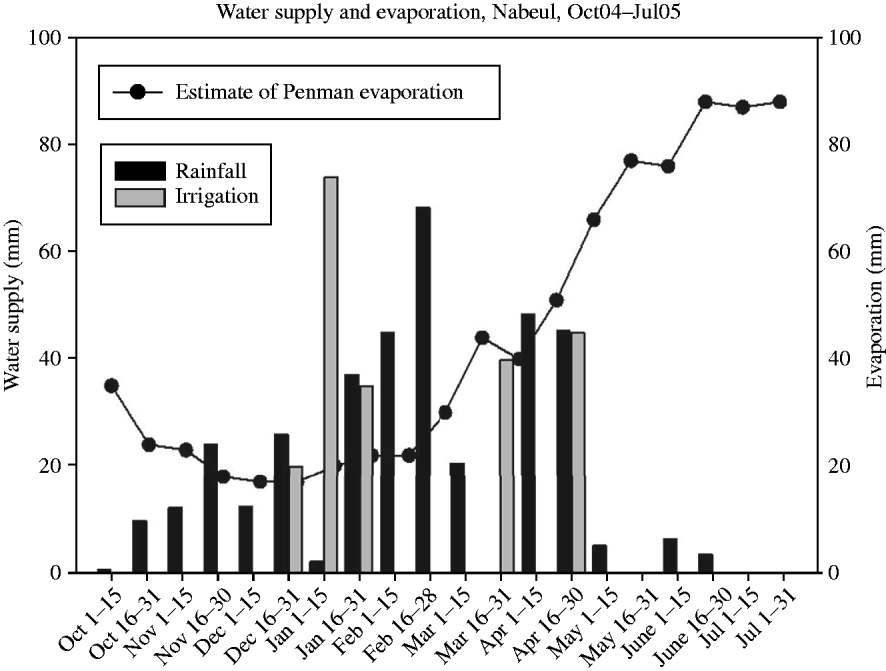
A field experiment was conducted during the 2004/05 season in Oued Souhil, Nabeul, in the Cap Bon peninsula, northern Tunisia (10°40′E, 36°27′N, 24 m a.s.l.). The climatic area is described as semi-arid. During the growing season, rainfall was 235 mm, average daily temperature between 10 and 25 °C and total evaporation was 530 mm (Fig. 1). Soil texture was very sandy and was a homogeneous fluvisol of low organic matter content and low water-holding capacity. Its agronomic characteristics could be described as leading to terminal stresses with low productivity.
Weather conditions during the growing season in Nabeul, where irrigation events are shown (clear bars) Estimates of Penman evaporation were calculated, and amounts of water supply (rainfall and irrigation) are shown in 2-weeks periods, from October 2004 to July 2005.

Plant material
The durum wheat (Triticum turgidum L. ssp. durum (Desf.) Husn.) population used in the present study consisted of 112 RILs derived from the cross Lahn×Cham1 using the single seed descent (SSD) method from the cross identification number ICD-MN91–0015 (ICARDA 2004), plus the two parents. Lahn is also known as Jennah Khetifa (Yousfi et al. Reference Yousfi, Serret and Araus2009). This cross was made in 1991 at the Tel Hadya research station (Aleppo province, Syria) by the CIMMYT/ICARDA durum breeding programme for Mediterranean dryland areas (Nachit et al. Reference Nachit, Elouafi, Pagnotta, El Saleh, Iacono, Labhilili, Asbati, Azrak, Hazzam, Benscher, Khairallah, Ribaut, Tanzarella, Porceddu and Sorrells2001). The Lahn parent is a highly productive cultivar with a maximum yield of up to 12 t/ha and has a strong stem with high lodging resistance, large grain size and good grain quality. The Cham1 parent has good drought tolerance, showed durable resistance to yellow rust and high yield stability in Mediterranean environments; it has been released in most Mediterranean countries, from Portugal to Iraq (west to east) and from Turkey to Sudan (north to south) (Kehel et al. Reference Kehel, Habash, Gezan, Welham and Nachit2010).
Growth conditions
Plants were grown under field conditions. Sowing was conducted on 16–17 December 2004 with a total of 144 plots per water treatment. The whole set of plots of each water treatment was surrounded by plots containing local commercial varieties. Each plot consisted of six rows, 2·5 m long with 400 mm between rows.
The 112 RILs were tested in unreplicated field trials, adopting a modified augmented design as a field experimental scheme (Fig. 2), including six replicates of each of the five controls (cvars Mrb5, Gidara-2, Hau, Krf and Waha). The two parents of the collection, Lahn and Cham-1, were also included in single plots (numbers 143 and 144). The randomization of the RILs within each set of 112 plots was different for each water treatment.
Experimental design of the trial: unreplicated augmented design, with a commercial cultivar surrounding the trial. Coloured plots indicate those with 6 control cultivars (cvars Mrb5, pink; Gidara-2, green; Hau, orange; Krf, grey and Waha, green). Plot numbers 143 and 144 correspond to the parents of the genotype collection (Lahn and Cham-1, respectively). White plots correspond to the 112 RILs. The design was repeated for the two water treatments: the only difference between RF and IR was how the 112 RILs were distributed within the white plots. (Colour version available online.)
Fertilization with phosphorous (P) was conducted as a single supply of 45 kg P2O5/ha (100 kg of triple superphosphate ‘Super 45 Granule’ with total 0·45 phosphoric anhydride) on 29 Nov 2005, 2 weeks before sowing. Nitrogen was supplied as ammonium nitrate, split into two doses of 100 kg/ha each, on 19 Jan 2005 (three leaves (3L)) and in mid-February (five leaves (5L)).
The two different treatments, irrigated (IR) and rainfed (RF), were adjacent to each other but separated by a distance of 10 m. Shortly after sowing (27 Dec 2005) an initial flood irrigation of 20 mm was supplied to ensure uniform germination and emergence for both IR and RF. The RF trial only received 10 mm of irrigation on 17 Jan 2006, whereas IR received an additional 22 mm on 8 Jan, 22 mm on 10 Jan, 30 mm on 13 Jan, 35 mm on 17 Jan, 40 mm on 22 Mar, 5 mm on 23 Apr and 45 mm on 29 Apr 2006. Total water supplied was 218 mm and 30 mm to the IR and RF treatments, respectively. In addition, the accumulated rainfall between sowing to harvest (end of December to end of June) was 235 mm.
Data recording
For each plot, the whole aerial part of each plant was collected from a 0·5 m length of a single row, at the 3L and six-leaf (6L) stages, from 1 m of a single row at anthesis, and from 2·5 m of three adjacent rows at harvest. Complementary observations were made on subsamples of ten plants at the 3L stage, the 6L stage and anthesis. All samples were oven-dried at 80 °C for 48 h before being weighed and ground to a fine powder for stable isotope analysis.
Total plant aerial biomass was measured in seedlings at the 3L and the 6L stages as well as at anthesis and harvest. Total aerial biomass and GY were measured from the three central rows of each plot at maturity. Further the harvest index (HI) was calculated as the ratio of GY to total shoot biomass. Other yield components (spikes/m2, thousand grain weight (TGW) and grains/m2) were also calculated.
Stable isotope analysis
Total N content and C and N isotope analyses
For each analysis, 1 mg of finely powdered plant tissue, i.e. seedling (6L stage), flag leaf blade, and mature grain tissue was weighed in tin cups. The total N content of samples was analysed at the Colorado Plateau Stable Isotope Laboratory (CPSIL) using an Elemental Analyser (EA) (Carlo Erba 2100, Milan, Italy). The same EA, interfaced with an isotope ratio mass spectrometer (IRMS) (Thermo-Finnigan Deltaplus Advantage, Bremen, Germany), was also used to analyse the 13C/12C ratios (R) of plant material. Results were expressed as δ 13C values using a secondary standard calibrated against Vienna Pee Dee Belemnite calcium carbonate (VPDB), and the analytical precision was 0·1‰.
 $$\delta ^{13} {\rm C}(\permil) = \left[ {\left( {\displaystyle{{R_{{\rm sample}}} \over {R_{{\rm Standard}}}}} \right) - 1} \right] \times 1000$$
The same δ notation was used for the 15N/14N ratio expression (δ 15N), but in this case the standard referred to N2 in air and the analytical precision was 0·13‰.
Oxygen isotope analyses
The oxygen (O) isotope composition (δ 18O) was determined only in mature grain at the Scientific Facilities of the University of Barcelona. The 18O/16O ratios of dry plant samples were determined by an on-line pyrolysis technique using a thermo-chemical elemental analyser (TC/EA, Thermo Quest Finnigan, Bremen, Germany) coupled with an IRMS (Delta C Finnigan MAT, Bremen, Germany). Results were expressed as δ 18O values using a secondary standard calibrated against the Vienna standard mean oceanic water (VSMOW), and the analytical precision was 0·2‰.
 $$\delta ^{18} {\rm O}(\permil) = \left[ {\left( {\displaystyle{{R_{{\rm sample}}} \over {R_{{\rm Standard}}}}} \right) - 1} \right] \times 1000$$
Spatial analysis and heritability
For each trial, raw data were adjusted for spatial trends using an automatic model selection based on Akaike's Information Criterion (AIC) and Schwarz's Bayesian Criterion (BIC) (Kehel et al. Reference Kehel, Habash, Gezan, Welham and Nachit2010). For each trial, the error model with the minimum value of AIC was then chosen as the best model for that trait in that trial. For the selected model, a generalized heritability (h 2) coefficient for the test line effects (Cullis et al. Reference Cullis, Smith and Coombes2006; Kelly et al. Reference Kelly, Smith, Eccleston and Cullis2007) was then calculated from an analysis fitting the test lines as random as
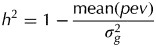 $$h^2 = 1 - \displaystyle{{{\rm mean(}pev{\rm )}} \over {\sigma _g^2}} $$
where σ g2 was the estimated variance of the random test line effects and pev was the vector of estimated prediction error variances for the random test line using empirical best linear unbiased predictor (EBLUP). Both quantities were provided as a standard output from a mixed model in Genstat 12th edition (Payne et al. Reference Payne, Murray, Harding, Baird and Soutar2009).
Genetic correlation
For the genetic correlation between traits A and B, the formula described by Falconer & Mackay (Reference Falconer and Mackay1996) was used as follows:
 $$r_{\rm g} = \sigma _{{\rm AB}} /\left( {\sigma _{\rm A} \times \sigma _{\rm B}} \right)$$
where σ AB was the square root of genetic covariance between A and B, σ A was the square root of genetic variance of A and σ B was the square root of genetic variance of B.
The square root of genetic covariance between A and B was computed as
 $$\sigma _{{\rm A}{\rm. B}} = (\sigma _{({\rm A} + {\rm B})}^2 -(\sigma _{\rm A}^2 + \sigma _{\rm B}^2 ))/2$$
Means of adjusted data for each environment were compared by Duncan's test (P<0·05) or by the Tukey-b multiple comparison test (P<0·05). A bivariate correlation procedure was used to calculate the Pearson correlation coefficients. Multiple linear regression analysis (stepwise) was used to analyse the relationship between the studied variables. Linear stepwise models were built from water and genotype means. Data were analysed using the SPSS statistical package (SPSS Inc., Chicago, IL, USA).
RESULTS
Effect of water treatment on GY and total biomass
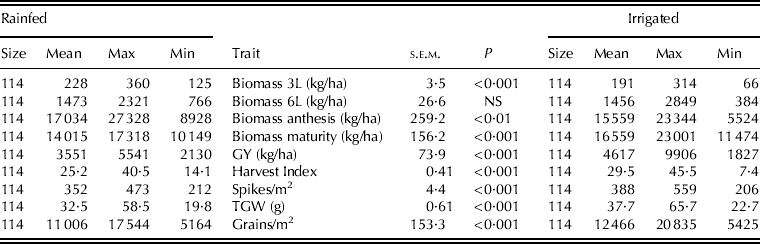
The water treatment significantly affected GY and biomass at maturity as well as HI (Table 1a). The IR treatment increased GY by 30% compared with RF, while total aerial biomass at maturity and HI increased by 18 and 17%, respectively. Biomass at the 3L and 6L stages and at anthesis was slightly higher for the RF treatment than for IR. The biomass was significantly higher under IR (18%) only at maturity. The ranges of the different traits between the highest and lowest yielding genotypes were also largest for the IR treatment.
Descriptive statistics under the two environmental conditions for the agronomical traits studied in a collection of 114 RIL of durum wheat. All statistics were calculated after data adjustment. Column P shows the probability relating to differences between the RF and IR environments. s.e.m.is the standard error of the mean of the 228 values
NS: not significant.
Effect of water treatment on δ 13C, δ 18O, δ 15N and N content
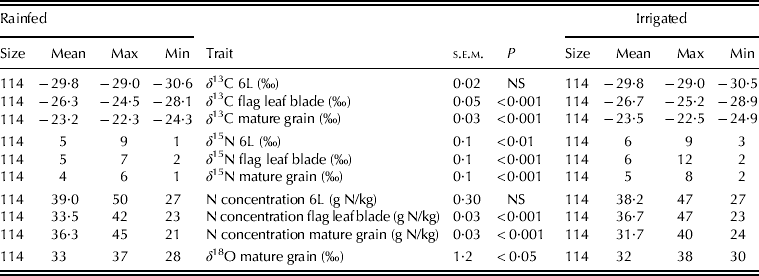
The δ 13C of seedlings (6L stage) was not significantly different between treatments (−29·8‰) (Table 1b). Later, it became more positive as the crop developed, reaching −23·2‰ (RF) and −23·5‰ (IR) in the mature grain, a small but significant difference. The flag leaf blade at anthesis showed intermediate values (−26·3‰ for RF and −26·7‰ for IR) between the 6L stage and the mature grain.
Descriptive statistics under the two environmental conditions for the stable isotope traits studied in a collection of 114 RIL of durum wheat. All statistics were calculated after data adjustment. Column P shows the probability relating to differences between the RF and IR environments. s.e.m. is the standard error of the mean of the 228 values
NS: not significant.
The δ 18O was only measured in the mature grain, and it was found to be slightly higher under RF (32·6‰) than under IR (32·3‰) conditions. The range of values was found to be larger under RF (9·2‰) compared with IR (7·6‰).
The δ 15N was always higher under IR conditions, regardless of the developmental stage at which it was measured. The higher difference (1·4‰) between RF and IR was found in blades at anthesis and δ 15N of mature grain was significantly lower in RF (3·9‰) than in IR plants (4·6‰).
Nitrogen concentration (g N/kg dry matter (DM)) in seedlings was similar in both trials, while at anthesis values for the flag leaf were lower at RF (34 g N/kg) compared with IR (37 g N/kg) but higher in grain at RF (36 g N/kg), compared with IR (32 g N/kg). The weight of the grains was negatively correlated with the concentration of N in grains, both under RF (r=−0·413, P<0·01) and IR (r=0·514, P<0·01). Total N accumulated in the grains (obtained by multiplying GY by N concentration in the grains) was lower under RF (116 kg N/ha) than under IR (146 kg N/ha).
Phenotypic variation in GY explained by agronomical and physiological traits
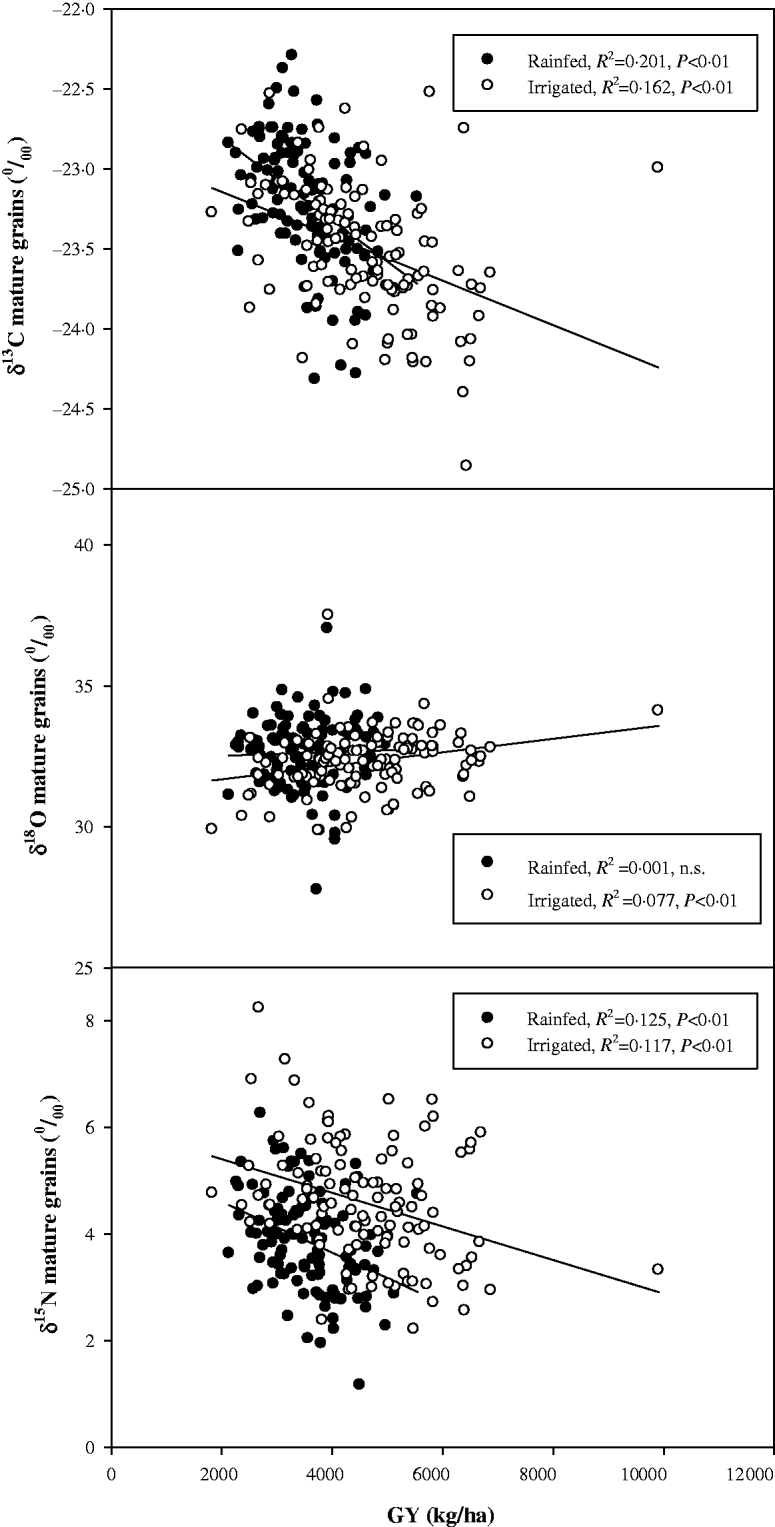
Pearson correlation coefficients between yield components and the δ 13C of different stages were stronger, in general, under RF than under IR, with these coefficients increasing from earlier to later developmental stages (Table 2). Thus, the highest absolute values of these coefficients were always found for mature grain under both water conditions. The δ 13C correlated negatively against GY and most of the yield components. The highest correlation coefficient between the δ 13C of mature grain and any yield component was comparable with that of the δ 13C of mature grain and GY (−0·448 and −0·402 for RF and IR, respectively (Fig. 3, top).
Relationships across the 114 RILs between δ 18O and δ 15N measured in mature grain and GY, under the two water treatments.
Pearson correlation coefficients between C isotope compositions measured at three different developmental stages (6L, flag leaf blade at anthesis and mature grain) and GY plus a number of yield components and physiological traits, under the two environmental conditions. Correlations were calculated from adjusted data
NS: not significant.
The Pearson correlation coefficients between yield components and the δ 15N of different stages were generally weak or not significant. Only the δ 15N of mature grain was correlated with GY and TGW under both RF (−0·354, P<0·01 and −0·411, P<0·01, respectively) and IR (−0·342, P<0·01 and −0·235, P<0·05, respectively), and with spikes/m2 under IR (−0·354, P<0·01) (Fig. 3, bottom).
There was no significant Pearson correlation coefficient for δ 18O with any measured parameter under RF conditions, whereas under IR it was correlated (r=0·277, P<0·01) with GY and with the δ 13C of flag leaf blades (r=0·243, P<0·01).
Common yield components such as TGW, number of spikes/m2 or number of grains/m2 were significantly correlated with GY under both treatments.
Heritabilities and genetic correlations of agronomic and physiological traits against GY
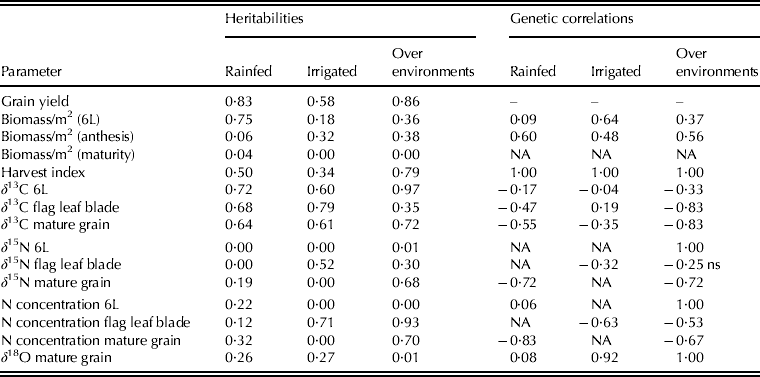
Broad sense heritabilities (H 2) for biomasses of seedlings, GY and HI were higher under RF conditions than under IR (Table 3). In contrast, H 2 for biomass at maturity was lower under RF. Heritabilities for δ 13C were always above 0·60, regardless of the plant part studied, and the values were quite similar between IR and RF trials. Heritabilities for δ 15N and N concentration were generally quite low, except for the flag leaf blade of IR at anthesis (0·71). Heritability for δ 18O in grain was also very low, for both RF and IR trials.
Heritabilities and genetic correlations under the two environmental conditions for the main traits studied: grain yield, biomass and harvest index, and isotope compositions for the different developmental stages. Heritabilties and genetic correlations were calculated from adjusted data
NA: not available.
While under RF conditions, none of the traits showed a higher H 2 than GY itself, under IR conditions δ 13C measured at all three stages showed higher H 2 than GY. Heritabilities were also calculated for the different traits over environments. In these cases, only the δ 13C of seedlings and N concentration flag leaf blades showed higher heritabilities than GY while the H 2 of δ 18O was very low. In this regard, the heritability of grain number was intermediate (0·59 under RF and 0·37 under IR), whereas the heritability for number of spikes was very low under both environments. However, heritability for the grain size was very high (0·90 for RF and 0·87 for IR).
Genetic correlations (Table 3) with GY could not be calculated for a number of traits because of their very low heritability values. However, the genetic correlations for HI were maximum (1·00) under both water conditions. The second and third highest genetic correlations under RF were against δ 15N (−0·72) and N concentration (−0·83) measured in mature grains. Under IR, seedling biomass (+0·64) and N concentration in flag leaf blades (−0·63) showed the highest genetic correlations after that shown by the δ 18O of mature grain (+0·92). However, δ 18O showed quite low heritability under both environments.
Sources of variation in GY
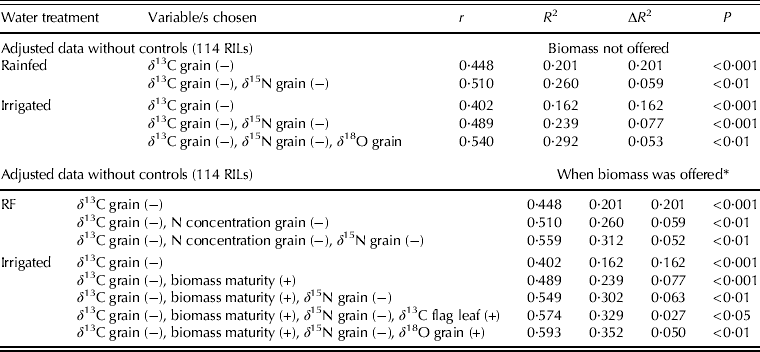
Within each water treatment, multiple linear regressions (Stepwise analysis) were performed using only stable isotopes (δ 13C, δ 15N) in the first instance and later accumulated biomasses and N concentration, measured in three different plant samples (whole seedlings, flag leaf blades and mature grain) as independent variables and with GY as a dependent variable. When only stable isotope compositions were supplied as independent variables (Table 4, top), the δ 13C of mature grain alone accounted for 0·16 and 0·20 of the variation under IR and RF, respectively. The model also included the δ 15N of mature grain, thus explaining 0·24 and 0·26 of the variation under IR and RF, respectively. It is worth mentioning that δ 18O was chosen under IR, accounting for an increase in the variability explained from 0·24 to 0·29.
Stepwise analysis explaining GY variation from δ 13C, δ 15N, δ 18O, N concentration and accumulated biomass on three different developmental stages. Top: only δ 13C and δ 15N were used in the models. Bottom: δ 13C, δ 15N, N concentration and biomass were used in the models
* Biomass at 3L, 6L, anthesis and maturity.
When, in addition to stable isotopes, N concentration and biomasses at different stages were also offered as independent variables (Table 4, bottom), the N concentration in the mature grain appeared as a second variable that described the variation in GY under RF, whereas the δ 15N of mature grain appeared as the third variable. The three variables accounted for up to 0·31 of the variation under RF. On the other hand, under IR, the δ 13C of mature grain, biomass at maturity, the δ 15N of mature grains and the δ 13C of flag leaf blades, entered in that order, accounted for up to 0·33 of GY variability. In a further step, δ 18O was also included under IR, to account for up to 0·35 of GY variability although the δ 13C for flag leaf blades disappeared from the model. In general, stable isotope signatures (δ 13C, δ 15N and δ 18O), especially in the mature grain under IR, were able to explain some of the GY variability. However, some of the signatures appeared to be interchangeable. The first variable chosen was always δ 13C for the mature grain. The additional isotope signatures added to the models were the δ 15N of mature grain, the δ 13C of flag leaf blades or the δ 18O of mature grain.
Further stepwise analysis was performed to understand the causes of variation in early vigour, measured as seedling biomass, and using δ 13C, δ 15N and N concentration measured at different developmental stages as independent variables (Table 5). Under RF, the model only accommodated the δ 13C of seedlings, accounting for 0·18 of the variation. Under IR, the δ 13C of seedlings accounted for 0·31, whereas the addition of N concentration of seedlings increased the variation explained up to 0·35. Stable isotope signatures of later developed organs did not enter the stepwise models.
Stepwise analysis explaining early vigour (biomass at 6L) variation from δ 13C, δ 15N and N concentration measured at three development stages

DISCUSSION
Growth conditions and biomass accumulation
Water stress associated with RF conditions reduced GY by 23% when compared with the IR treatment. However, the yields of the IR trial were 25 and 35% lower than that achieved under IR for the same wheat population during the following two seasons (2006 and 2007), which produced mean yields of 6199 and 7122 kg/ha, respectively (Kehel et al. Reference Kehel, Habash, Gezan, Welham and Nachit2010). This is well within the yield achieved in the same region of Tunisia with the widely used cultivar Karim (Latiri-Souki et al. Reference Latiri-Souki, Nortcliff and Lawlor1998) as well as in other Mediterranean locations under full IR (Merah et al. Reference Merah, Deleéns, Souyris, Nachit and Monneveux2001a; Garcia del Moral et al. Reference García Del Moral, Rharrabti, Villegas and Royo2003; Maccaferri et al. Reference Maccaferri, Sanguineti, Demontis, El-Ahmed, Garcia Del Moral, Maalouf, Nachit, Nserallah, Ouabbou, Rhouma, Royo, Villegas and Tuberosa2010). The 2005 RF and IR trials experienced moderate and mild stress conditions, respectively. The differences in water availability between the RF and the IR trials increased progressively throughout the crop cycle. Although drought and differences in water supply started very early, differences in biomass were still not significant at the 6L stage (seedlings). Differences in biomass reached significance later in development, at anthesis, and further increased at maturity.
Isotope signatures throughout the growth stages
Carbon isotope composition was used to assess water status throughout the crop cycle, by measuring it in samples from vegetative and reproductive phases of the crop. When measured in plant matter, δ 13C provides a time-integrated measurement of TE (the ratio of C gained to water transpired) over the period during which dry matter is assimilated (Farquhar & Richards Reference Farquhar and Richards1984). In this regard, according to δ 13C, TE was higher under RF compared with IR in the later stages of crop growth (anthesis and maturity), but not in early seedling growth. This pattern agrees with an increasing difference in water status between RF and IR plants during the season. The higher water availability under IR would have allowed the maintenance of higher transpiration rates during the whole growth cycle, but with lower efficiencies (Farquhar & Richards Reference Farquhar and Richards1984; Hubick & Farquhar Reference Hubick and Farquhar1989) following a progressive increase in water deficit conditions. The anatomy of the photosynthetic organs may also be involved, with upper photosynthetic organs being adapted to the progressively higher radiation and transpirative gradients achieved during the growing season (Araus et al. Reference Araus, Tapia and Alegre1989). In this sense, although the spike is formed at earlier stages, it is a basic contributor of assimilates for the growing grains and has an intrinsically high δ 13C value (Bort et al. Reference Bort, Araus, Hazzam, Grando and Ceccarelli1998) associated with the specific xeromorphic characteristics of this organ (Tambussi et al. Reference Tambussi, Nogués and Araus2005a, Reference Tambussi, Bort and Araus2007).
In addition to δ 13C becoming more positive, in later stages the range of genotypic variability in δ 13C values steadily increased from the seedling (1·6 and 1·5‰ for RF and IR, respectively) to the mature grain (2·0 and 2·4‰ for RF and IR, respectively). This might be related to differential adaptation/responses of the different RILs to the progressively changing environmental conditions in terms of increasing VPD.
Similar trends have been found for stable isotope composition of N. Natural variation in plant N isotope composition (δ 15N) has been proposed as a useful trait for screening, as it is linked to plant N metabolism. No clear relationship between δ 15N and biomass and/or GY has been previously reported (Ellis et al. Reference Ellis, Forster, Waugh, Bonar, Handley, Robinson, Gordon and Powell1997, Reference Ellis, Forster, Gordon, Handley, Keith, Lawrence, Meyer, Powell, Robinson, Scrimgeour, Young and Thomas2002; Handley et al. Reference Handley, Robinson, Forster, Ellis, Scrimgeour, Gordon, Nero and Raven1997), despite the fact that δ 15N has been used to map the phenotype of populations exposed to salinity (Ellis et al. Reference Ellis, Forster, Gordon, Handley, Keith, Lawrence, Meyer, Powell, Robinson, Scrimgeour, Young and Thomas2002; Yousfi et al. Reference Yousfi, Serret and Araus2009). In the present study, the results of δ 15N follow the expected trend of lower values under stress conditions compared with favourable conditions, which can be explained by a reduced stomatal conductance, whose effect is a reduction in the loss of ammonia and nitrous oxide that would then reduce 15N enrichment, hence decreasing δ 15N (Farquhar et al. Reference Farquhar, Firth, Wetselaar and Weir1980; Smart & Bloom Reference Smart and Bloom2001). In the present study, the difference in δ 15N between RF and IR increased from the vegetative stage to the final mature grain. Raimanová & Haberle (Reference Raimanová and Haberle2010) reported a decrease in grain δ 15N in fertilized wheat as a consequence of water stress. The greater reduction in grain δ 15N under water shortage could be the result of a lower demand for N. Thus, a greater proportion of grain N originating from N fertilizer (ammonium nitrate) compared with the soil N coming from nitrification of organic matter, which is characterized by a higher δ 15N (Serret et al. Reference Serret, Ortiz-Monasterio, Pardo and Araus2008), may have resulted in a lower δ 15N of grains in the less productive trial. While δ 15N decreased as plant parts were sampled later in the crop cycle, the values were always higher under IR compared with RF for the three plant parts, which would be consistent with the higher amount of N accumulated in grains under IR.
The signature of the stable oxygen isotope (δ 18O) in plant matter has been reported as reflecting the transpirative (Barbour Reference Barbour2007; Farquhar et al. Reference Farquhar, Cernusak and Barnes2007) conditions (i.e. evaporative enrichment of leaf water caused by transpiration) in which the plants were grown. Accordingly, Barbour et al. (Reference Barbour, Fischer, Sayre and Farquhar2000a) proposed the use of δ 18O in plant matter as an integrative indicator of genetic differences in stomatal conductance for bread wheat, and its application to drought conditions has been assessed in further studies (Ferrio et al. Reference Ferrio, Mateo, Bort, Abdalla, Voltas and Araus2007; Cabrera-Bosquet et al. Reference Cabrera-Bosquet, Molero, Nogués and Araus2009, Reference Cabrera-Bosquet, Albrizio, Nogués and Araus2011). Condon (Reference Condon2012) recently suggested that variation in oxygen isotope composition (δ 18O) is more strongly related to variation in stomatal conductance than is variation of δ 13C, and therefore may provide stronger relationships with water extraction. The δ 18O is expected to increase with higher evaporative demand and lower stomatal conductance, as is the case in winter cereals under terminal drought. The results shown in the present work confirm this trend since the δ 18O of mature grains was slightly lower under IR conditions compared witho RF. The difference between the two treatments was minimal but significant. The range of variation in δ 18O was larger for RF (9·2‰) than for IR (7·6‰), probably expressing larger adaptive genotypic variability to adverse environmental conditions. Recently, no water treatment differences were observed in wheat for grain δ 18O (Condon Reference Condon2012), probably because the water availability was not different enough between the two treatments imposed after anthesis.
When water is limiting crop production, conservation and efficient use of water are very important considerations for agriculture (Blum Reference Blum2009) when aiming to increase GY. The larger relative amount of water used by the IR treatment to obtain an increase in dry matter production resulted in a lower WUE for IR compared with the RF treatment, as also reported when selection for high TE favoured genotypes with low production under water deficit, since high Δ13C has frequently been found to be associated with high GY (Acevedo Reference Acevedo, Ehleringer, Hall and Farquhar1993; Ehdaie & Waines Reference Ehdaie and Waines1993; Morgan et al. Reference Morgan, Lecain, Mccaig and Quick1993; Sayre et al. Reference Sayre, Acevedo and Austin1995; Araus et al. Reference Araus, Amaro, Zuhair and Nachit1997, Reference Araus, Amaro, Casadesús, Asbati and Nachit1998; Merah et al. Reference Merah, Deleéns and Monneveux1999).
Heritabilities for δ 15N and δ 18O, together with those of biomass and the yield components measured in the present work, were lower than for GY, both when these H 2 were measured for each water condition and when they were calculated over growing conditions. Only δ 13C for the three stages and under both water treatments showed consistently higher H 2 than GY, which supports the potential usefulness of the signature of this stable isotope in breeding programmes. In addition, N concentration of the flag leaf blade under IR also showed a relatively high heritability. It is worth mentioning that the largest H 2 obtained was that of δ 13C measured in seedlings over the two environments. Thus, at this early stage of the crop, δ 13C appears as a constitutive trait independent of environment as previously emphasized by Condon & Richards (Reference Condon and Richards1992) and Rebetzke et al. (Reference Rebetzke, Condon, Richards and Farquhar2002), which also explains the highest heritabilities for δ 13C being found in seedlings.
Among the isotopes studied in the present work, δ 13C was the best correlated with GY, whereas δ 15N and δ 18O, as well as other plant traits such as the amount of biomass at the seedling stage and anthesis, showed lower genetic correlations with GY. In this regard, CSIRO in Australia have developed and released several commercial wheat cultivars (Condon et al. Reference Condon, Richards, Rebetzke and Farquhar2004) using low Δ13C (and thus high TE) measured at tillering under favourable conditions as the selection criterion (Richards Reference Richards2006) based on the relationship that has been postulated for this trait. These varieties are adapted to severe water stress conditions and rely solely upon soil moisture accumulated before planting. However, it is shown in the present paper that the relationship between δ 13C and final GY in the early stages of crop growth is the reverse: i.e. lower TE is related to a higher GY. However, this lower efficiency has a relatively low effect on genotypic variability of GY (see later). This might be related to the ‘efficient use of water’ described by Blum (Reference Blum2009), which limits photosynthesis, as opposed to ‘WUE’. On the other hand, the genetic correlations between the set of traits measured and GY showed a wide variability. However, it should be noted that some of the largest genetic correlations with GY were those shown by the δ 13C of the flag leaf blades and mature grains when the combined effect of the two environments was considered, which would suggest that these parameters show some constitutive pattern. However, the same genetic correlations within each water treatment were considerably lower. In addition, Araus et al. (Reference Araus, Villegas, Aparicio, García Del Moral, El Hani, Rharrabti, Ferrio and Royo2003) showed stronger correlations, always positive, between GY and Δ13C when it was measured in the mature grain than when it was measured in seedlings. In fact, when considering Δ13C in the seedlings, some relationships were negative and less significant, meaning that TE at the vegetative stage did not impact on GY. Breeding for transpiration-use efficiency under moderate stress has been considered a main target for a number of years, although recently, it appears that breeding for improvement of intrinsic photosynthetic capacity under favourable conditions would be the next step to be targeted (Foulkes et al. Reference Foulkes, Slafer, Davies, Berry, Sylvester-Bradley, Martre, Calderini, Griffiths and Reynolds2011; Parry et al. Reference Parry, Reynolds, Salvucci, Raines, Andralojc, Zhu, Price, Condon and Furbank2011; Reynolds et al. Reference Reynolds, Bonnett, Chapman, Furbank, Manès, Mather and Parry2011).
As mentioned previously, the H 2 for δ 18O in mature grain were quite low under the two environments and disappeared when data from the two conditions were combined. In contrast, the H 2 for δ 15N increased from the vegetative to the reproductive stages, when considering the combination of data from the two environments. In this case, δ 15N in the mature grains showed a relatively high heritability of 0·68. Consequently, δ 15N seems to be a much more constitutive trait than δ 18O, and thus the former might have greater breeding potential than the latter. The low heritability of a trait can be due to a high genotype by environment interaction as well as a low genotypic effect compared with that of the environment. Information about heritability values for δ 18O is scarce but they are generally thought to be lower than those for δ 13C. Even so, Ferrio et al. (Reference Ferrio, Mateo, Bort, Abdalla, Voltas and Araus2007) reported H2 values for δ 18O in bread wheat that were higher than those for GY. Estimations of H2 values for δ 18O in maize (L. Cabrera-Bosquet, unpublished results) give medium-high values, comparable with those for GY.
Sources of variation of early vigour
The causes of variation in early vigour were also assessed through multiple stepwise linear analyses of isotope signatures at seedling stages vs. biomass of seedlings at the 6L stage. The δ 13C was always the first parameter to be included in the models, whereas the second and subsequent parameters depended on the water conditions and whether biomass was excluded or not. The mechanisms responsible for genotypic differences in early vigour are of great interest for developing new genotypes adapted to water-limited situations. In contrast, in environments with typical Mediterranean climates (winter–spring rainfall), improved WUE did not confer an advantage in yield (Condon et al. Reference Condon, Richards, Rebetzke and Farquhar2004). In this case, early vigour seems to be more important (Tambussi et al. Reference Tambussi, Bort and Araus2007) through its effect on improved light interception and a reduction in direct water evaporation from the soil. In the present work, it was only under IR that the N content of seedlings positively affected early vigour. This was probably related to a larger leaf area index (LAI), which appeared as the second parameter in a stepwise model explaining the variation of biomass accumulation in seedlings. Exhaustive screening of international wheat collections and a broad-based composite cross population has revealed several important sources of genetic variation for early plant vigour (Richards & Lukacs Reference Richards and Lukacs2002). As an example, Maydup et al. (Reference Maydup, Graciano, Guiamet and Tambussi2012) recently described that the use of semi-dwarf genotypes of wheat has decreased early vigour of modern cultivars.
In the present work, a negative correlation was found between δ 13C and biomass at the seedling stage only for IR and not for RF. However, the stepwise model included the δ 13C of seedlings as the first parameter, which explained some variation under both RF and IR. Furthermore, under IR, N content was included as a second parameter that explained the variation of seedling biomass. Under IR a higher WUE negatively affected seedling growth and thus early vigour. The negative sign of δ 13C in both stepwise models means that a higher WUE impairs seedling growth. On the other hand, the positive sign on N content in the model for IR might mean that N improved the WUE of seedlings.
The stepwise model at the seedling stage also included N concentration as the second parameter explaining variation in biomass, but only for the IR treatment. This might reflect differences in the thickness or density of the leaves, or the enhanced ability provided by the wettest environment to capture N available in the soil. This could be due to both water treatments being supplied with the same amount of N split into two applications, with the first just after the 3L stage and the second just after the 5L stage. A number of parameters showed that the RF trial suffered a mild stress during the growing season. The IR provided could support some recovery in the performance of the crop and increase dry matter accumulation in the form of total biomass and grain weight. Early vigour, although showing some correlation with GY, does not appear to be relevant in explaining performance of these genotypes under the environmental conditions studied. However, transpiration in the flag leaf had a minor effect on final GY under IR but not under RF conditions. The δ 13C measured in different stages of the crop is able to explain a certain amount of variation in GY, as will be discussed in the next section.
A negative relationship between the leaf area and photosynthetic rate has been reported for wheat (Austin Reference Austin1999). This negative correlation has been attributed to an increase in leaf thickness and/or tighter packing of mesophyll cells (even without an increase in leaf thickness) with higher N content and higher photosynthetic capacity in smaller leaves (Araus et al. Reference Araus, Alegre, Tapia and Calafell1986). Therefore, differences in photosynthetic rate seem to be due to the packing of mesophyll cells rather than to leaf thickness. The positive relationship between δ 13C at 6L stage and the chlorophyll content (data not shown) can be accounted for by the anatomy of the leaves. Higher leaf chlorophyll content during the vegetative stage might indicate a thicker or more compacted mesophyll cells that would decrease the Ci/Ca by restriction of mesophyll conductance (Parry et al. Reference Parry, Reynolds, Salvucci, Raines, Andralojc, Zhu, Price, Condon and Furbank2011), thus making δ 13C more positive. Indirectly, thicker leaves might produce a lower leaf area and reduce the total plant area.
Sources of genotypic variation of GY
Sources of variation of GY have been described by Evans et al. (Reference Evans, Wardlaw, Fischer and Evans1975), Slafer et al. (Reference Slafer, Araus, Richards, Satorre and Slafer1999), Passioura (Reference Passioura2002), Fischer (Reference Fischer2007) and Reynolds et al. (Reference Reynolds, Foulkes, Slafer, Berry, Parry, Snape and Angus2009).The importance of the different sources of variation in explaining GY was studied among a number of yield components and several agronomical and physiological parameters measured during the crop cycle. Under RF, the negative and significant correlations found between δ 13C at all stages and GY suggest that the higher yielding genotypes were those showing lower transpiration efficiencies. The same correlation coefficients were lower under IR compared with RF, and even the relationship with irrigated flag leaf blades was not significant. The negative relationship between GY and δ 13C under both environments further supports the hypothesis that the RF trial was not under severe stress. A number of other yield components showed some significant correlations with δ 13C at the different stages, especially under RF conditions, but these were lower or absent under IR. Total accumulated biomass at maturity, the number of spikes/m2 and TGW showed negative correlations with δ 13C especially when measured in flag leaves and mature grain under RF conditions, but only in the mature grain for IR. This suggests that lower TE occurred under both water conditions and that it enhanced the performance of these yield components. Under both water treatments, a larger use of water (although with less efficiency) enhanced dry matter accumulation through better photosynthetic performance (Blum Reference Blum2009). In addition, tillering capacity (assessed through spikes/m2) was not affected by differences in TE at the vegetative stage, whereas the filling and sink strength (Reynolds et al. Reference Reynolds, Condon, Rebetzke, Richards, Fischer, Turner, Angus, McIntyre, Robertson, Borrell and Lloyd2004) of spikes and their previously formed grains were more dependent on the maintenance of transpiration by the flag leaf under RF than under IR, which finally improved the individual grain weight.
For Mediterranean environments, Δ13C (particularly when measured in mature grains) is often positively correlated with GY (Araus et al. Reference Araus, Amaro, Casadesús, Asbati and Nachit1998, Reference Araus, Villegas, Aparicio, García Del Moral, El Hani, Rharrabti, Ferrio and Royo2003; Villegas et al. Reference Villegas, Aparicio, Nachit, Araus and Royo2000; Condon et al. Reference Condon, Richards, Rebetzke and Farquhar2004), but Δ13C in the flag leaf blade is also correlated with GY (Araus et al. Reference Araus, Amaro, Casadesús, Asbati and Nachit1998; Merah et al. Reference Merah, Monneveux and Deléens2001b). One of the reasons for this positive relationship is that a genotype exhibiting higher Δ13C shows greater capacity to maintain a better water status and thus more open stomata (see Araus et al. Reference Araus, Slafer, Reynolds and Royo2002; Condon et al. Reference Condon, Richards, Rebetzke and Farquhar2004) through most of the growth cycle. Blum (Reference Blum2009) has recently established that Δ13C is in fact an expression of the effective use of water (EUW) by the crop instead of the overall WUE. He also discusses that it is not a coincidence that EUW is an inverse acronym of WUE because very often high WUE is achieved at the expense of EUW.
The present work shows similar relationships to those reported by Ferrio et al. (Reference Ferrio, Mateo, Bort, Abdalla, Voltas and Araus2007) in wheat, between GY and δ 13C (negative) and between GY and δ 18O (positive, but significant only under IR). Although Ferrio et al. (Reference Ferrio, Mateo, Bort, Abdalla, Voltas and Araus2007) reported relatively poor correlations between δ 13C and δ 18O, these parameters were not correlated at all in the current work. This would mean that the source of variation of GY related to δ 13C is different and independent from the variation of GY related to δ 18O. Following the model discussed by Ferrio et al. (Reference Ferrio, Mateo, Bort, Abdalla, Voltas and Araus2007), the effect of evaporative demand or stomatal conductance is much more important under IR than under the RF conditions reported in the present paper. It is still unclear whether organic material formed in the leaf reflects either enrichment of water at the sites of evaporation within the leaf or the measured enrichment of leaf water as a whole (Barbour et al. Reference Barbour, Fischer, Sayre and Farquhar2000a). Cernusak et al. (Reference Cernusak, Wong and Farquhar2003) also found that enrichment of lamina leaf water was associated with primary veins compared with source water (i.e. there is a fractionation effect prior to evaporation in the leaf), and depleted compared with evaporative site water. In addition, water exported in phloem sap from photosynthesizing leaves was enriched compared with source water (Cernusak et al. Reference Cernusak, Wong and Farquhar2003). This might explain the lack of a consistent relationship between δ 18O and GY as well as its low heritability compared, for example, with δ 13C, in addition to the effects of retranslocation of assimilates reported by Condon (Reference Condon2012).
The δ 13C of mature grain was always the first parameter that appeared in multiple stepwise linear regressions explaining the variation in GY in terms of a number of secondary traits. If the biomasses accumulated at different stages were removed from the model, the second parameter selected after δ 13C was the δ 15N of mature grain. However, when the biomass was included, the second choice parameter was N concentration in mature grains under RF, and the biomass at maturity under IR. Both δ 15N and N concentration for RF, and δ 15N and biomass at maturity for IR, accounted for the same amount of variation in GY. What is remarkable is that both pairs describe different sources of variation, since one does not reject the other, and together with δ 13C they account for >0·31 of GY variation under RF and >0·35 under IR.
The δ 15N always appeared in the stepwise models with a negative sign, which indicates that the more stressed genotypes were those showing a higher GY, in agreement with observations reported here for δ 13C (less negative meaning more stressed). Robinson et al. (Reference Robinson, Handley, Scrimgeour, Gordon, Forster and Ellis2000) found similar relationships and concluded that the most productive and stress tolerant genotypes were those that probably retained most N, and therefore, they had the lowest plant δ 15N. Conversely, genotypes expressing the least discrimination against 15N grew less and contained less N. In the present work, the relationship between δ 15N and N concentration was not significant in mature grain.
The δ 18O measured in mature grain appeared in the stepwise models only under IR conditions, but as a later choice, and this might indicate differential rates of assimilate remobilization to the filling grain between the two treatments (Condon Reference Condon2012). Alternatively, it might be related to the fact that a wetter environment may be better for the expression/regulation of genotypic differences in stomatal conductance and/or temperature regulation between genotypes (Barbour et al. Reference Barbour, Fischer, Sayre and Farquhar2000a; Araus et al. Reference Araus, Villegas, Aparicio, García Del Moral, El Hani, Rharrabti, Ferrio and Royo2003).
Finally, differences in early vigour (assessed as biomass at 3L or 6L) were not related to any yield component (not even total number of grains) or to the final GY. Several authors have discussed the apparent discrepancies between early vigour and final performance of the crop. Botwright et al. (Reference Botwright, Condon, Rebetzke and Richards2002) concluded that there was potential to increase the yield of wheat by selecting for greater early vigour in a wheat breeding programme, and that the expression of vigour in field conditions and the translation of this improvement to higher yields were, however, dependent on the environment. Moreover, as discussed by Bort et al. (Reference Bort, Araus, Hazzam, Grando and Ceccarelli1998) for barley, the comparison of some parameters such as the performance of seedlings (affected by low temperatures) and GY (affected by terminal drought and higher temperatures), which are far apart in terms of the phenology of the crop, may explain the lack of a higher effect on GY of any parameter measured in the early stages of the crop.
In conclusion, it appears that selection for δ 13C will continue to be controversial because the direction in which selection is needed still depends on the environmental conditions where the crop will grow. Selecting for lower (more negative) δ 13C at different growth stages seems quite useful to identify genotypes exhibiting improved final grain yield, especially under mild water limiting conditions, but it does not have the same impact under well-watered conditions. On the other hand, the use of δ 13C to select for higher early vigour only seems of interest under certain conditions such as good water supply. In addition, δ 15N also adds further advantages in selection for grain yield. Regarding δ 18O, it does not appear, at least for the mild water stress conditions of the present experiment, a suitable trait for breeding. In fact, although δ 18O was already proposed as a target for selection more than a decade ago, relatively few papers have been published that discuss this further. Finally, the use of early vigour traits seems useful for managing water resources in the soil by increasing the potential for later growth but it does not impact directly on the final GY of wheat.
This study was supported by a workpackage of the European Commission research project TRITIMED (INCO-CT-2004-509136). It was also partially supported by the European research project OPTIWHEAT (INCO STREP no. 015460) and by the Spanish Ministry of Science and Technology project, AGL200913539-C02-01 (subprograma AGR).