Introduction
Paediatric hypertension (HT) is defined as having three elevated systolic or diastolic blood pressure (BP) readings for the subject’s age and sex. Reference Flynn, Kaelber, Baker-Smith, Blowey, Carroll and Daniels1 The incidence of paediatric HT is increasing worldwide. It has become a serious health problem worldwide due to changes in lifestyle and nutrition and rising obesity. It has become the most important problem of adolescence. It is known that HT begins in childhood and adolescence and contributes to the early development of cardiovascular diseases (CVD). Although there are studies in the literature showing that identifying and initially treating children with HT has a significant impact on long-term cardiovascular outcomes that differ from adults, there is insufficient information about future cardiovascular and cerebrovascular outcomes for children with uncontrolled HT. Reference Haseler and Sinha2 Studies in childhood include clinical studies that demonstrate cardiovascular structural and functional changes, as well as autopsy studies that show an association with atherosclerotic changes. Studies in childhood have shown that children with primary HT are more likely to develop HT in adulthood, and clinical studies in adults have shown that antihypertensive therapy reduces cardiovascular morbidity and mortality. Reference Flynn, Kaelber, Baker-Smith, Blowey, Carroll and Daniels1 In other words, childhood HT is generally a reversible clinical condition if treated appropriately. As a result, despite different guidelines for defining HT, the pathophysiology and optimal treatment to improve adverse outcomes have not yet been fully elucidated. However, there is still consensus that early diagnosis and prompt management, including lifestyle changes and antihypertensive medications, are essential to prevent end-organ damage. Reference Haseler and Sinha2 The 2017 Clinical Practice Guideline for Screening and Management of High Blood Pressure in Children and Adolescents provided updated recommendations for the workup and diagnosis of paediatric HT. Reference Flynn, Kaelber, Baker-Smith, Blowey, Carroll and Daniels1
Left ventricular hypertrophy (LVH) is the most prominent manifestation of end-organ damage caused by HT. LVH is associated with adverse CVD outcomes, and a large number of children and adolescents with HT have LVH. Reference Brady, Fivush, Flynn and Parekh3 Echocardiography (ECHO) has an important place in cardiac imaging because it is noninvasive and diagnostic. In addition to being diagnostic, ECHO is the most commonly used method for monitoring patients. Reference Shenasa and Shenasa4 Echocardiography is the recommended method for detecting LVH due to paediatric HT. The 2017 American Academy of Paediatrics (AAP) hypertension guidelines recommend cardiac evaluation with ECHO to demonstrate and assess end-organ damage when pharmacologic therapy is planned to be initiated. Reference Flynn, Kaelber, Baker-Smith, Blowey, Carroll and Daniels1 Patients with HT should have regular cardiac evaluations, particularly including left ventricular (LV) function. Reference Shenasa and Shenasa4 While ECHO evaluation is recommended every 12 months in patients without LVH, regular check-ups every 6 months are recommended in cases with LVH. Reference Flynn, Kaelber, Baker-Smith, Blowey, Carroll and Daniels1
LVH poses a risk for the development of heart failure, dysrhythmia, and sudden death. One of the key pathophysiological components of LVH is the concomitant development of myocardial fibrosis. Reference Đorđević, Koračević, Đorđević and Lović5 Epicardial adipose tissue (EAT) is located in the epicardium. Reference Ouwens, Sell, Greulich and Eckel6 Paediatric patients have a long life expectancy. Therefore, since EAT is an early indicator of atherosclerosis and CVD, it can be used as a prognostic marker in the routine follow-up of paediatric HT patients to prevent both morbidity and mortality. The primary aim of our study was to determine the ability of EAT measurements, which can be considered as early imaging markers for cardiac involvement in children with HT, to distinguish them from healthy children. In addition, the secondary aim was to determine the prognostic value of EAT measurements for treatment success by comparing EAT and left ventricular mass measurements before and at 6 months of HT treatment with enalapril.
Methods
This study is a diagnostic accuracy study conducted to determine the discrimination of EAT measurements in terms of cardiac involvement and treatment efficacy in HT and to investigate its usability as an imaging marker.
The study included patients with a primary diagnosis of HT in our Paediatric Nephrology Clinic between January 2023 and June 2024, between the ages of 0 and 18, who received pharmacological treatment, had LVH, and underwent cardiological evaluation twice for at least 6 months. Children who applied to the paediatric cardiology clinic with complaints of a murmur and sports-related discomfort, who had no underlying diseases, and whose echocardiography was completely standard were included in the control group. The mean blood pressure of all children in the control group, who were considered healthy, was below the 90th percentile in 3 consecutive measurements, and echocardiography and simultaneous electrocardiography findings were normal. All cases were evaluated with transthoracic ECHO. ECHO was performed once in the healthy group. In the HT group, ECHO was performed during cardiac prospective evaluation. Patients who had started treatment and had their blood pressure regulated were re-evaluated with ECHO at 6 months. A total of 59 HT children with EAT measurements were compared with 76 healthy children. Echocardiographic measurements of 59 HT children with EAt, LVmass, and cardiac measurements and 32 healthy children were compared separately for cardiac effect differentiation. Lvmass and EAT measurements were compared before and after treatment to evaluate HT treatment response. The outcome variable for differentiation from healthy children was the presence of HT. Age and gender were controlled and analysed. The outcome variable for evaluating treatment response was repeated measurement values. This study was approved by the Clinical Research Ethics Committee of Bakırçay University Çiğli Training and Research Hospital (decision no: 4.10.2023 / 1225 /1025).
Hypertension assessment
During routine healthy child check-ups, cases diagnosed with hypertension or presenting with symptoms such as headache and nosebleed were referred to the paediatric nephrology clinic due to hypertension and evaluated with 24-hour ambulatory blood pressure monitoring (ABPM). ABPM was used in diagnosis. Simultaneously, renal function tests, fasting blood sugar levels, lipid profiles, inflammation parameters, and urine test evaluations were performed to assess metabolic syndrome and other possible accompanying pathologies. Simultaneously, renal Doppler was performed in all cases for treatment initiation, renal evaluation, and vascular evaluation. In addition, proteinuria evaluation in urine, hypertensive retinopathy evaluation in the eye, and cardiological examination were performed to evaluate end-organ damage. It was planned to include cases in which no pathology was detected in renal Doppler in the study.
Electrocardiographic assessment
To evaluate all healthy children who applied to the cardiology outpatient clinic, electrocardiography (ECG) was performed on all children in the group to check for LVH. LVH evaluation was performed according to the Sokolov-Lyon Criteria. Reference Antikainen, Grodzicki and Palmer7
Echocardiographic assessment
All patients underwent a complete ECHO examination, including EAT measurement. The same paediatric cardiologist performed the ECHO examinations using a Philips Cardiovascular Ultrasound System (model Affinity 50, Philips Medical Systems, The Netherlands) and an S4-2 probe. Conventional ECHO measurements were made with M-mode echocardiography, interventricular septal thickness (IVSd), LV dimensions (LVDd), LVmass, and LV posterior wall thickness (LVPWd). The ejection fraction (EF) was calculated by standard methods. Reference Lopez, Colan and Frommelt8 Calculations were made with standard methods using IVS, LVed, LVes, and LVpw thicknesses obtained from M-mode measurements on transthoracic ECHO.
Epicardial adipose tissue evaluation
EAT thickness was measured perpendicular to the free wall of the right ventricle at the end of the diastole. EAT was visualised in the parasternal long and short axis view between the right ventricular free wall. These measurements were made three times on the short axis and three times on the long axis. Reference Ouwens, Sell, Greulich and Eckel6 Since EAT measurements can be affected by the age variable, EAT measurements were compared in a cured and age-corrected manner.
Statistical analyses
The distribution characteristics of continuous-numeric data were analysed by the Kolmogrov-Smirnov test, presented as median (IQR) values in hypertensive-healthy groups since the normal distribution condition was not met, and compared by the nonparametric Mann–Whitney U test. Pre- and post-treatment EAT 1 and 2 and Lvmass measurements were compared with the nonparametric Wilcoxon test. In imaging marker analysis, the statistical significance of the ROC curve and area under the curve were evaluated. All statistical analyses were performed with SPSS 29.0 statistical software; p < 0.05 was accepted as the limit of statistical significance.
Results
Comparison of HT (n:59) and healthy (n:76) children with EAT measurements
The mean age of 59 children with hypertension was 199 months, and 61% were male; the mean age of 76 healthy children was 168 months, and 46% were male. The body mass index (BMI) of the patient group was calculated as 27.9 ± 2.3 kg/m2. In the patient group, 13 children had a BMI of 90p or below, 21 patients scored between 90 and 95p, and 25 patients scored over 95p. 25 of our patients were evaluated as obese. In the healthy group, the BMI of all cases was below 95p, i.e., none of the controls were obese. While gender distributions were similar (p:0.084), the ages of children with HT were statistically significantly higher (p < 0.001). All cases were evaluated for metabolic syndrome. No patient had high fasting blood sugar, and six patients had hyperinsulinemia. However, they were not receiving any medical treatment other than diet. When 59 patients were evaluated, LDL was high in 25 patients and normal in 34 patients, HDL was low in 26 patients and normal in 33 patients, triglyceride was high in 39 patients and normal in 20 patients, and total cholesterol was high in 34 patients and normal in 25 patients. In this hypertension group, the level of C-reactive protein (CRP), measured as an inflammation parameter, was 5.5 ± 1.3 mg/L (normal: 5 Mg/L), and the erythrocyte sedimentation rate (ESR) was 16.3 ± 3.4 mm/h. Both the patient group and the healthy group underwent electrocardiographic evaluation during routine cardiac evaluation. All children’s ECGs were in sinus rhythm, and no signs of ventricular hypertrophy were detected. LVmass was found to be significantly higher in the hypertensive children compared to the healthy group. While the mean values of EAT 1 and 2 were 2.4 and 2.1 in children with HT, they were 1.9 and 1.8 in healthy children. Both cured and age-corrected values of EAT 1-2 were found to be statistically significantly higher in children with HT. The ability of EAT1-2 measurement values of children with HT to distinguish them from healthy children (treated and age-corrected) was evaluated by ROC curve and statistics. The ROC curve and AUCs are presented in Figure 1.
ROC curves for EAT 1-2 and EAT1-2 age adjusted (n:59/76).

The treated values and age-adjusted predictive values of EAT1 and 2 statistically significantly distinguished the healthy and HT groups (pAUC < 0.001; 4 ROC curves, Figure 1). Evidence that they can be imaging markers was obtained with the predicted AUC values.
Comparison of HT (n:59) and healthy (n:32) children with EAT and other echocardiographic measurements
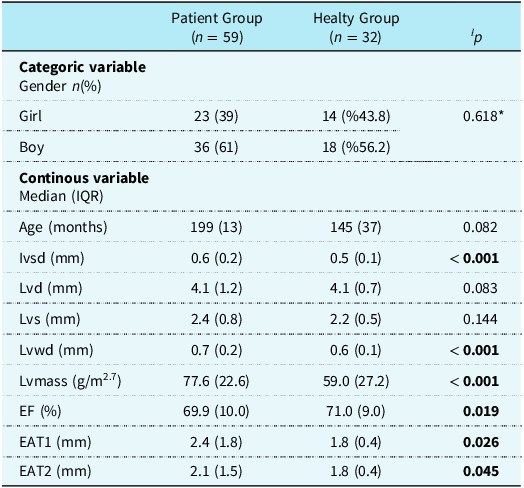
Before starting treatment, echocardiographic measurements of 59 hypertensive children were compared with those of 32 healthy children with the same parameters. The age and gender distributions of these two groups were similar (p-value: 0.618 and 0.082, respectively), so adjustment for confounding factors is unnecessary. Table 1 presents the echocardiographic comparisons.
Comparison of HT and healthy groups with all ECHO measurements

ƚ p: Mann Whitney U test: two independent samples nonparametric comparison test.
* Ki-kare.
The gender and age distributions of children with HT (n: 59) and healthy children (n: 32) with all ECHO measurement data were found to be similar (p = 0.618 and p = 0.082, respectively). Since the basic confounding factors were found to be similar, ECHO measurements were compared using the univariate Mann–Whitney U test. While Ivsd, Lvwd, Lvmass, EAT1, and EAT2 values were found to be statistically significantly higher in children with HT compared to healthy children, EF values were found to be significantly lower (Table 1). The ROC curve and statistics of the two groups with EAT1 and EAT2 (n: 59/32) are presented in Figure 2.
ROC curves of EAT1-2 values for HT and healthy group (n: 59/32).

In this subgroup, EAT1 and 2 measurements (n: 59/32) were shown to be able to distinguish between HT and healthy groups with ROC curves and statistics. The area under the curve of both measurements was statistically significant (AUCEAT1: 0.677, pAUC_EAT1: 0.035 and AUCEAT2: 0.666, pAUC_EAT2: 0.035) (Figure 2). The distinction of ECHO measurements excluding EAT measurements of these two groups is shown in Figure 3 (a–b).
( a ) Ivsd-Lvwd-Lvmass ROC curves (values are high in HT). ( b ) EFROC curve (values are high in HT).

Ivsd, Lvwd, Lvmass, and EF values measured by echocardiography are distinctive for HT (n:59) and healthy (n:32) groups. High values of Ivsd, Lwvd, and Lvmass measurements (pAUC < 0.001) and low values of EF (pAUC-EF = 0.019) are distinctive for the HT group. EAT1 and EAT2 measurements are early markers for the cardiac effects of HT.
Comparison of EAT1, EAT2, and lvmass values before and after treatment in children with HT
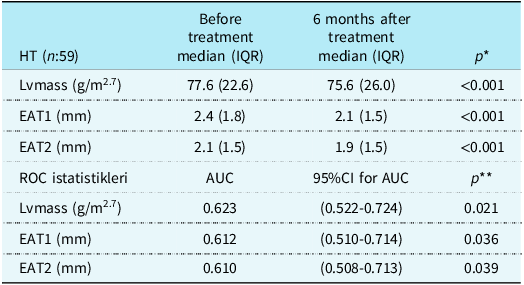
Children with HT were treated with angiotensin-converting enzyme inhibitors (ACE inhibitors) by a paediatric nephrologist for 6 months and followed up and evaluated by a paediatric cardiologist as recommended. All patients had left ventricular hypertrophy. In other words, all patients had cardiac involvement. When evaluated in terms of other end-organ damage, only eight patients had ocular involvement, and all were classified as Stage I. No patient had kidney involvement. Due to enalapril’s renoprotective and cardioprotective properties, all patients were taking the drug at appropriate doses. Reference Atyia, Addein, El-Rifaey and Abd Elnabi9,Reference Singh, Meshram and Tiwari10 All patients were initially started on oral enapril at 0.08 mg/kg/day, and at the end of the first month, 47 of the patients whose blood pressure fell below 90p were using 0.1 mg/kg/day, 9 were using 0.2 mg/kg/day, and the remaining 3 were using 0.3 mg/kg/day. Comparison of Lvmass, EAT1, and EAT2 measurements before and after 6 months of treatment and discrimination statistics with the ROC curve are shown in Table 2. In our study, a statistically significant difference was observed between EYD1 and EYD2 in the pre- and post-treatment evaluations of children with HT. However, when this difference was evaluated according to BMI (those with a BMI of 95p and above and those with a BMI of 95p or below), it was determined that BMI had no effect (p EYD1-2 < 0.001 ; p BMI = 0.067).
EAT1, EAT2, lvmass values, and ROC statistics of children with HT before and after treatment

*wilcoxon test: nonparametric comparison test of paired samples.
**pAUC.
The difference between pre-treatment and post-treatment values of Lvmass, EAT1, and EAT2 was found to be statistically significant, and these values decreased significantly after treatment. EAT1, EAT2, and Lvmass measurements distinguished pre-treatment and post-treatment groups with ROC curve statistics. Based on all these findings, evidence was obtained that treatment response can be evaluated with echocardiographic markers (Table 2, all pAUC < 0.05).
Discussion
Primary HT is an epigenetic disease and cannot be explained by a single cause. LVH and early remodelling are crucial compensatory processes that develop over time in response to increased wall stress or significant changes in haemodynamic pressure or volumetric load. However, they are ultimately the result of an abnormal increase in left ventricular myocardial mass induced by chronic high workload on the heart muscle. Reference Đorđević, Koračević, Đorđević and Lović5 For children ≥ 8 to 18 years of age, LVH is defined as LV mass > 51 g/m2.7. For children < 8 years of age, LVH is defined as LV mass > 115 g/body surface area (BSA) for males and LV mass > 95 g/BSA for females. Reference Flynn, Kaelber, Baker-Smith, Blowey, Carroll and Daniels1 It secretes anti-atherogenic, pro-atherogenic, and pro-inflammatory cytokines. Therefore, it has both endocrine and inflammatory functions. Just like in the LVH mechanism, although it is primarily cardioprotective with the substances it secretes, it acts as a trigger of myocardial fibrosis with increased inflammation. Although EAT is cardioprotective, its increased thickness is considered an indicator of atherosclerosis and CVD. Reference Ouwens, Sell, Greulich and Eckel6 In addition, whether EAT is a cause or a result of HT has not yet been clarified. While EAT increases with cardiovascular stress, cardiovascular stress increases due to proinflammatory cytokines secreted by the rise in EAT. Reference Schweighofer, Rupreht, Marčun Varda, Caf, Povalej Bržan and Kanič11 Although EAT is metabolically and mechanically protective for the cardiovascular system, it has a negative effect when its thickness increases in several pathological conditions. In addition to its systemic effects, EAT can paracrinely affect the myocardium and coronary arteries with many pro-inflammatory and anti-atherogenic molecules. EAT cells secrete many active molecules such as TNF-α, monocyte chemotactic protein-1, resistin, IL-6, IL-8, and IL-1b, leading to systemic and paracrine inflammation. Reference Iacobellis and Bianco12 With these molecules, EAT essentially provides nutrients to the heart and protects the myocardium from hypothermia. Due to the effect of these molecules, it is known that EAT is more active than white adipose tissue in terms of lipolysis and free fatty acid (FFA) release. In other words, the capacity to release FFA into the circulation increases, and glucose consumption decreases. Reference Zhang, Wang and Liu13 It changes the bioavailability of adipokines. In particular, FFAs and adipokines directly enter the vasa vasorum, affecting the vascular wall and changing its tone. As a result of all this, it leads to fat cell hypertrophy, tissue hypoxia, inflammation, and oxidative stress. Reference Bodenstab, Varghese and Iacobellis14
In our study, in which we aimed to distinguish EAT measurements as an early imaging marker of cardiac involvement in HT children from healthy children and to determine the predictive feature of HT treatment response, patients were evaluated under 3 main headings. The first is to compare the EAT measurements of 59 HT children at the time of admission with the EAT measurements of 76 healthy children; the second is to compare the EAT and other cardiac parameters of 59 HT children at the time of admission with those of 32 healthy children; and the third is to compare the EAT and Lvmass measurements evaluated in the patient group at the time of admission and at the 6th month of enalapril treatment.
Although numerous studies evaluate and confirm the relationship between HT and EAT in adults, there are fewer studies in the childhood literature. Reference Schweighofer, Rupreht, Marčun Varda, Caf, Povalej Bržan and Kanič11 There is no globally accepted value for EAT yet. Since it is affected by many factors, studies usually obtain results by comparing them with healthy individuals. Reference Gokdeniz, Turan and Aykan15,Reference Pyorala, De Backer, Graham, Poole-Wilson and Wood16 Studies on healthy and HT groups have shown that arterial stiffness and EAT increase in HT cases compared to healthy groups. Reference Dicker, Atar, Kornowski and Bachar17 In a study conducted by Dicker et al., it was observed that EAT thickness increased in HT individuals compared to normotensive individuals. Reference Dicker, Atar, Kornowski and Bachar17 In a study comparing prehypertensive and normotensive patients, local systolic dysfunction and EAT were shown to be significantly increased in prehypertensive patients. Reference Turak, Ozcan, Canpolat, Mendi, Oksuz and Ozeke18 There are studies in the literature showing that increases in systolic and diastolic blood pressure are associated with increases in EAT. Reference Pierdomenico, Pierdomenico, Cuccurullo and Iacobellis19,Reference Eroglu, Sade, Yıldırır, Demir and Muderrisoglu20 In the study by Elshorbagy et al., in which they evaluated 60 obese children with metabolic syndrome and 25 healthy children, a significant relationship was found between high blood pressure and EAT. Reference Elshorbagy, Fouda, Kamal, Bassiouny and Fathi21 In another study, evaluating 25 obese, 8 overweight, and 15 normal-weight children, a correlation was found between EAT and blood pressure. Reference Van Hoek, Koopman, Feskens and Janse22 A study comparing 36 HT children with 36 healthy children showed a significant association between essential HT and EAT in non-obese children, suggesting a potential role for EAT in the development of hypertension. Reference Atyia, Addein, El-Rifaey and Abd Elnabi9 Our study observed a statistically significant difference in EAT1 and EAT2 in current measurements and age-corrected values, regardless of all parameters, between 76 healthy children and 59 children diagnosed with HT. As a result of the statistics obtained, we think that it may be an imaging biomarker.
Hypertension is a process that begins in childhood and continues until advanced age. Changes in the heart and cardiovascular system continue throughout life. In particular, increased left ventricular mass index and diastolic dysfunction are the most common changes associated with HT. Reference Iacobellis23 A meta-analysis of 19 studies by Mancino et al. showed that EAT thickness was associated with left ventricular hypertrophy and diastolic dysfunction and independently with body mass index. Reference Mancio, Azevedo and Fragao-Marques24 Studies show that increased EAT accompanies increased left ventricular mass. Reference Corradi, Maestri and Callegari25 Brown adipose tissue decreases with age. However, due to adverse cardiac effects, it increases in thickness before ageing, that is, from the neonatal period to adulthood. Reference Elshorbagy, Fouda, Kamal, Bassiouny and Fathi21 This thickening of the EAT can be used as an imaging marker and clinical monitoring tool. Reference Iacobellis26 In a different study, EAT volume was shown to be associated with elevation of systolic and diastolic blood pressure and a marker of diastolic dysfunction by cardiac imaging. Reference Sousa, Mendonça and Serrão27 In a study evaluating the cardiovascular effects in 228 children aged 6-16, it was found that EAT values were affected by BMI and blood pressure; BMI was determined to be more significant in logistic regression analysis. Reference Blancas Sánchez, Aristizábal-Duque and Fernández Cabeza28 In a study evaluating 1165 obese children, it was shown that there was a serious interaction between obesity and cardiac effects, and it was determined that EAT increased as BMI increased. Reference Luca, Curpan and Braha29 In a study comparing 430 obese and 150 healthy children, a relationship was found between obesity, high blood pressure, and EAT, and it was shown that each should be considered as a risk factor for cardiac involvement. Reference Alp, Karaarslan, Eklioğlu, Atabek and Baysal30 When all cardiac measurements and EAT values of 59 hypertensive and 32 healthy children were compared, Ivsd, Lvwd, Lvmass, EAT1, and EAT2 were significantly higher in the patient group (p = < 0.001, < 0.001, < 0.001, 0.026, 0.045, respectively). At the same time, EF was lower in the patient group (p = 0.019). In summary, we believe that cardiac measurements and increased EAT in the patient group compared to the healthy group are associated with cardiac involvement and can be used as a marker for HT. In our study, unlike the literature, EAT was shown to be associated with blood pressure independently of BMI.
In our study, the hypertensive group showed a significant increase in EAT1, EAT2, and Lvmass values compared to the healthy group regarding left ventricular hypertrophy, the most common finding in the literature. Cardiac evaluation is recommended every 6 months from the beginning of treatment in patients with cardiac involvement. Reference Flynn, Kaelber, Baker-Smith, Blowey, Carroll and Daniels1 EAT is known to be associated with left ventricular mass index and diastolic dysfunction, and as EAT decreases, the risk of cardiovascular disease decreases. Reference Elshorbagy, Fouda, Kamal, Bassiouny and Fathi21 A study in children showed that lifestyle changes decreased EAT thickness and reduced the risk of cardiovascular disease, as reflected in cardiac imaging. Reference Calcaterra, Cena and Garella31 Suppressing the cytokines secreted by EAT can control blood pressure and reduce the risk of cardiovascular disease. Many drugs are being tested and used in this regard, and studies are ongoing. Reference Iacobellis23 SGLT2 and GLPA-1 are drugs studied recently and are particularly effective on adipokines. Reference Iacobellis, Camarena, Sant and Wang32,Reference Dozio, Vianello and Malavazos33 Enalapril has been shown to affect adipokines secreted by EAT. A study in 120 nonobese hypertensive adults showed a reduction in EAT and reduced cardiovascular risk in the group where pressure regulation was achieved using enalapril. Reference Jumaah, Fathi and Mohammad34 A study conducted on rats stated that inhibiting the renin–angiotensin system in rats fed high doses of salt improved renal and cardiac findings. Reference Siddiqui, Pitpitan, Boychev, Komnenov and Rossi35 In another study, blocking the angiotensin AT2 receptor reduced cardiac inflammation and fibrosis. Reference Kaschina, Lauer, Lange and Unger36,Reference Ferrario37 In our study, 59 patients were evaluated using the appropriate dose of ACE inhibitor enalapril. All patients had left ventricular hypertrophy. Patients were closely monitored for blood pressure regulation during the first month. Cases were evaluated with home blood pressure measurements. Blood pressures were regulated in all cases by the end of the first month. All cases underwent cardiac evaluation in the 6th month. In the evaluation made in the sixth month, a regression was detected in Lvmass, EAT1, and EAT2 measurements compared to pre-treatment, and a statistically significant difference was detected.
Conclusion
This study has again shown that EAT can be used as an imaging marker in the diagnosis and follow-up of patients because it is a noninvasive method. In addition to its use in adults, it is also essential for childhood. It is also known that EAT is affected by many factors. The left ventricular mass index and blood pressure regulation of patients treated with enalapril decreased, and we believe that enalapril also contributed to the decrease in EAT. Future studies with larger samples must confirm these results and understand the underlying mechanisms.
Competing interests
The authors declare no conflict of interest.