Implications
Effects of standardized milk yield, live weight and stage of lactation on voluntary feed intake of dairy cows were determined based on data from 14 experiments. Effects of forage quality and amount and composition of concentrates on intake have been modelled previously. The current model separates animal and diet effects on intake so that intake can be predicted precisely and accurately using parameters available at the time of feeding. The model will improve current ration formulation systems by enabling the prediction of actual intake and intake responses, which are prerequisites for any economical model in optimizing milk production in various farming systems.
Introduction
Accurate prediction of dry matter intake (DMI) is important for the formulation of economical dairy cow diets. Regulation of feed intake in ruminants involves multiple mechanisms related to dietary and animal factors that are poorly understood (Mertens, Reference Mertens1994). Despite extensive research efforts over the past 30 to 40 years, no intake model that can be used generally has been developed. Limited success in this field is at least partly due to complicated interactions between the animal and feed characteristics, and difficulties in distinguishing and quantifying these factors. Many intake models use milk yield (MY) as an input variable (Vadiveloo and Holmes, Reference Vadiveloo and Holmes1979; Dulphy et al., Reference Dulphy, Faverdin and Jarrige1989; National Research Council (NRC), 2001; Keady et al., Reference Keady, Mayne, Offer and Thomas2004a), but the usefulness of such models in ration formulation may be questioned, as the final output (MY) is used to predict input (feed intake). These models are primarily useful in predicting intake required to sustain a given level of MY, as stated by Keady et al. (Reference Keady, Mayne and Kilpatrick2004b). It should be remembered that MY is not known at the time of prediction (Ingvartsen, Reference Ingvartsen1994).
Observed MY is a function of a cow's genetic potential, stage of lactation, diet characteristics and management factors. Intake potential of the diet was strongly correlated with observed milk energy output (Huhtanen et al., Reference Huhtanen, Rinne and Nousiainen2008) that can result in biased parameter values for both animal and diet factors in DMI prediction models. To overcome the problems resulting from variation in animal and environmental factors in estimating the effects of feed factors on DMI, we developed a relative silage DMI index (SDMI) using treatment mean data from milk production studies and mixed model regression analysis (Huhtanen et al., Reference Huhtanen, Rinne and Nousiainen2007). The model was extended to also include concentrate factors in predicting total DMI (Huhtanen et al., Reference Huhtanen, Rinne and Nousiainen2008). The model (total diet DMI index (TDMI index)) accurately predicted the differences in DMI within a study (prediction error within study 0.37 kg DM/day). However, to be useful in practical ration formulation, the intake prediction model should also take into account animal factors such as MY potential, live weight (LW) and stage of lactation.
The objective of this study was to develop a DMI prediction model based on TDMI index (Huhtanen et al., Reference Huhtanen, Rinne and Nousiainen2008) by including animal factors in the model. The aim was to estimate the true effects of animal and feed factors on intake by taking these factors into account independently. The model factors were restricted to those that would be available at the time of ration formulation; for example, excluding observed MY and LW change.
Material and methods
Data
A data set based on individual observations from 10 change-over studies (n = 887) and four continuous studies (n = 667) with a total of 1554 observations was used for model development (Appendix 1). The studies included 106 diets. The forages consisted of grass silages differing in chemical composition, digestibility and harvest (primary v. regrowth), and whole-crop silages. The concentrate feeds consisted of cereal grains (barley, oats), fibrous by-products and various protein supplements. Forages and concentrates were fed either separately or as a total mixed ration (TMR). The studies were conducted either in tie stalls or a loose housing system with mainly Finnish Ayrshire and Holstein–Friesian cows. The data before 30 days in milk (DIM) were excluded from the analysis, as the objective was to develop an intake model for established lactation. In change-over trials, one observation was based on the data from the last one or 2 weeks of each experimental period, and continuous trials were divided into 3-week periods. In change-over studies, the experimental design was either complete four-period Latin Squares or cyclic-change-over designs including four periods. The studies were conducted in four different barns (three tie stalls and one loose house), and the diets were fed as TMR (four studies) or forages and concentrates separately.
Another data set based on mean treatment values from 207 dairy cow studies (992 diets) using ad libitum feeding of grass silage, or grass silage partly replaced with legume or whole-crop cereal silages and supplemented with concentrates differing in the amount and composition values was used for model validation. Within each study, the concentrates were fed with the same silage, which was offered ad libitum. More details of the data are described in previous papers (Huhtanen et al., Reference Huhtanen, Rinne and Nousiainen2007 and Reference Huhtanen, Rinne and Nousiainen2008).
Calculations
Relative silage intake potential (Huhtanen et al., Reference Huhtanen, Rinne and Nousiainen2007) is computed as:

where D-value = concentration of digestible organic matter (OM; g/kg DM), TA = total acid (lactic acid + volatile fatty acids) concentration (g/kg DM), DM = DM concentration (g/kg), NDF = NDF concentration (g/kg DM), and a, b and c represent the proportions (0 to 1) of regrowth, legume and whole-crop cereal silages in total silage DM.
The relative effect of concentrate supplementation on intake potential was calculated as described by Huhtanen et al. (Reference Huhtanen, Rinne and Nousiainen2008):
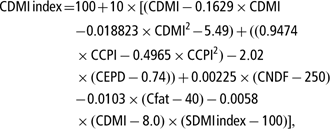
where CDMI = concentrate DMI (kg/day), CCPI = supplementary concentrate CP intake (kg/day; CP >170 g/kg DM), CEPD = concentrate protein degradability (g/g) according to MTT (2006), CNDF = concentrate NDF concentration (g/kg DM) and Cfat = concentrate fat concentration (g/kg DM).
Total diet DMI index was calculated as SDMI index + CDMI index−100. One unit in SDMI, CDMI or TDMI index corresponds to a difference of 0.10 kg/day in DMI as a default value.
On account of differences in the intake potential and nutritive value of the diets, as well as stage of lactation, observed yield does not directly describe the production potential of a cow or a group of cows. Therefore, the observed energy corrected milk yield (ECM) was adjusted to correspond to a standard diet fed at 150 DIM (sECM, standardized ECM yield). The standard diet was defined as a diet with an intake potential of 100 TDMI index points (Huhtanen et al., Reference Huhtanen, Rinne and Nousiainen2008) and 90 g/kg DM metabolizable protein (MP). The ECM yield was calculated using the equation by Sjaunja et al. (Reference Sjaunja, Baevre, Junkkarinen, Pedersen and Setälä1991):

The concentration of MP was calculated according to the Finnish protein value system (Tuori et al., Reference Tuori, Kaustell and Huhtanen1998; MTT, 2006) with minor modifications. Standardized ECM was calculated as:
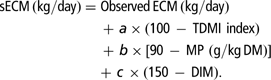
The DIM component (effect of the stage of lactation) in model (4) was estimated using the principles of the Wilmink (Reference Wilmink1987) equation:

Only statistically significant (P < 0.10) parameters of the DIM component of model (5) were included in the model. The parameter values for a, b, c and d (for simplicity, c includes all the components of model (5)) of the model (4) were estimated using a mixed regression model from the individual cow data set as described later in detail. Standardized ECM yield should not be interpreted as a maximal potential yield of the cow, but rather a yield at a fixed stage of lactation when fed a standard diet.
Model comparisons
Four published intake prediction models were evaluated using both individual and treatment mean data sets. Two of the selected models (NRC, 2001; Cornell Net Carbohydrate and Protein System (CNCPS; Fox et al., Reference Fox, Tedeschi, Tylutki, Russell, Van Amburgh, Chase, Pell and Overton2004)) included only animal factors, whereas the other two models (Vadiveloo and Holmes, Reference Vadiveloo and Holmes1979; Lewis, Reference Lewis1981) also included feed factors. The objective was not to conduct a comprehensive model comparison, but rather to evaluate models that differed in the extent to which animal and feed factors were present and to which necessary parameter values were available.
The NRC (2001) model use only animal variables to predict total DMI (TDMI):

where FCM = 4% fat corrected milk (kg/day), LW = live weight (kg) and WL = week of lactation. The exponential term adjusts for reduced intake during early lactation.
The CNCPS (Fox et al., Reference Fox, Tedeschi, Tylutki, Russell, Van Amburgh, Chase, Pell and Overton2004) predicts intake from MY, LW and stage of lactation:

where PMY = month of post-calving when peak milk yield occurred (1, 2 or 3) and P = 2.36 for PMY = 1 and 2, and P = 3.67 for PMY = 3. As the exact date of PMY was not recorded, a default value of 1.5 was used (in the individual cow data set, PMY was attained at 40 DIM). This parameter value (1 or 2) has very little effect on the predicted DMI after 30 DIM. The model also has temperature and mud adjustment factors, but all the studies were conducted in a temperate climate and within experimental dairy barns, and therefore no temperature or mud factors were needed.
In the model by Vadiveloo and Holmes (Reference Vadiveloo and Holmes1979), concentrate intake was included as a diet factor in addition to LW, MY and stage of lactation parameters:

where CDMI = concentrate DMI (kg/day) and MY = milk yield (kg/day).
Lewis (Reference Lewis1981) developed a more complicated model including several silage characteristics and an interaction between silage intake potential and concentrate intake, whereas the model lacks the stage of lactation effects:
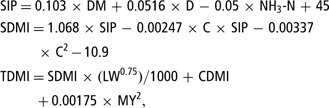
where SIP = silage DMI potential (g/kg LW0.75) when silage is fed as the sole feed, DM = silage DM concentration (g/kg), D = silage concentration of digestible OM (g/kg DM), NH3-N = silage ammonia N concentration (g/kg total N), C = concentrate DMI (g/kg LW0.75) and SDMI = silage DMI (g/kg LW0.75) when silage is fed with concentrates. Models (6) and (7) were developed from data sets using predominantly maize-based rations, whereas models (8) and (9) were developed using mainly European grass silage-based rations.
Unfortunately, the recent comprehensive model by Keady et al. (Reference Keady, Mayne, Offer and Thomas2004a), which included several animal and feed factors and interaction between silage intake potential and concentrate supplementation, could not be evaluated as it included factors (silage intake potential determined by near infrared spectroscopy and body condition score (BCS)) that were not available in the present data set.
Statistical analysis
The following basal MIXED regression model of SAS (Littell et al., Reference Littell, Milliken, Stroup and Wolfinger1996) was used to develop the intake prediction models:

where B 0 + B 1X 1ij + B 2X 2ij + B 3X 3ij are the fixed effects and b 0, b 1 and eij are the random experiment effects (intercept, slope and error), i = number of subjects (cows within study (353), or studies (207)), and j = 1…ni values within a subject. The goodness of fit of the models was evaluated using residual mean square error (RMSE), which was calculated as a square root of the residual variance. Akaike's information criterion was used to evaluate the variance–covariance structure (the smaller the better). Adjusted values were calculated for the figures by adding the residual from each individual observation to the predicted value of the study regression (St-Pierre, Reference St-Pierre2001). The data were also analyzed with simple model regression without random study effect to evaluate the difference in RMSE that can partly be attributed to systematic differences between studies, for example, in the determination of forage D-value, DM concentration and feeding method.
For both sECM yield and total DMI models, all four parameters related to the stage of lactation (Wilmink, Reference Wilmink1987) were first included in the model, but if the parameter was non-significant (P < 0.10) it was excluded from the model. If the exponential term of the Wilmink (Reference Wilmink1987) equation was significant, the value of the coefficient (−0.05) was adjusted until the best fit was obtained according to RMSE adjusted for random study effect.
The DMI model was generated using individual cow data and tested with treatment mean data. In practice, the diets are formulated for groups of cows rather than individual cows, justifying the use of treatment mean data in model evaluation. In the individual cow data set there was a much wider range in DIM within subject (cow (study)) than in treatment mean data (diet (study)), allowing a better estimation of the lactation stage effects on TDMI. Root mean squared prediction error (RMSPE) was calculated as RMSPE = square root (Σ (observed−predicted)2/n). The models were evaluated by regressing residual (observed−predicted) values on the predicted values (St-Pierre, Reference St-Pierre2003). Predicted values were centered by subtracting the mean of all predicted values from each prediction. This makes the slope and intercept estimates in the regression orthogonal, and thus independent. Mean biases were assessed using the intercepts of the regression equations. The slopes of the regression equations were used to determine the presence of linear biases.
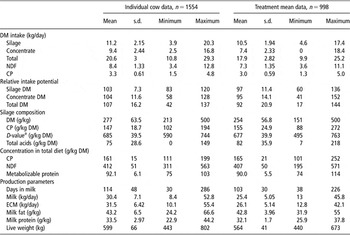
Results
Data
The description of the data based on individual cow observations and treatment mean data used for developing and evaluating intake prediction models, respectively, is shown in Table 1. On average, intake and MY were higher in the individual cow data set. Variation in production parameters was greater in the individual cow data set, but DMI displayed similar variation in both data sets. Both intake potential of silage and TDMI were more variable in the treatment mean data set.
Statistical description of the variables used in the data files for development and validation of feed intake models in dairy cows

DM = dry matter; ECM = energy corrected milk.
aD-value = concentration of digestible organic matter in DM.
sECM yield
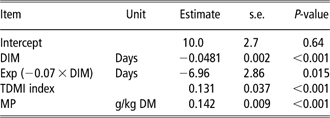
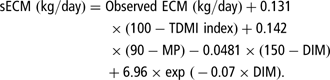
The effects of the stage of lactation, dietary intake potential and MP concentration on ECM yield are shown in Table 2. The model was slightly improved when the coefficient of the exponential DIM parameter that describes the deviation from the linear decline in ECM yield was reduced from −0.05 to −0.07. The following equation was developed from regression coefficients in Table 2 to calculate sECM:
Parameters for predicting ECM yield from the stage of lactation, dietary MP concentration and TDMI index (RMSE adjusted for random cow effect 1.57 kg/day)
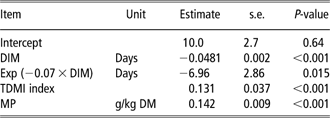
ECM = energy corrected milk; MP = metabolizable protein; TDMI index = total diet dry matter intake index; RMSE = residual mean square error; DIM = days in milk.
The quadratic effect of DIM and the interaction between the DIM and TDMI index were not significant (P = 0.27 and 0.54, respectively) and were therefore excluded from the model. Correlation coefficients between sECM and TDMI index or DIM were much weaker (r = 0.16 and 0.03) than corresponding coefficients with observed ECM (r = 0.65 and 0.46), respectively.
Model development
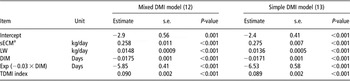
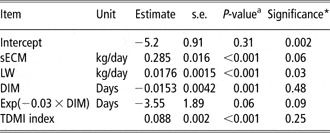
Mixed (12) and simple (13) regression models predicting DMI for individual cow data are shown in Table 3. The parameter values were similar between the models, indicating that the effects of independent variables on DMI were consistent between the studies. The models were slightly improved when −0.03 rather than −0.07 was used as a coefficient for the exponential term of DIM, probably reflecting delayed maximum in feed intake compared with MY. Interaction between sECM and TDMI index was not significant (P = 0.57). Similarly, DIM or LW did not influence observed DMI response to TDMI index (interaction P = 0.32 and 0.80, respectively). Milk protein-to-fat ratio had a strong positive (P < 0.001) effect on DMI, when it was included as an additional independent variable to the mixed model shown in Table 3 (regression coefficient 2.68 ± 0.37). When data for primiparous and multiparous cows were analyzed separately, the total DMI was 0.50 ± 0.056 kg/day lower (P < 0.001) for the first lactation cows compared with the older cows when the effects of other factors (sECM, DIM, LW and TDMI index) were taken into account.
Mixed and simple regression models predicting DMI (kg/day) from the animal characteristics, stage of lactation and intake potential of the diet (n = 1544; adjusted RMSE for mixed model 0.52 kg/day; RMSE of simple model 1.27 kg/day)

DMI = dry matter intake; RMSE = residual mean square error; sECM = standardized ECM yield; LW = live weight; DIM = days in milk; TDMI index = total diet dry matter intake index.
aEstimated using parameters from model (11).
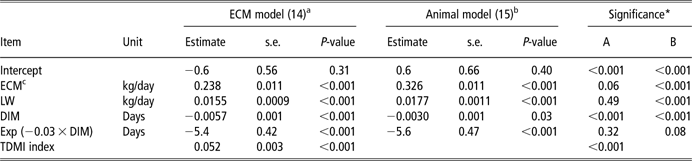
Mixed model regression equations predicting DMI using observed ECM yield (ECM model (14)) rather than standardized yield or only animal-related parameters (15) as independent variables are shown in Table 4. Intercept values increased significantly compared with the mixed DMI model (12). The effect of ECM yield was much greater (0.326 v. 0.258; P < 0.001) in the animal model (15) compared with the mixed DMI model (12). The linear DIM effect was markedly smaller (P < 0.001) in the ECM model (14) and animal model (15) compared with the DMI model (12). The effect of intake potential described as relative TDMI index became much smaller (P < 0.001) when observed rather than sECM yield was used in the prediction model. Although the residual was not greater for model (14) compared with model (12), it should be noted that the data needed for model (14) are only available retrospectively.
Mixed regression models predicting DMI (kg/day) from the animal characteristics and intake potential of the diet or only from animal characteristics (n = 1544; adjusted RMSE 0.52 kg/day (model 14); 0.58 kg/day (model 15))
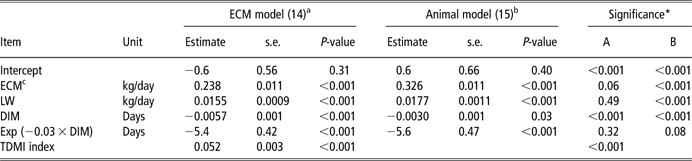
DMI = dry matter intake; RMSE = residual mean square error; ECM = energy corrected milk; LW = live weight; DIM = days in milk; TDMI index = total diet dry matter intake index.
aInstead of sECM observed ECM yield was used.
bNo diet parameters in the model.
cECM = Observed ECM.
*Significance of the difference in parameter values compared with the mixed DMI model (Table 3) (A, model (14) and B, model (15)).
The parameter values of intake model (16) developed from the treatment mean data set are shown in Table 5. sECM yield and LW had greater effects on TDMI when estimated from treatment mean rather than from individual cow data set (model (12)). The effect of diet intake potential did not differ (P = 0.25) between the two data sets. The mean difference between the predictions was small (−0.03 kg/day) and the predictions were strongly correlated (R 2 = 0.998; mean prediction error 0.16 kg/day). Adjusted RMSE decreased from 0.36 to 0.32 when the parameters were estimated directly from treatment mean data set compared with the prediction model developed from the individual cow data set (12). Consistent with the individual cow data set, there was no interaction between sECM and TDMI index (P = 0.49) or DIM and TDMI index (P = 0.39).
Mixed regression model (16) predicting DMI for treatment mean data (n = 992)

DMI = dry matter intake; sECM = standardized ECM yield; LW = live weight; DIM = days in milk; TDMI index = total diet dry matter intake index.
aP-value of parameter estimates.
*Significance of the difference in parameter estimates compared with those estimated from the individual cow data set model (12).
Model evaluation
The treatment mean data set was used to evaluate the mixed (12) and simple model (13) prediction equations developed using the individual data set:
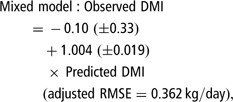
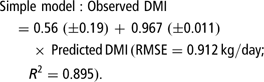
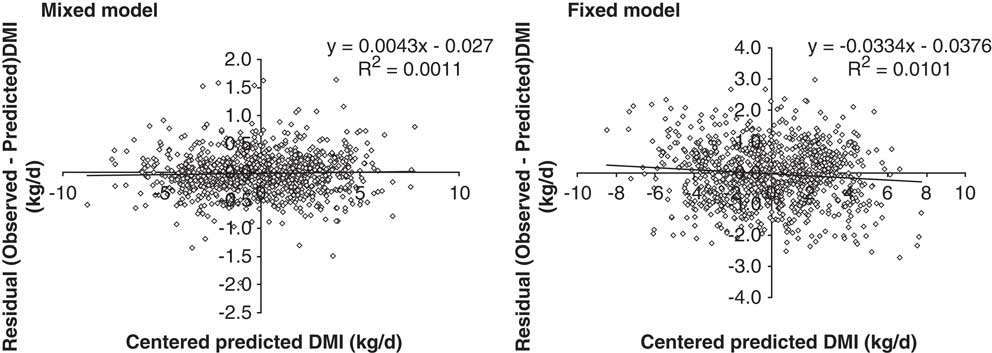
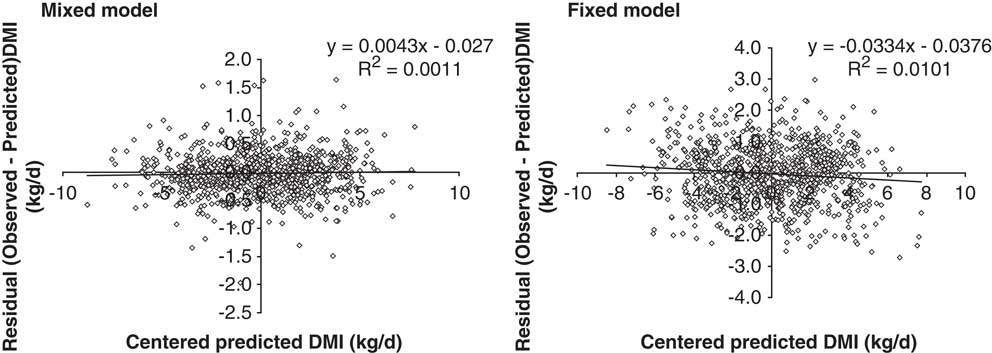
Evaluation of residuals of equation (17) did not result in mean or linear slope (Figure 1). With equation (18) there was no mean bias (P = 0.20), but a numerically small (P < 0.01) linear bias of −0.034 was detected. On account of the minimal mean and slope biases, random error accounted for 99.5% and 99.0% of the residual variance for models (17) and (18), respectively. Residuals of neither mixed (P > 0.41) nor simple (P > 0.14) model predictions were significantly related to TDMI index, observed ECM yield, LW or DIM. In the treatment mean data set, the regression coefficient of milk protein-to-fat ratio was 2.04 (s.e. = 0.45; P < 0.001) when it was included as a second independent variable with predicted DMI (DMI = Predicted DMI + Protein/fat in milk).
Plot of residuals (observed−predicted) v. predicted values of DMI (kg/day). Predicted values were centered by subtracting the mean predicted value from each predicted value; DMI = dry matter intake.
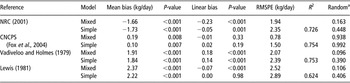
Evaluation of the published models using the individual cow data set is shown in Table 6. The CNCPS (Fox et al., Reference Fox, Tedeschi, Tylutki, Russell, Van Amburgh, Chase, Pell and Overton2004) model resulted in the most accurate (small mean bias) predictions of DMI with both mixed and simple model evaluations. It also had small mean and linear biases. The Vadiveloo and Holmes (Reference Vadiveloo and Holmes1979) model was the most precise (low random error around regression line) in mixed model evaluation (adjusted RMSE = 0.64 kg/day), followed by the CNCPS (0.74 kg/day). The precision of models using FCM as the yield parameter was improved when ECM replaced FCM in the model. The NRC (2001) model clearly over-predicted DMI, whereas the models by Vadiveloo and Holmes (Reference Vadiveloo and Holmes1979) and Lewis (Reference Lewis1981) under-predicted it. The precision of models using only animal variables (NRC, CNCPS) was improved when TDMI index was included in the model as a second independent variable together with model-predicted DMI. Regression coefficients for TDMI index ranged from 0.05 to 0.07 per unit.
Comparison of accuracy and precision of intake prediction models with individual cow data set (n = 1554)

RMSPE=root mean squared prediction error; NRC = National Research Council; CNCPS = Cornell Net Carbohydrate and Protein System.
aProportion of random error of total error variance.
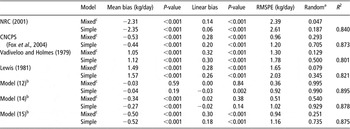
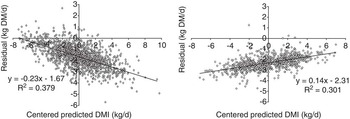
Using the treatment mean data set, our model (12) performed better compared with models (14) and (15), which used observed rather than standardized ECM yield, according to all criteria (RMSPE, mean bias, linear bias) of evaluation (Table 7). The CNCPS model was the most accurate of the four published models. It was also the most precise of the simple models, but the Vadiveloo and Holmes (Reference Vadiveloo and Holmes1979) and Lewis (Reference Lewis1981) models were more precise with mixed model evaluation (adjusted RMSE 0.47 v. 0.52 kg/day). Mean bias (observed−predicted) of DMI was on average 0.67 kg/day smaller in treatment mean data compared with individual cow data. In most cases, linear biases were also markedly different between the two data sets. For example, with the NRC (2001) model, linear bias was −0.23 kg/day with the individual data set and 0.14 kg/day with the treatment mean data set, that is, observed increases were smaller or greater than predicted in the two data sets (Figure 2). A corresponding change in linear bias was also observed when the animal model (15) from the present individual data set was evaluated with treatment mean data. Consistent with the individual cow data set, the precisions of the NRC and CNCPS models were improved by including TDMI index in the model with predicted DMI. Using mixed model regressions, the coefficients were 0.055 (NRC) and 0.052 (CNCPS), respectively.
Comparison of accuracy and precision of intake prediction models with treatment mean data (n = 992)

RMSPE = Root mean squared prediction error; NRC = National Research Council; CNCPS = Cornell Net Carbohydrate and Protein System.
aProportion of random error of total error variance.
bModels predicted from the individual data set.
cAdjusted for the random study effect.
Plot of residuals (observed−predicted) v. predicted (NRC, 2001) values of DMI (kg/day) for the individual cow data (left) and treatment mean data (right). Predicted values were centered by subtracting the mean predicted value from each predicted value; DMI = dry matter intake.

Discussion
Model development and evaluation
Feed intake is the strongest single nutritive factor influencing performance of dairy cows, and therefore much attention has been focused on developing models predicting intake. The published prediction models are usually based on multiple regression equations, and vary in their complexity (see Ingvartsen, Reference Ingvartsen1994). Although many of the models include animal, diet and sometimes management factors, in many cases the models are based entirely on animal factors (e.g. NRC, 2001; Fox et al., Reference Fox, Tedeschi, Tylutki, Russell, Van Amburgh, Chase, Pell and Overton2004) or feed factors predicting relative intake potential of the diet (Huhtanen et al., Reference Huhtanen, Rinne and Nousiainen2008). This study was designed to extend our previous models predicting relative DMI potential of silage and total DMI (Huhtanen et al., Reference Huhtanen, Rinne and Nousiainen2007 and Reference Huhtanen, Rinne and Nousiainen2008) for predicting actual DMI by including animal factors in the model.
The model (12) developed from individual cow data was both accurate and precise when validated using a large treatment mean data set. The model can be considered robust because of (i) a low mean prediction error, (ii) high accuracy and precision in validation (no mean and slope bias, random error >99% of total error), (iii) numerically small differences in the parameter values of model variables when estimated with mixed or simple regression models, and (iv) that the residuals in model validation were not correlated to animal (ECM, LW and DIM) or dietary factors (TDMI index). Our RMSE of 1.27 kg/day (12) compares well with the corresponding values of 1.47 and 1.55 kg/day for primiparous and multiparous cows, respectively, in the study by Roseler et al. (Reference Roseler, Fox, Chase, Pell and Stone1997). When the treatment mean data were used for validation and split into two subsets according to mean yield in the study (< 25 v. >25 kg/day), DIM (<100 v. ⩾100 days) and experimental design (change-over v. continuous trials), the intercepts (0.12 v. −0.27, 0.06 v. −0.25 and 0.12 v. −0.47, respectively) and slopes (0.992 v. 1.015, 1.006 v. 1.012 and 0.992 v. 1.025, respectively) between predicted and observed DMI were similar, which also suggests that the model (12) was robust.
Compared with the TDMI index model (Huhtanen et al., Reference Huhtanen, Rinne and Nousiainen2008), including the animal factors into the mixed (12) and simple (13) regression models reduced RMSE from 0.42 to 0.36 and 1.64 to 0.92 kg/day, respectively. The smaller decrease with mixed model analysis is related to the fact that within a study animal factors (sECM yield, LW and DIM) are constant between diets. However, in practice RMSE will be greater due to random errors in sECM when predicted from the current yield and diet parameters.
The developed model includes several feed factors integrated into a single parameter of diet-relative intake potential (TDMI index) and animal factors (sECM yield, LW and DIM). It would be possible to substitute equation (11) for (12), but then the model would include observed ECM, that is, it would invalidate the objective of developing an intake model based on parameters available before the diet is fed. The parameter value for the relative TDMI index was slightly smaller (0.090 kg per unit) than the default value (0.100). In the evaluation of the TDMI index, the observed increase per one TDMI index unit was 0.095 kg (Huhtanen et al., Reference Huhtanen, Rinne and Nousiainen2008), suggesting some interactions between the feed factors. The only interaction term in the TDMI index model is the negative relationship between silage intake potential and level of concentrate supplementation. This interaction was also incorporated into the models by Lewis (Reference Lewis1981) and Keady et al. (Reference Keady, Mayne, Offer and Thomas2004a). The slightly lower value in this study may indicate some interactions between animal factors and intake potential, but interactions were not significant in model development or evaluation, and were therefore excluded.
Instead of using observed MY, we used ECM yield standardized for TDMI index, dietary MP concentration and DIM. This approach provides two advantages: (i) it can be estimated before the diet is fed to the cows, and (ii) it is markedly less correlated to diet characteristics than observed yield, allowing a more reliable separation of diet and animal effects on DMI. Consistent with individual cow data, TDMI index was much more strongly correlated to the observed compared with sECM yield (r = 0.80 v. 0.16). It should also be noted that although the regression coefficient for observed ECM yield was numerically even lower than for sECM in the DMI prediction model (0.238 v. 0.258), the effect of yield variable on predicted DMI was smaller when standardized rather than observed ECM was used as a model factor. Predicted DMI responses were 1.22 and 1.53 kg per one unit of standard deviation in standardized and observed ECM yield (4.7 v. 6.4 kg). In contrast, predicted DMI response per one s.d. unit of TDMI index (s.d. = 16.1) was greater when sECM rather than observed ECM yield was used in the model (1.45 v. 0.84 kg). Consequently, the true effects of dietary factors on DMI will be underestimated when observed yield is used as a model factor. This is mainly due to the strong correlation between diet intake potential and MY, that is, the dietary effects on DMI are to a large extent realized via increased MY. However, as discussed earlier by Ingvartsen (Reference Ingvartsen1994) and Keady et al. (Reference Keady, Mayne and Kilpatrick2004b), the problem of using observed yield in predicting DMI is that it is not available at the time of feeding the diet, that is, system output (MY) is used to predict system input (intake). In contrast, sECM yield used in our model (Table 3) can be estimated before feeding from current yield, diet composition and DIM. According to our knowledge, only the Danish fill unit system (Kristensen and Ingvartsen, Reference Kristensen and Ingvartsen2003) and INRA system (Faverdin et al., Reference Faverdin, Delaby and Delagarde2007) use potential rather than observed MY in estimating intake capacity. In the INRA system, potential MY is a function of peak yield, stage of lactation and gestation, but it does not take into account diet effects on the potential MY. The study by Friggens et al. (Reference Friggens, Emmans, Kyriazakis, Oldham and Lewis1998) demonstrated elegantly that using observed MY can be misleading in predicting intake potential. A 10 kg difference in MY between cows fed low and high concentrate diets during the first period would suggest a great difference in intake potential, but this was not realized when the diets were switched.
In the treatment mean data set, annual increases in ECM and sECM yields were 0.48 and 0.23 kg/day, respectively, corresponding to 146 and 70 kg per 305-day lactation, when regressed against the year of the study. These values correspond well to the phenotypic and genotypic increases in MY during the last decades (Faba, 2009), suggesting that sECM yield reflects the genetic potential of the cows.
Model comparison
The model (12) performed better according to all evaluation criteria (lower RMSPE, mean and linear bias and random error) than the published models evaluated. This could be related to accurate estimations of the intake potential of the diets using large treatment mean data sets (Huhtanen et al., Reference Huhtanen, Rinne and Nousiainen2007 and Reference Huhtanen, Rinne and Nousiainen2008) and separation of animal and diet effects on DMI by using standardized rather than observed ECM yield. The ranking of the CNCPS (Fox et al., Reference Fox, Tedeschi, Tylutki, Russell, Van Amburgh, Chase, Pell and Overton2004), Vadiveloo and Holmes (Reference Vadiveloo and Holmes1979) and Lewis (Reference Lewis1981) models on the basis of goodness of fit was similar for both the individual and treatment mean data sets, as found in the study by Keady et al. (Reference Keady, Mayne and Kilpatrick2004b). The NRC (2001) and CNCPS (Fox et al., Reference Fox, Tedeschi, Tylutki, Russell, Van Amburgh, Chase, Pell and Overton2004) models predicted much higher DMI than the models by Vadiveloo and Holmes (Reference Vadiveloo and Holmes1979) and Lewis (Reference Lewis1981), probably because they were developed using data from diets largely based on maize and lucerne silages and maize grain. With all published models, the difference between observed and predicted DMI was greater for individual cow data than for treatment mean data. In the models that do not include any feed variables (NRC (2001) and CNCPS (Fox et al., Reference Fox, Tedeschi, Tylutki, Russell, Van Amburgh, Chase, Pell and Overton2004)), the difference can be attributed to the higher intake potential for the individual cow compared with the treatment mean data (TDMI index 107 v. 92). With the Vadiveloo and Holmes (Reference Vadiveloo and Holmes1979) model, the difference can be related to the higher silage intake potential in the individual cow data set (103 v. 97), since their model includes CDMI, which is the most important concentrate factor influencing total DMI (Huhtanen et al., Reference Huhtanen, Rinne and Nousiainen2008). In the case of the Lewis (Reference Lewis1981) model, which is derived predominantly from feed variables, a weak effect of MY (0.105 kg DMI/day/kg between 20 to 30 kg/day) and absence of LW effect in the model may explain different mean biases between the two data sets.
The precision of both the NRC (2001) and CNCPS (Fox et al., Reference Fox, Tedeschi, Tylutki, Russell, Van Amburgh, Chase, Pell and Overton2004) models improved when TDMI index was used as a second variable in the model in addition to predicted DMI, suggesting that animal factors cannot deal with all diet effects on intake despite the strong correlation between intake potential and observed ECM yield. In contrast, dietary concentrations of NDF, ADF and net energy were not significant in describing intake (Roseler et al., Reference Roseler, Fox, Chase, Pell and Stone1997). This could partly be because fill does not limit the intake of highly digestible high-energy diets, and partly because their data consisted of studies of dose titration of bovine somatotropin with small variation in diet composition within study location. In contrast to the model by Roseler et al. (Reference Roseler, Fox, Chase, Pell and Stone1997), the meta-analysis by Hristov et al. (Reference Hristov, Price and Shafii2004) demonstrated that several dietary factors influenced the DMI of cows fed North American diets.
In addition to changes in the mean bias, the linear slope biases were markedly different between the two data sets. This was the problem not only with published models, since the animal model (15) derived from the individual cow data presented the same problem when evaluated using treatment mean data set (linear bias 0 v. 0.28 with mixed models). One possible explanation is that variation in body mobilization between the cows is greater than between the diets, resulting in a biased relationship between the yield and intake. Residuals (observed−predicted) of DMI predictions were positively related to TDMI index, ECM yield and LW with the NRC (2001), CNCPS (Fox et al., Reference Fox, Tedeschi, Tylutki, Russell, Van Amburgh, Chase, Pell and Overton2004) and animal models (15), suggesting that the models derived using only animal variables from individual cow data underestimate intake responses of treatment mean data (positive linear bias).
Regression coefficients for the milk fat-to-protein ratio when included as a second variable with predicted DMI were significantly higher in the NRC, CNCPS and the current (15) animal models (9.3, 8.2 and 4.8) compared with the current model (12) including both animal and feed factors (2.0). As the milk fat-to-protein ratio is related to the energy balance of cows (Heuer et al., Reference Heuer, Van Straalen, Schukken, Dirkzwager and Noordhuizen2001; Friggens et al., Reference Friggens, Ridder and Løvendahl2007), the above differences in regression coefficient indicate that mobilization/storage of body energy can result in biased parameter estimates when the intake prediction models are derived using only animal variables. In negative energy balance, body fat is mobilized, which increases milk fat concentration, whereas the supply of amino acid is reduced, resulting in lower milk protein concentration. Adjusting the observed ECM yield to the mean calculated energy balance reduced the linear bias from 0.30 to 0.15 in the present data, which also supports the view that energy balance is involved in biased estimates of intake prediction models based only on animal factors.
Management and environmental factors influencing intake
In addition to the animal and diet factors used in the present model (12), many environmental and management factors can have a substantial influence on DMI (Ingvartsen, Reference Ingvartsen1994; Mertens, Reference Mertens1994), and can contribute to the greater RMSE with the simple compared with the mixed regression model (0.90 v. 0.36 kg/day). Although management factors were often reported, within a study these effects were typically constant (e.g. feeding time, TMR v. separate feeding) and are mainly accounted for by the random study effect, and therefore cannot reliably be estimated from the data.
BCS influenced by pre-partum management has a strong influence on DMI (Garnsworthy and Topps, Reference Garnsworthy and Topps1982; Hayrli et al., Reference Hayrli, Grummer, Nordheim and Crump2003) or intake capacity (Faverdin et al., Reference Faverdin, Delaby and Delagarde2007), and could be one factor contributing to the greater RMSE with simple model analysis. Increased BCS at the same LW has reduced DMI, and therefore including BCS in the intake model could reduce intake prediction error associated with increased body tissue mobilization or fatness. The model by Keady et al. (Reference Keady, Mayne, Offer and Thomas2004a) predicts a decrease of 1.12 kg in daily DMI per one unit increase in BCS (scale 0 to 5). Similar or even greater negative BSC effects on DMI were reported by Roseler et al. (Reference Roseler, Fox, Chase, Pell and Stone1997). Some models have used LW change as a model factor in predicting DMI (see Ingvartsen, Reference Ingvartsen1994). In the models by Roseler et al. (Reference Roseler, Fox, Chase, Pell and Stone1997), the regression coefficient of weekly LW change on DMI was 0.10 to 0.15 kg/kg. However, using LW change in the intake prediction model has the same disadvantage as observed MY, that is, it is available only retrospectively. The strong effects of BCS (Keady et al., Reference Keady, Mayne, Offer and Thomas2004a) and energy balance on DMI, and consequently on residual DMI (observed−predicted), suggest that these factors can contribute to the between-study differences in DMI. Unfortunately, we did not have data to evaluate BCS effects on DMI.
The length of time the cows had access to feed varied from 6 to 24 h in the treatment mean data set, which can influence DMI and explain part of the random study effect. Increasing the time of access to feed from 8–20 to 24 h/day has increased the total DMI of grass silage-based diets by 0.6 to 1.0 kg/day (Martinsson and Burstedt, Reference Martinsson and Burstedt1990; Martinsson, Reference Martinsson1992; Heikkilä and Toivonen, Reference Heikkilä and Toivonen2005). These findings support the hypothesis that part of the between-study variation can be related to differences in the time of access to feed.
Generally, feeding forages and concentrates as TMR increases DMI when compared to feeding the same ingredients separately (Maltz et al., Reference Maltz, Devir, Kroll, Zur, Spahr and Shanks1992). In our model, the effect of concentrate feeding is accounted for by the CDMI index, but the feeding technique (TMR v. separate) may contribute to the RMSE difference between the mixed and simple models.
Most published models are based on data from certain breed(s). However, breed can have a substantial effect on intake (Ingvartsen, Reference Ingvartsen1994). In the present treatment mean data, DMI was 0.32 kg/day higher (P < 0.001) for Ayrshire cows, including Nordic Red breeds, compared with Holsteins and Friesians. However, including breed in the model only marginally reduced RMSE (0.920 v. 0.909). It should also be noted that there can be other systematic differences between studies conducted using different breeds. The proportion of heifers is another systematic factor between the studies that can cause differences between studies in DMI when other factors are constant. In the present individual cow data, DMI was 0.50 kg/day lower for first-lactation cows compared with older cows. However, in the analysis of the treatment mean data set, the proportion of first-lactation cows (n = 796) was not significant.
In addition, both Ingvartsen (Reference Ingvartsen1994) and Mertens (Reference Mertens1994) listed a number of factors (e.g. feeding frequency, tie stalls v. loose housing, temperature, photoperiod) that can influence between study differences, but are constant within study. Therefore, it can be expected that the true prediction error in practical conditions (same animals, same environment and management, same feed analysis) are closer to the mixed model rather than the simple model mean prediction error.
Methodological effects
In addition to the management factors discussed above, some methodological differences between studies can also increase simple model prediction error. Silage digestibility has a strong influence on relative SIP (Huhtanen et al., Reference Huhtanen, Rinne and Nousiainen2007). In the treatment mean data set, silage digestibility was determined in vivo in sheep fed with maintenance, rumen fluid (Tilley and Terry, Reference Tilley and Terry1963) or pepsin-cellulase (Nousiainen et al., Reference Nousiainen, Rinne, Hellämäki and Huhtanen2003) methods. Although each method can be precise within study in determining forage digestibility, there can be between-study differences (e.g. activity of rumen fluid) resulting in between-study bias in digestibility and intake potential estimates.
Silage DM concentration was determined using a range of techniques (oven drying, toluene distillation, toluene distillation + ethanol correction, or using equations to correct for volatile losses). For example, using the average silage composition of the treatment mean data set, the calculated difference in DM concentration between oven DM and corrected DM (Huida et al., Reference Huida, Väätäinen and Lampila1986) was 12.0 g/kg, corresponding to a difference of 0.53 (range 0.08 to 1.18) kg DM in daily silage intake. The method used to determine silage DM concentration may increase prediction error with both mixed model (oven DM method for silages differing in concentration of volatiles) and simple model analysis (different DM method between trials).
Conclusions and implications
A model was developed to extend the relative TDMI index model to account for the animal effects (yield, LW and stage of lactation) on DMI. The model parameters were limited to those available at the time of ration formulation, that is, observed MY and LW change were excluded. Instead, sECM yield was used in order to be able to estimate animal and diet effects independently. The model developed from individual cow data performed well when validated against a large treatment mean data set. The model performed markedly better than any of the published models, partly because of negligible mean and linear biases and partly due to lower random error. An advantage of the model is that it separates animal and diet effects on intake so that intake can be predicted as precisely and accurately by using parameters available at the time of feeding as the models based on parameters that are available only retrospectively. The model will improve current ration formulation systems by enabling the prediction of actual intake and intake responses, and consequently responses to changes in the nutrient supply, which are prerequisites for any economical model in optimizing milk production in various farming systems.
Acknowledgement
We express our gratitude to M.Sc. Terttu Heikkilä, M.Sc. Auvo Sairanen and Dr Kevin Shingfield at MTT Agrifood Research Finland, and Dr Seija Jaakkola and Dr Tuomo Kokkonen at the University of Helsinki, Finland, for providing the individual cow data.