I. INTRODUCTION
Additive manufacturing (AM) techniques, involving solid freeform fabrication methods, have attracted considerable attention in the bone-tissue engineering community due to their unique capability to produce patient-specific biomaterial devices with complex architecture.Reference Bandyopadhyay, Krishna, Xue and Bose1–Reference Kumar, Mandal, Barui, Vasireddi, Gbureck, Gelinsky and Basu4 AM methods are found advantageous over conventional methods of scaffold fabrication, such as casting, molding, salt leaching, freeze drying, electrospinning, etc.Reference Kumar, Mandal, Barui, Vasireddi, Gbureck, Gelinsky and Basu4–Reference Barui, Mandal and Basu6 Some distinct advantages of AM include the following: (i) precise control over the structural parameters such as shape, dimension, and pore architecture, (ii) fabrication of models with overhanging features, (iii) reproducibility of the structure from CAD models, and (iv) applicability to wide range of powders as the starting material.
Among the rapid prototyping (RP) techniques, 3D powder printing (3DPP) holds the foremost position to fabricate ceramic scaffolds, as the porous structure is one of the primary requirements in tissue engineering-based scaffold fabrication.Reference Farzadi, Waran, Solati-Hashjin, Rahman, Asadi and Osman7 In this context, the 3DPP method enjoys benefits over other well-known RP methods such as EBM, SLS, SLM, etc. In contrast to these techniques, room temperature processing can be adopted in the 3DPP method and additional post-processing steps, such as chemical conversion and infiltration, can be followed further to alter the microstructure and to improve the properties.Reference Meininger, Mandal, Kumar, Groll, Basu and Gbureck8 A multitude of studies reported different aspects of the 3DPP process, which have been proven to affect the structure and property of 3D powder-printed ceramic scaffolds, namely, powder–binder interaction,Reference Vorndran, Klarner, Klammert, Grover, Patel, Barralet and Gbureck9 powder particle size, and powder bed packing,Reference Lu, Hiser and Wu10,Reference Butscher, Bohner, Roth, Ernstberger, Heuberger, Doebelin, Rudolf von Rohr and Müller11 and post-processing treatments like sintering, infiltration, and chemical conversion.Reference Tarafder, Balla, Davies, Bandyopadhyay and Bose12–Reference Gbureck, Vorndran, Müller and Barralet14
Calcium sulfate-based (CaSO4·xH2O, POP) powders are one of the widely investigated materials in 3DPP due to ease of fabrication, low cost, and biocompatibility.Reference Asadi-Eydivand, Solati-Hashjin, Farzad and Osman15 It has been a model system for several studies to validate different parameters related to 3DPP; namely, powder-printability, layer-thickness, build orientation, binder saturation, printing delay, etc.Reference Farzadi, Waran, Solati-Hashjin, Rahman, Asadi and Osman7,Reference Zhou, Cunningham, Lennon, McCarthy, Buchanan, Clarke and Dunne13,Reference Asadi-Eydivand, Solati-Hashjin, Farzad and Osman15,Reference Suwanprateeb, Thammarakcharoen, Wasoontararat and Suvannapruk16 Although being a promising biomaterial, the brittle nature, low green strength, and high resorbability limit the usability of 3DPP-POP scaffolds. To fully satisfy the multifaceted requirement in bone-tissue engineering, e.g., biocompatibility, mechanical strength, and biodegradability, the biomaterial scaffolds needs to be multiphase composite in many instances, rather than a single component.Reference Dziadek, Stodolak-Zych and Cholewa-Kowalska17 In 3DPP, a variety of post-processing methods has been used for POP-based scaffolds, including chemical conversion,Reference Lowmunkong, Sohmura, Takahashi, Suzuki, Matsuya and Ishikawa18,Reference Lowmunkong, Sohmura, Suzuki, Matsuya and Ishikawa19 heat treatment,Reference Asadi-Eydivand, Solati-Hashjin, Shafiei, Mohammadi, Hafezi and Osman20 and infiltration.Reference Zhou, Cunningham, Lennon, McCarthy, Buchanan, Clarke and Dunne13 However, the influence of post-processing on the microstructure and properties remains to be explored in detail.
In the past two decades, Microcomputed tomography (µCT) has gained attention in a wide range of applications in structural characterization of biomaterials.Reference Kumar, Mandal, Barui, Vasireddi, Gbureck, Gelinsky and Basu4,Reference Bouxsein, Boyd, Christiansen, Guldberg, Jepsen and Müller21–Reference Sarkar, Sambi Reddy, Mandal, RaviSankar and Basu23 The main reason is the ability to virtually reconstruct 3D microstructure of a region of interest (ROI) from the sample, nondestructively and noninvasively. This not only makes it a relevant technique where nondestructiveness is the primary criterion but also provides the opportunity to design experiments with time-dependent evolution in the structure.Reference Hammonds and Baker24 Recently, a scientific community has witnessed the potential of this technique in application with both in situ and in silico environments. In situ experiments have been reported to provide valuable insight into the mechanism of failure and the influence of microstructure, e.g., the microstructural evolution of snow under a temperature gradient,Reference Hammonds and Baker24 fatigue crack propagation and phase transformation in metal and alloys,Reference Réthoré, Limodin, Buffière, Roux and Hild25–Reference Limodin, Salvo, Suéry and DiMichiel28 the damage evolution in composite at high-temperature,Reference Bale, Haboub, MacDowell, Nasiatka, Parkinson, Cox, Marshall and Ritchie29,Reference McDonald, Dedreuil-Monet, Yao, Alderson and Withers30 etc. Although, these kinds of experiments started with synchrotron radiation tomography, contemporary advances in lab-based µCT instruments make it possible to carry out similar inspection. We have adopted an in situ compression rig, where the simultaneous application of load and imaging with interruption to capture the structural evolution of a test sample is possible, which yields valuable information about the failure behavior.
The availability of 3D image-based data from µCT imaging also empowers this technique further, when combined with finite element (FE)-based simulation.Reference Petit, Meille and Maire31 With the development of numerical methods in finite elemental analysis (FEA), it opens up the possibility to model the experimental behavior with the input from material behavior and µCT-based data. Several reports have been published in the past decade, concerning fiber bridging at crack face,Reference Cao and Sakai32 the mechanical properties of alumina-based ceramic foam,Reference Zhang, Ferreira, Olhero, Courtois, Zhang, Maire and Rauhe33 material response of porous metal under mechanical loading,Reference Michailidis, Stergioudi, Omar, Papadopoulos and Tsipas34 FEA of reticulated ceramics under compression,Reference D’Angelo, Ortona and Colombo35 etc. It seems natural to extend this methodology to additively manufactured materials, where the distinct microstructure offers different responses in comparison to conventional fabrication methods. Nevertheless, FE modeling has not been applied to this field, especially in the case of 3DPP biomaterial scaffolds under mechanical loading, to the best of our knowledge.
In this study, we have produced POP green scaffolds with a novel starch-based binder in a direct 3DPP method. Subsequently, we have chosen two different methods to observe the effect of post-processing on the structure and mechanical property of the 3D powder-printed POP scaffold. The chemical conversion approach involves a treatment with sodium or ammonium phosphate salts to transform CaSO4·xH2O into the less resorbable calcium hydroxyapatite (HA) phase.Reference Lowmunkong, Sohmura, Takahashi, Suzuki, Matsuya and Ishikawa18 This is one of the well-studied methods to indirectly fabricate calcium HA scaffolds.Reference Lowmunkong, Sohmura, Takahashi, Suzuki, Matsuya and Ishikawa18,Reference Cox, Thornby, Gibbons, Williams and Mallick36 On the other hand, infiltration with biocompatible polymers such as polycaprolactone (PCL) is reported to increase fracture resistance and reduce brittleness, inherent to ceramics scaffolds.Reference Xue, Bandyopadhyay and Bose37 Although, both methods have limitations and advantages, the influence of post-processing on the microstructure and its impact on the mechanical properties has seldom been comprehensively investigated. The phase composition and 2D microstructure were analyzed using X-ray diffraction (XRD) and scanning electron microscopy (SEM). The changes in the bulk densities with different post processing techniques were calculated using helium-gas pycnometry. The bulk 3D microstructure and dimensional accuracy measurements were accomplished using µCT. An attempt has been made to correlate ex situ compression with finite elemental modeling of µCT imaging-based 3D microstructure. Finally, the relationship among structure, cause of failure, and effectiveness of the post-processing techniques was assessed using in situ compression coupled with µCT imaging.
II. EXPERIMENTAL
A. 3D printing and post-processing of the scaffolds
In the present work, commercially available plaster of Paris (POP,  ${\rm{CaS}}{{\rm{O}}_4} \cdot {1 \over 2}{{\rm{H}}_2}{\rm{O}}$, Sigma-Aldrich, Darmsadt, Germany) and maltodextrin (MA, Shandong Tianjiao, Heze, China) were used to fabricate the scaffolds by 3DPP. The as-received POP powder was printed using this MA-based binder with a commercial 3D powder printer (Spectrum Z510, Z Corporation, Rock Hill, South Carolina, now known as 3D Systems), which uses the drop-on-demand–based thermal inkjet printing technology for the binder ejection during printing. The design of the scaffolds was created using commercially available software, Solid Works (Dassault Systèmes, Vélizy-Villacoublay, France) and exported to the printer in stereolithography (.stl) format. It is worth mentioning here that, water or water-based binders, due to low viscosity, are found to be good inks for such a thermal inkjet printer. The primary binding reaction for POP is given by the following cement setting reaction:
 $${\rm{CaS}}{{\rm{O}}_{\rm{4}}} \cdot {1 \over 2}{{\rm{H}}_2}{\rm{O}} + {1 \over 2}{{\rm{H}}_2}{\rm{O}} \to {\rm{CaS}}{{\rm{O}}_4} \cdot 2{{\rm{H}}_2}{\rm{O}}\quad {\rm{.}}$$
Commercially available POP-based powders or binders are commonly premixed with additives such as vinyl polymers, glycerol, sorbic acid, etc.Reference Asadi-Eydivand, Solati-Hashjin, Shafiei, Mohammadi, Hafezi and Osman20,Reference Vega, Clements, Lam, Abad, Fritz, Ula and Es-Said38 In the present work, MA was dissolved in deionized water to prepare the binder solution, for 3D printing of pure POP powder. In particular, several binder compositions with various amounts of MA in water were prepared, to optimize the binding ability and setting time. Several concentrations of MA were used as trials, and 1:10 ratio of MA:H2O (gm/mL) was chosen as the final binder composition to print all the models. After optimization of printing parameters, a final core and shell binder saturation of 320% and 160% were used, respectively, with a binder volume ratio of 0.35 and a layer thickness of 112.5 µm for the printing of POP powder.
The long dimension of the cylindrical scaffolds were oriented along the fast axis printing direction (Y, the direction of print-head movement) to improve the strength of the as-printed scaffold.Reference Kumar, Mandal, Barui, Vasireddi, Gbureck, Gelinsky and Basu4 For dimensional accuracy measurement, resolution grids (RG, a parallelepiped structure with predefined strut and pore sizes) were printed, which was originally designed by Castilho et al.Reference Castilho, Moseke, Ewald, Gbureck, Groll, Pires, Teßmar and Vorndran39 The longest and shortest dimensions of the resolution grid were placed along the Y and Z axes of 3D printing.Reference Castilho, Dias, Gbureck, Groll, Fernandes, Pires, Gouveia, Rodrigues and Vorndran40 The cylinders did not contain any designed pore but the RG had predefined pore architecture, according to the CAD model. An incubation period of an hour in the printer was used for drying and the setting reaction to be completed. Then scaffolds were cleaned using airflow to remove the loose powders, followed by post hardening.
Two independent post-hardening approaches were adopted for POP-based scaffolds. In chemical conversion, one batch of the as-printed scaffolds were immersed in 1 M (NH4)2HPO4 solution and was kept at 80 °C in hot air oven for 16 h for the conversion of gypsum into the HA phase.Reference Suwanprateeb, Thammarakcharoen, Wasoontararat and Suvannapruk16 The scaffolds were then washed thoroughly with deionized water before proceeding to further analyses. In the polymer infiltration approach, a batch of the as-printed scaffolds were infiltrated with PCL (polycaprolactone, M w: 80,000, Sigma-Aldrich) solution (10% PCL in CHCl3) for 5 min. Based on the post-processing techniques, the scaffolds are designated as P (as-printed, without any post-processing), PC (printed-converted), and PPCL (printed-infiltrated).
B. Phase assemblage, 2D microstructure, and density measurement
The phase assemblage of the printed scaffolds with various treatments was investigated using X-ray diffraction (XRD; X’Pert Pro, PANalytical, Almelo, the Netherlands). The samples were scanned for 2θ ranging from 10 to 60° with a step size of 0.02 min−1 with Cu Kα (1.5418 Å) radiation, at 40 kV voltage and 30 mA current. The obtained data were analyzed and compared with the ICDD (International Committee for Diffraction Data) standards. Additionally, the samples were investigated for microstructure analysis using a field emission scanning electron microscope (FESEM, Inspect F50, FEI, Hillsboro, Oregon), operated at 10 kV accelerating voltage. Prior to scanning, all the samples were coated with a thin layer of gold to minimize the charging effect. The Energy dispersive X-ray spectroscopy analysis of samples was carried out using an EDAX (Oxford Instruments, Bristol, United Kingdom) attachment.
The density of the samples (P, PC, and PPCL) was measured with helium-gas pycnometry (Ultrapyc 1200e, Quantachrome, Boynton Beach, Florida). A set of at least three samples (n > 3) of each composition were weighed using a precision balance (ML 104, Mettler Toledo, Greifensee, Switzerland), and then the density was determined from the volume, measured from a pycnometer. A purge time of 10 min with auto-equilibration and 21 psi as the target pressure were chosen as the run parameters for all the samples, which were dried thoroughly and stored in vacuum prior to this analysis.
C. 3D microstructural analyses using µCT
All three types of scaffolds (P, PC, and PPCL) were imaged using microcomputed tomography (µCT, Xradia 500 Versa, Zeiss, Jena, Germany), to visualize the pore architecture as well as to quantify the various parameters such as pore volume fraction and pore interconnectivity. The instrument was operated at 50 or 60 kVp with 4 or 5 W (peak voltage and power), respectively, with exposure time in the range of 1–5 s to obtain a transmission of 20–35% with a suitable filter (LE1–LE6). Depending on the resolution of the scans (dimensional accuracy, quick scout, and microporosity), macro- and micro-objectives (0.4×, 1×, and 4×) were used to obtain pixel size ranging in 29–3 µm, at detector binning 2. Each sample was rotated around the vertical axis by 360° to acquire 3001 projection images. The 3D tomograms were reconstructed in XMReconstructor™ software (Xradia, Zeiss, Jena, Germany) with default beam hardening correction and a Gaussian filter of kernel size: 0.5, from all the 2D projections.
D. Image processing, visualization, and quantification
Commercially available software, Avizo 9 (Thermo Scientific, Mèrignac, France), was used for the measurement of total microporosity, dimensional accuracy assessment, failure analyses, visualization, and 3D mesh generation for simulation.
1. Segmentation
Pore volume fractions of the samples were calculated using a manual (binarization using thresholding) and a semi-automatic procedure (watershed segmentation).Reference Meininger, Mandal, Kumar, Groll, Basu and Gbureck8,Reference Mandal, Meininger, Gbureck and Basu41 All the tomograms were equalized in contrast with respect to each other by comparison of mean and variance. A non-local-means filter (neighborhood 21, similarity value 0.4) was used for noise reduction. Suitable threshold values were then determined by visual comparison of orthoslices using an interactive thresholding module for each sample. The details of the watershed segmentation procedure can be found elsewhere.Reference Mandal, Meininger, Gbureck and Basu41,Reference Vincent and Soille42 Voxels (smallest three-dimensional unit volume forming the digital image) having intensity higher than threshold values were assigned into the material phase and all the values below threshold values were allocated to the pore/void phase. The resulting image is known as a binary image having material (value 1) and pore (value 0). This binary image was subtracted from a mask, created on the entire image to obtain the total porosity and material fraction, using voxel counting.
2. Image registration
Image registration is the first step, to align two or more volumes or surfaces, for comparison between CAD and printed model (nominal-actual analysis) or for the comparison between subsequent in situ tomograms.Reference Mandal, Meininger, Gbureck and Basu41 In the case of the in situ tomograms, first, all the images were matched to yield the same level of contrast. This helped in the segmentation as the same threshold value can be used for all the tomograms. Three tomograms of interest were chosen for P, PC, and PPCL. Then the tomograms were manually aligned by visual comparison and were then registered at the same place so that comparison by masking is possible. For the final fine-resolution registration, a quasi-Newton optimizer was chosen, which, with each iteration, tries to minimize the Euclidean distance between the surfaces to be registered. The tomograms at first point in the stress–strain curve, from all three set of experiments, were used as masks, as they did not contain any crack. The subsequent segmented images were subtracted from the mask to extract the structural changes which were visualized as volume-rendered images of fracture.
3. FE mesh generation
The tomogram obtained from µCT imaging of the as-printed scaffold (P) was cropped to ∼453 µm sided cubic volumes to generate meshes to be used for finite elemental modeling. These volumes of interest were segmented into binary images as described in Sec. II.D.1. Generation of volume (3D) mesh from the binarized image is a multistep procedure. This involves the following sequences: (i) Generation and refinement of surface mesh: first, the binary 3D image containing pore and phase was converted to the surface.Reference Hege, Stalling, Seebass and Zockler43 The surface obtained in this way is not suitable for simulation in terms of triangle quality (aspect ratio, dihedral angle, etc.). For this, the triangle quality was improved by means of a remeshing technique, as described by Zilske et al.Reference Zilske, Lamecker and Zachow44 Then, (ii) tetrahedral grid generation: Once the required level of standard is reached, the surface mesh was converted to a tetrahedral grid by the advancing front method.Reference Löhner and Parikh45–Reference Jin and Wiberg47 The tetrahedral grid was also improved in quality, to remove distorted tetrahedrons generated at the first stage, by means of inner vertex removal, edge and face flipping. Once, a reasonable quality of tetrahedrons was achieved, it was exported as 3D mesh. The final model consisted of ∼1.2 million four-noded tetrahedral elements, which was imported to FE analysis software, as elaborated in Sec. II.E.
4. Visualization
For 2D visualization, orthoslices at XY (transverse or axial) planes were taken as cross-sectional images. The volume rendering module with linear transfer function in “RGBA” color space was used to depict the materials and pores in a 3D space. For comparison of the binary and 3D mesh in two-dimension, orthoslice and grid cut slice were used. The 2D and 3D meshes were visualized with surface view and tetra grid view, respectively.
E. Mechanical properties ex situ, in situ, and in silico
In order to evaluate the mechanical properties of P, PC, and PPCL scaffolds, the samples were loaded in the uniaxial compression mode, with a universal testing machine (MultiTest 10-i, Mecmesin, Slinfold, United Kingdom). At least six (n > 6) cylindrical models (dia: 7 mm, length: 14 mm) were tested for each composition. A 100 N load cell with a crosshead speed of 1 mm/min was used for the compression, at ambient conditions. The total contact surface area with the load cell was measured prior to compression for the calculation of stress value.
For the compression and imaging experiment, the sample was placed inside an in situ rig with X-ray transparent window (DEBEN, London, United Kingdom), mounted on the sample stage. The uniaxial compression was carried out with 0.1 mm/min crosshead speed, and tomograms were acquired by interrupting the compression at a number of intervals. The scanning parameters were 70 kVp at 6 Watt, 1× objective, binning 4, 26 µm pixel size, exposure time of 4 s, and 1601 projections at 180° rotation.
Uniaxial compression simulation of the microstructure was carried out using Ansys Workbench (version 18.0, ANSYS Inc, Cecil Township, Pennsylvania). First, the 3D tetrahedral mesh was imported in “FEmodeler” to generate a geometrical entity pertaining to the mesh. This tool uses skin detection to cut the surface into smaller elements based on the angle between adjacent triangles and subsequent geometrical entity formation. The combined geometry along with the mesh was then suitable for simulation in Ansys Mechanical, by application of boundary conditions and material properties. The mesh/geometry was assigned with material property of pure calcium sulfate dihydrate. The other additives, such as MA, were not considered as they are very small in amount, as mentioned in Sec. II.A and also due to the fact that the precise location of the additive is not possible to evaluate. The boundary condition for compression, the nodes at one surface were fixed to restrict X, Y and Z movement. The opposite surface nodes were subjected to unidirectional constant force that lead to less than 3% global strain of the model.
F. Statistical analysis
The mean values of compressive strength, microporosity, and density of the scaffold were compared and analyzed using SPSS Statistics (version 23, IBM, Armonk, New York). A significance of P < 0.05 was considered different for all cases. All the values are represented as mean ± standard deviation.
III. RESULTS
In this section, we shall first describe the results of printing accuracy for the binder and process parameter used in this study. This would be followed by the phase assemblage, 2D and 3D structural characterization, and then the results of in silico and in situ compression using a host of techniques, e.g., SEM, XRD, FEA simulation, and µCT.
A. 3D printing and dimensional accuracy
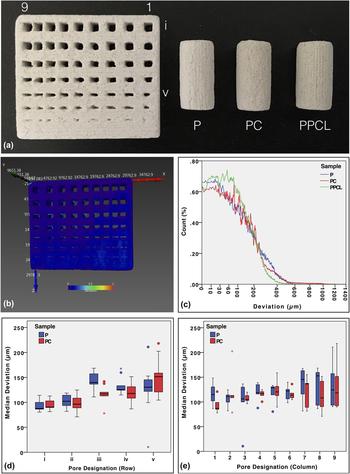
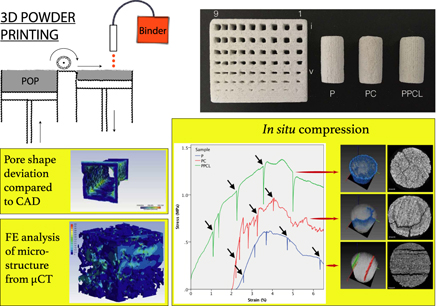
The representative 3D-printed scaffolds are shown in Fig. 1(a). On the left, RG could be seen, which was used to measure dimensional accuracy after printing.Reference Castilho, Moseke, Ewald, Gbureck, Groll, Pires, Teßmar and Vorndran39,Reference Castilho, Gouveia, Pires, Rodrigues, Pereira, Campbell and Campbell48 Next to it, P, PC, and PPCL scaffolds can be seen, respectively, for compression testing. All three types of RGs (P, PC, and PPCL) were chosen for the dimensional accuracy analysis.
Representative image of 3D powder-printed samples with different post-processing techniques: RG (resolution grid), P (as-printed), PC (printed, chemically converted), and PPCL (printed, infiltrated), from left to right, respectively. (b and c) Representative image for the description of precision and accuracy in fabrication of RG, virtually colored surface according to distance between real and CAD model. Distribution of median surface deviation values of individual pores along the rows (d) and columns (e), as denoted in (a).

Figure 1(b) represents the actual deviation of the RG sample of PPCL, from the starting CAD model. The color bar represents the deviation in µm. According to these shades of color, the deviation at each point of the surface is virtually reconstructed. From a quick look, it can be perceived that the majority of the surface is blue, signifying that most of the surface has deviation close to 0 mm and a few portions at the corners of the predesigned pores are having relatively more deviation. These observations are summarized quantitatively as the histogram of PPCL in Fig. 1(c), in addition to P and PC.
The results of a more in-depth analysis of deviation of individual pores are presented in Figs. 1(d) and 1(e). The pores are designated as i–v in rows, with decreasing size in one direction and as 1–9 from right to left with same dimension but decreasing gap or strut size between each other. The median deviations of individual pores are represented with boxplots in these two graphs. The notable observation is that the spread in median deviation increases with decreasing pore size [Fig. 1(d)] and also with decreasing gap between them [Fig. 1(e)]. While interpreting these two plots, it should be kept in mind that the median values are extracted from the deviation histogram from each of the individual pores. Then the median values are collated to form boxplot along rows [Fig. 1(d), 9 values for each row] and along columns [Fig. 1(e), 5 values for each column], to yield useful trend in deviation.
B. Phase assemblage and 2D microstructure
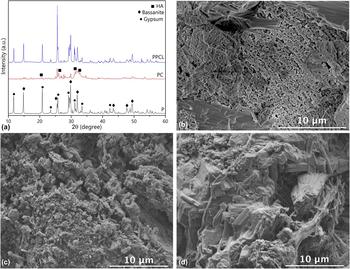
Figure 2(a) shows the powder XRD patterns of as-printed (P), printed-converted (PC) and printed-infiltrated (PPCL) scaffolds. The diffraction pattern from the P scaffold showed the presence of gypsum (CaSO4·0.5H2O, ICDD: 014-0453) and smaller amount of bassanite (CaSO4·2H2O, ICDD: 021-0816). After conversion, the predominant phase was HA (ICDD: 003-0747). In the case of PPCL, the XRD spectra are identical to P. The corresponding peaks of each phase are marked in Fig. 2(a). Another important observation is that the relatively lower intensity of all the peaks for PC, compared to P and PPCL, indicates a decrease in crystallinity and an increase in the amorphous phase, due to chemical conversion. When calcium sulfate comes into contact with ammonium phosphate solution, a dissolution–precipitation reaction is set off, leading to the formation of the calcium phosphate phase.Reference Suwanprateeb, Thammarakcharoen, Wasoontararat and Suvannapruk16,Reference Zhou, Buchanan, Mitchell and Dunne49 The calcium HA, formed in this manner, would be of low crystallinity, which causes the increase in the amorphous phase.
Phase assemblage and surface microstructure of the scaffold. XRD pattern of the P (as-printed), PC (printed, chemically converted), and PPCL (printed, infiltrated) samples. The decrease in crystallinity, appearance of HA in PC, and no phase change are evident in PPCL (a). Representative SEM images of the broken surface in compression tests, showing granular surface morphology of the as-printed (P) scaffold (b), 3D printed-converted (PC) scaffolds (c), and polymer-infiltrated (PPCL) scaffolds (d).

The surfaces of the P and PC samples are composed of particles with intergranular spaces [see Figs. 2(b) and 2(c)]. A few coarse particles along with fine powder and interconnected micropores are visible on the surface of P. The particle morphology is modified when it undergoes chemical conversion, as can be seen in Fig. 2(c). The efficacy of the infiltration technique is demonstrated in Fig. 2(d) (PPCL), where fibrous pullout of the polymer around the granules, on the fracture surface, is visible.
C. 3D microstructure and density
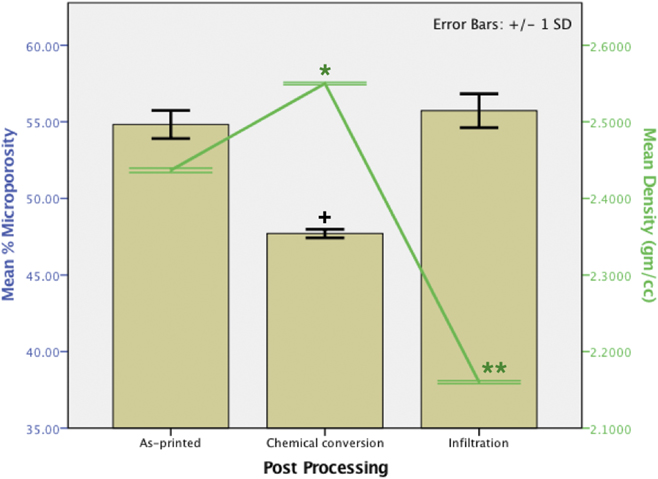
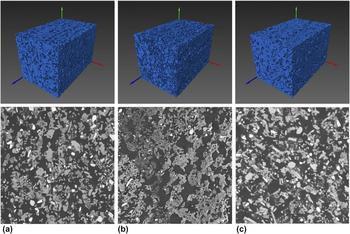
From the µCT imaging of the P, PC, and PPCL scaffolds, the pore volume fraction and interconnectivity were determined. At least three tomography scans were acquired from each sample and the mean values of porosity are plotted in Fig. 3. The amount of microporosity ranges from 47 to 55%, with no statistically significant difference between P (54.8 ± 0.9%) and PPCL (55.7 ± 1.1%). It is due to the fact that, while imaging the ceramic scaffold infiltrated with polymer, polymer is rendered transparent to X-ray. Consequently, while segmenting the image, polymer phase is not accounted for, rather merged into, the pore phase. A similar observation can be noted from the representative volume-rendered images of the 3D pore spaces, in the upper panel of Figs. 4(a)–4(c). The micropore space is shown in blue, where only one color denotes a fully interconnected pore space. The PC scaffold contains significantly less porosity (47.7 ± 0.3%) than P and PPCL. Corresponding 2D slices from the same ROI are shown in the lower panel of Fig. 4. We can see particles with multiple gray level contrast, but this was not enough to segment the images into different phases. The density data from each of the composition show opposite trends to microporosity (see Fig. 3). One-way ANOVA with the Tukey post hoc test revealed that the densities of three compositions are significantly different from each other (P < 0.05), as expected from their phase compositions.
Changes in microporosity and density, with different post-processing techniques, as obtained using two complementary techniques µCT and pycnometry, respectively. ‘+’ denotes that chemical conversion leads to a significantly different (P < 0.05) amount in porosity, whereas density is significantly varied with both post-processing (PC and PPCL) compared to the as-printed (P) sample (P < 0.05), as obtained by one-way ANOVA with Tukey’s test.

μCT imaging and analysis providing representative microstructures of P, PC, and PPCL samples (a–c): Lower panel shows the 2D slices from particular regions of interest. Upper panels signify the total interconnectivity of microporous space (∼1200 × 1200 × 1900, in µm) as 3D volume rendering, with single color.

The amount of PCL intake was found to be 13.49 ± 0.62% (by weight). To evaluate the repartition of PCL, we developed a simple scheme (see Supplementary Material Sec. S4), where the limiting conditions that can arise during an infiltration stage, can be examined using the following methodology:
(i) All the polymer infiltrates stay outside the scaffold, i.e., no penetration inside the scaffold has taken place [see Fig. S5(b)]. In other words, the infiltrate forms a outer coating on the entire scaffold volume, making the effective volume as the addition of as-printed scaffold volume including pore space) with the volume of the infiltrate. Then, by the principle of pycnometry, the density of the infiltrated scaffold would be given by the following equation:
 $${\rho _{{\rm{PI}}}} = {\rho _{{\rm{P(total)}}}} + {\rho _{\rm{I}}}\quad .$$
(ii) If most of the polymer goes inside the scaffold as thin layers and only a small fraction of the infiltrate blocks the tiny pores, then closed pore fraction of printed-infiltrated scaffold,
 $${\rm{CPF}} = {{{V_{{\rm{PI}}}} - {V_{{\rm{P+I}}}}} \over {{V_{{\rm{P(total)}}}}}}\quad .$$
The applicability of and findings from these equations will be elaborated in Sec. IV.C.
D. Uniaxial ex situ compression properties
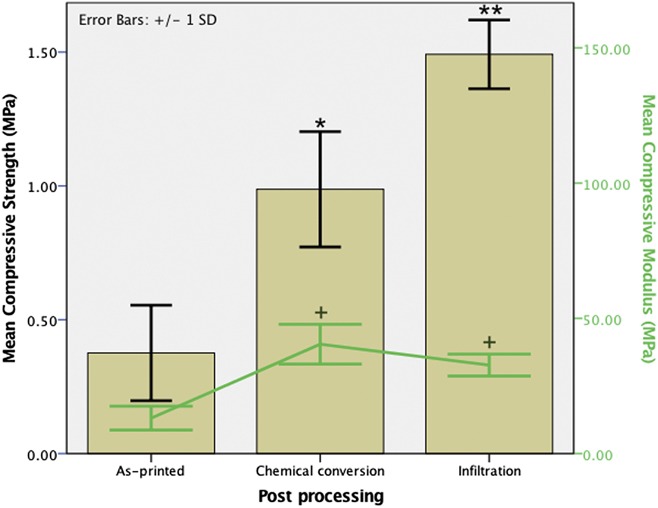
The results of the compressive strength measurement are summarized in Fig. 5. It is easily comprehensible that P, PC, and PPCL samples exhibit a distinctly different response under compressive loading. The mean compressive strength obtained from these samples is significantly different from each other (see Fig. 5 and Table I) and they fail at different strain values. There is an increment in compressive modulus both with chemical conversion and infiltration, although statistically significant differences between PC and PPCL could not be recorded. Another noteworthy observation is that, in comparison to P and PPCL, a larger variation in the values of compressive strength and modulus for PC was measured.
Changes in compressive strength and modulus, with different post-processing techniques, as obtained in ex situ compression. * and ** denote statistically significant increase in compressive strength of PC (printed-converted) and PPCL (printed-infiltrated), w.r.t. P (printed) and PC, respectively (P < 0.05, n > 6). + denotes significant difference in compressive modulus of PC and PPCL compared to P.

Summary of mechanical properties and structural attributes of the scaffolds with different post-processing techniques.

E. Finite elemental modeling
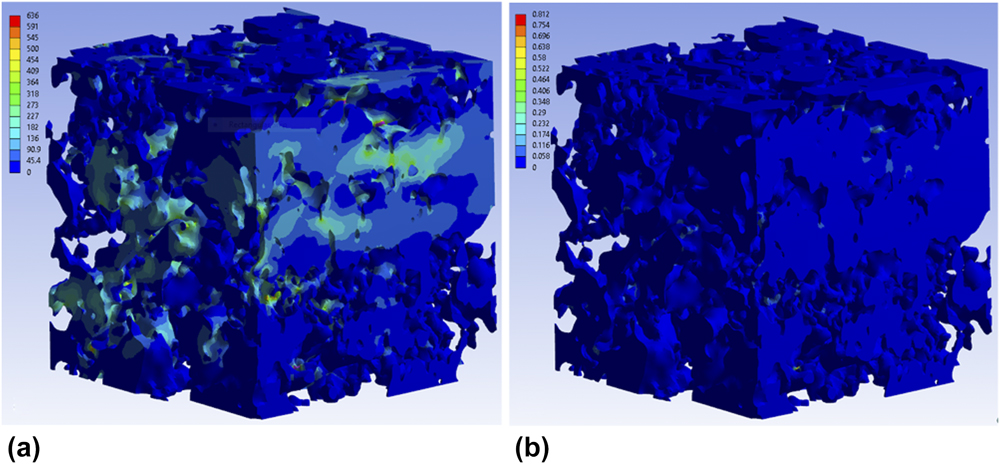
Figure 6(a) depicts the spatial distribution of equivalent (Von-Mises) stress in the scaffold microstructure under the condition, similar to that of ex situ compression. In such a complex microstructure, the thin joints and narrow struts are expected to experience the highest amount of stress. It is evident that most part of the microstructure remains at relatively low local stress, ranging in 0–45 MPa, whereas at a few places, the maximum stress reaches a quite high value till 636 MPa. A similar observation can be drawn from the strain map, shown in Fig. 6(b). A careful observation indicates that most of the model remained relatively strain-free, except a few places, where high strain was developed locally, instead of the small global strain of 3%. These narrow junctions are expected to fail much before, if we consider previous literature reports from other porous ceramic systems. As we have not modeled the failure criteria, the model persists without rupture at those small junctions, in the present scenario. Probing the force reaction at the fixed support, we got global elastic modulus values of 477.8, 377.8, and 303.3 MPa (at three different axes) for this particular ROI, which is more than an order of magnitude higher than the experimental value, for P (see Table I). The reason for the deviation and possible causes are examined in Sec. IV.D.2. Also, the variation in the modulus along with three different axes is the signature of the 3DPP scaffold, as different movement speeds of the print cartridge during fabrication lead to variation in the microstructure and mechanical properties.Reference Castilho, Dias, Gbureck, Groll, Fernandes, Pires, Gouveia, Rodrigues and Vorndran40,Reference Castilho, Gouveia, Pires, Rodrigues, Pereira, Campbell and Campbell48,Reference Farzadi, Solati-Hashjin, Asadi-Eydivand and Osman50
Local stress (in MPa) and strain maps (a and b, respectively) of the scaffold P microstructure (453 µm cube, obtained from µCT data), after in silico compression. A wide variation in both stress and strain values at different places of the complex microstructure is visible.

F. In situ compression and imaging
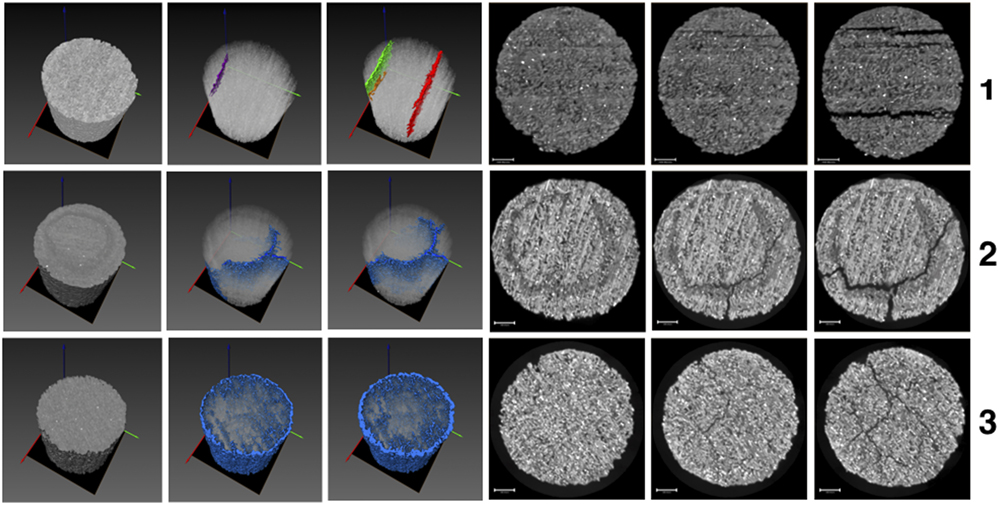
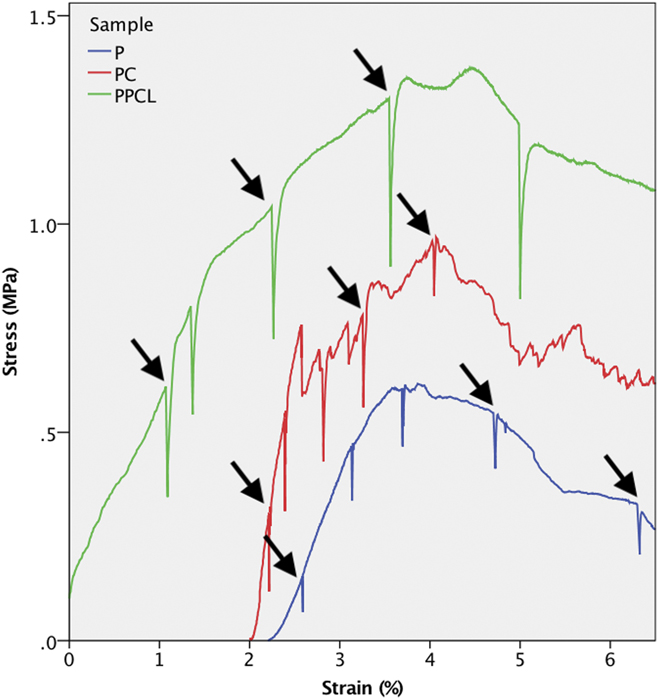
The in situ compression was performed intermittently, namely interrupting the test at arbitrary time points with the goal to capture the unperturbed state, crack generation, and propagation state till complete failure. Left three images from panels 1, 2, and 3 of Fig. 7 represent the crack formation from the ROI scanned for P, PC, and PPCL scaffolds, respectively. Whereas, right three images correspond to one particular 2D slice at the same position from the ROI, enabling the comparison of crack generation and growth. After image processing, we get the structural differences at each stage of compression, through which the comparison becomes easier. The stress–strain curve from the corresponding experiment is plotted together in Fig. 8. In spite of the much longer timescale needed for in situ tomography, compared to ex situ compression, the compression behavior does not differ much. The stress–strain plot in Fig. 8 is annotated with the points of interest for imaging, which are shown in Fig. 7, from which we can get the relevant structural deformation. Overall, in situ compression results of the P, PC, and PPCL scaffolds correspond well to that obtained in ex situ compression (see Figs. 5 and 8).
Structural evolution of P (as-printed, Panel 1), PC (printed-converted, Panel 2), and PPCL (printed-infiltrated, Panel 3) under in situ compression coupled with μCT imaging. (left three) Volume-rendered 3D images of crack overlaid on the sample. (right three) 2D slice at similar plane from the same ROI for comparison.

Stress–strain response of the 3D-printed scaffold under in situ compressive loading. Green: PPCL; red: PC; and blue: P, shifted to ∼2% strain for visual clarity. The points of interest for in situ tomography, as shown previously in Fig. 7, are correspondingly annotated here.

IV. DISCUSSION
A. Dimensional accuracy evaluation
In the present work, we have used an easy to prepare maltodextrin (MA)-based binder to print the porous scaffolds. The first evaluation of printing efficacy is the precision in dimensional reproducibility. With the help of nominal-actual analysis, we have obtained visualization and quantification of the deviation in the case of RGs [Figs. 1(b) and 1(c)], and also for the individual pores, which can be seen in Figs. 1(d) and 1(e). As noted before, qualitatively the RG model looks nearly identical to the starting CAD design, in which the minimum strut and pore size was 250 µm and 750 µm, respectively. As shown in Fig. 1(c), we can expect similar deviation profiles for P and PPCL. This is due to the fact that the polymer is not imaged in µCT and the reason is already mentioned previously in Sec. III.C. In case of PC, it should be noted here that the RG sample that was used for deviation measurement as P was subsequently subjected to chemical conversion (which was transformed into PC, for the same analysis). From the observation with bare eyes and nominal-actual analyses, we have not noticed much difference in surface deviation in comparison to P. This invokes the idea—if the conversion was as successful for the RG sample as for the cylindrical models.
Actually, the signature of preferential phase conversion around the pore surfaces can be seen with a keen observation of the radiographs during image acquisition set-up (see Supplementary Material Fig. S3). A thorough comparison between the histograms presented in Fig. 1(c) reveals few more things. For example, the surface deviation is more for PC at high values, especially in the range of 600–1000 µm and less at lower values, in comparison to P. It may be surmised that chemical conversion leads to change in surface structure at few places, with most other places being unaffected. Nonetheless, more rigorous analyses with multiple samples are necessary to validate such inferences. From the variation-histograms of two surfaces, we find the median (50th percentile) value of 121.8 µm, 102.16 µm, and 123.122 µm for P, PC, and PPCL, respectively, which indicate that 50% of the scaffold surface has deviation less than the corresponding values. This establishes the efficacy of the printing along with both post-processing steps, to ensure dimensional accuracy.
Nominal-actual analyses of individual pores also provide noteworthy conclusions (see Supplementary Material Fig. S4 for representative images). As mentioned in Sec. III.A, the spread in the values of deviation increases with decreasing pore size (pores in rows, i to v). This is expected, as we approach toward the physical limit of the printing technology to replicate finer features/pores. But, the same trend is observed when the gap or strut size between them is also decreased [Fig. 1(a), columns 1 to 9], which implies that the printing accuracy is also dependent on the neighboring features to some extent. It can be argued that the maximum deviation can also yield useful information about the printing accuracy. But, we have only considered the median, as we found no such trend for the maximum deviation of pores. The median is considered more important as it carries more information than the maximum value. For example, the maximum value of deviation is not dependent on the shape of the distribution, but median increases with increasing positive skewness. This indicates more surface points with higher deviation values, in the present case. The presence of a few outliers in Figs. 1(d) and 1(e) indicates that a few pores have quite high deviation from the input CAD file. In other words, these resulted from replication of a few pores with high discrepancy during printing.
B. Phase assemblage and 2D microstructure
Any phase change or a decrease in crystallinity in the PPCL samples could not be recorded from the polymer infiltration technique used here, as no chemical reaction takes place. The chemical conversion route leads to partial conversion of the POP phase to HA. Notably, this is accompanied by a significant increase in amorphous phase of the sample. The surfaces of the post-processed scaffolds were distinctly different from each other [see Figs. 2(b)–2(d)]. In comparison, the bulk microstructures of P, PC, and PPCL scaffolds, as obtained with µCT imaging, exhibit almost similar features (see Fig. 4). This is a limitation of absorption-based µCT technique, as the polymer used for infiltration is rendered transparent with respect to much denser POP matrix. A closer look into these 2D slices from respective µCT images reveals that the granules in the PC sample is more interconnected compared to other two compositions. This can be rationalized on the basis of chemical reaction that took place in PC, which alters the structure at micron level. This has profound implication on the mechanical property of the chemically converted scaffold, which would be elaborated in Sec. IV.D.
C. 3D microsturcture and porosity analysis using µCT and pycnometry
Along with external structural attributes, bulk microstructural parameters, e.g., porosity and pore interconnectivity are of major importance for bone-tissue engineering application.Reference Basu2,Reference Kumar, Mandal, Barui, Vasireddi, Gbureck, Gelinsky and Basu4 Angiogenesis and vascularization, that are required for bone ingrowth and better host response, depend on the extent of pore accessibility, which is dictated by porosity and pore interconnectivity.Reference Kumar, Mandal, Barui, Vasireddi, Gbureck, Gelinsky and Basu4 It should be noted here that, 3DPP is accompanied with two different types of porosities: designed macroporosity and inherent microporosity. The first type of pore formation is discussed in detail in Sec. IV.A, whereas the second type of porosity results from loose adherence and gap between powder particles and individual layers during printing. The amount of bulk microporosity for all the samples ranged between 45 and 55%. The infiltration of the samples with polymer does not alter the microstructure, except it only goes into the micropore channels. As discussed in Sec. III.C, polymer is not taken into consideration, while quantifying the microporosity amount from µCT tomogram and no significant difference in the amount of microporosity is found, compared to as-printed samples (P, Fig. 3). This is expected, as there is no change in the ceramic microstructure. In addition, a significant decrease in bulk density was recorded, as the bulk of the PPCL samples is impregnated with a polymer of significantly lower density. With other post-processing technique, an increase in density and slight decrease in porosity are obtained for PC samples, which might seem contradictory at the first glance. Nevertheless, this is due to the fact that POP (dihydrate, 2.32 gm/cm3) is partially converted to higher density calcium HA (HA, 3.156 gm/cm3).
From the infiltrate repartition analysis, we find that the resulting density of PPCL is found to be 1.14 ± 0.02 gm/cm3, if we apply Eq. (1). This is definitely not true, as can be seen in Fig. 3. Moving on to the next equation, we found that the difference between V PI and V P+I is 6.55 ± 0.24%, when compared to the total volume of the scaffold. It is worthy to mention here that equal value of V PI and V P+I indicates the formation of no closed pores. From this, we can say that major portion of the infiltrate successfully goes inside and covers the inner walls as thin layers of the polymer [see Fig. S5(c)]. Also, we have found that the intake of the infiltrate (PCL) by the scaffolds is regular and reproducible (13.49 ± 0.62%). Nevertheless, the following considerations should be taken into account while applying this analysis strategy:
(i) The sample should be sufficiently porous. We can see that, in case of a sample with low porosity, the density measured by pycnometry will approach the first condition described by Eq. (2). A corollary to this observation can provide a way to analyze if a sample is very low in porosity or not, especially in situations when porosity analysis through direct imaging is not possible, as in our case.
(ii) The internal microstructure (observed with µCT, e.g.) should be representative of the whole sample because the porosity or pore volume fraction directly depends on it.
(iii) Surface deviation from the CAD model or surface defects should be minimal or negligible, as it would affect the total volume considered for density calculation.
Figures 4(a)–4(c) illustrate the interconnectivity of the printed, converted, and infiltrated scaffolds (P, PC, and PPCL), respectively. As mentioned before, different colors represent different objects with no connection between them, in these volume-rendered images of the pore space from the representative cropped region of the samples. The absence of any other color, except one (blue), determines that the whole pore space is interconnected. Also the scaffolds are devoid of closed pores (except in the case of PPCL here), which do not contribute to any physiological role.
D. Ex situ, in silico, and in situ mechnical response
With an increase in adoption of 3DPP for bone-tissue application, several factors have been recognized to influence the dimensional accuracy and mechanical properties. These include (i) instrument specific printing parameters, (ii) composition of binder and powder, and (iii) post-processing treatment schedule of the scaffold.Reference Asadi-Eydivand, Solati-Hashjin, Shafiei, Mohammadi, Hafezi and Osman20 The dimensional accuracy aspect has already been discussed. We shall now analyze the influence of post-processing on the mechanical behavior, first with the compression behavior ex situ. Then, we chose in silico approach to model the compression behavior from microstructure obtained from the µCT image. This was not fully satisfactory and the limitations are discussed subsequently. Based on these results, we have designed the intermittent in situ compression and tomography analysis.
1. Ex situ compression
There is significant improvement in compressive strength with both post-processing methods. The stress–strain response of P is relatively simple with one major point of failure (data not shown), indicating that the as-printed scaffolds are brittle and least resistant to failure. PC has multiple points of failure and is comparatively more fracture resistant than P. The multiple stages of failure can be rationalised on the basis of the generation of multiple cracks, which leads to localized failure of the scaffold structure. In multiple attempts during the in situ compression of the PC sample, we could not obtain any proof to confirm this. In comparison, both P and PPCL scaffolds show single point of failure. PPCL shows the highest compressive strength, as the PCL fills up the interparticle pore space and resists crack formation. Also, fracture resistance of the sample increases due to polymer infiltration, which can be visualized from the area under the stress–strain curve till failure (see Fig. 8). It is worthy to mention here that, even till 40% strain, most of the PPCL sample was able to resist failure and beyond this point, the compression was not continued anymore. Clearly, PPCL exhibits the benefits of being a composite of ceramics (CaSO4·xH2O) and polymer (PCL), which imparts strength and resistance to failure, respectively.
2. In silico modeling
As can be recalled from Sec. III.E, the present model was not fully satisfactory to describe the compression properties of the as-printed scaffold model (especially in terms of elastic modulus or ultimate compressive strength). This is even considering the fact that the prerequisite tetrahedral mesh for the FE modeling was faithfully reproduced from the tomography data (see Supplementary Material Sec. S1). This can be justified reconsidering the following aspects. First, the as-printed structure consists of not only gypsum but also unreacted plaster of Paris, unlike our assumption of pure gypsum.Reference Vekinis, Ashby and Beaumont51 The presence of considerable amount of bassanite, as seen from the XRD pattern, substantiates this observation. Second, the validity of the model depends on the structure, which is determined by the imaging resolution. The voxel size of the presently used model is 3 µm. There might be nanopores present in the structure, which act as stress-concentration points. This might lead to further lowering of the ultimate compressive strength and modulus. Third, it was mentioned in the literature that same amount of porosity and phase composition can result in varying strength and modulus due to different crystal shapes.Reference Coquard, Boistelle, Amathieu and Barriac52,Reference Phani, Niyogi, Maitra and Roychaudhury53 This was not parameterized in our model and this can also explain further deviation from the real value.
A better confirmation to the experimental value can be obtained if we can consider the phase composition as a mixture of calcium sulfate dihydrate along with hemihydrate, if there is any residual nanopore, the shape of the crystallites. The combinatorial influence of all these factors on the effective elastic modulus. Despite these drawbacks, the anisotropic property of 3D powder-printed scaffold, which was previously noted in prior ex situ studies,Reference Asadi-Eydivand, Solati-Hashjin, Farzad and Osman15,Reference Castilho, Dias, Gbureck, Groll, Fernandes, Pires, Gouveia, Rodrigues and Vorndran40,Reference Farzadi, Solati-Hashjin, Asadi-Eydivand and Osman50 was successfully captured and confirmed by our finite elemental model, even at a small length scale of less than half millimeter. Due to further computational limitations and the nonsatisfactory agreement of elastic modulus of the as-printed scaffold (P) with experimental value, we did not explore further with the post-processed scaffolds (PC and PPCL). To restrain from going astray from the scope of this particular study, we focused on in situ compression with µCT. This was effective in capturing the failure characteristics and the discerning behavior of two other post-processed scaffolds, which is elaborated in Sec. IV.D.3.
3. In situ compression and imaging
The distinct differences in the stress–strain response of P, PC, and PPCL are unveiled using in situ compression and simultaneous µCT imaging. A comparison of the volume-rendered images of crack formation and evolution in Fig. 7 points out the differences in the modes of failure. The 2D slices, taken from the same ROI in the XY plane, show the crack patterns. The mode of fracture is most straightforward in the case of P scaffold. The cracks preferentially generate in particular orientation along with particular shape. A closer look reveals that the cracks actually form in between adjacent printing layers. The intralayer regions are the weakest region for the as-printed scaffold under compression, which suggests that improving intralayer bonding can be of major importance, if strength improvement is the primary aim. In the case of PC, a clear circular region of different gray level is observed in the fourth image at panel 2 of Fig. 7. With increase in load, the crack formation starts preferentially along this region (second and fifth image, panel 2). At the failed state, we find this crack as major and grown further (third and sixth image, panel 2). In the case of ex situ compression of PC, it was observed that scale-like structures spall off and this can be attributed to the incomplete conversion of the POP phase into HA. The outer surface of the scaffold may consist of predominantly HA and the inside might be rich in POP. Only by means of in situ imaging with compression, we could confirm that the adopted processing approach is not suitable to convert a cylindrical POP scaffold fully into HA, as this procedure involves a weak interface junction between converted and unconverted phase. In comparison, the PPCL scaffold does not reveal any single major crack and an increase in scaffold diameter during compression can be seen instead (see panel 3 in Fig. 7). The cracks generate at random places in the samples, which cannot follow any preferred orientation due to the presence of the polymer. It is plausible that the polymer present in the microporous space resists crack formation and holds the scaffold together to yield superior strength and resistance to failure, compared to PC.
In this study, the µCT-based in silico and in situ approaches of the additive manufactured biomaterial scaffold were adopted, to evaluate the process–structure–property relationship through a holistic approach. We have been successful to model the scaffold microstructure in silico, but it was not possible to scale up that for macrostructural mechanical behavior yet. We have identified the probable cause and those limitations provide us insight for further refinement of the finite elemental simulation of complex architecture of the 3D powder-printed biomaterial scaffold. In our opinion, this fills up the void where FEA in combination with µCT imaging can be effectively applied to take on the mechanical response in relation to microstructure and processing conditions, for the 3D-printed biomaterial scaffold and our study attempts to pave the pathway to this approach. Nevertheless, in an alternative approach of in situ compression and µCT imaging and analysis, we could clearly discern the crack generation and growth for scaffolds, at microstructural level, subjected to two different post-processing conditions.
V. CONCLUSIONS
In the present study, we have utilized two different post-processing techniques to establish the microstructure–property relationship in a model 3D-printed system (POP-based), along with corresponding merits and demerits, in silico and in situ. To this end, µCT-based 3D imaging serves the basis to determine printing accuracy, microstructural characterization, in situ mechanical failure behavior, and also FE simulation. A good reproducibility of the graded pore-strut architecture was determined through µCT imaging and analysis. At individual pore level, it was shown that the reproducibility not only depends on the size but also on the presence of other features at close vicinity. A compressive strength up to 1.5 MPa was obtained with up to 55% interconnected microporosity, whereas the compressive modulus lied in the range of cancellous bone. Moreover, a µCT image-based modeling approach was adopted, in the case of 3D powder-printed complex microstructure, which, in our opinion, was not attempted before. Although, the microstructure was modeled and compression behavior was simulated with reasonable accuracy, the pathway to implement microstructural modeling to describe the macroscale mechanical behavior of 3DPP systems remains to be explored further. Finally, in situ compression along with μCT-based revealed that the layered microstructure is the main cause of failure for the as-printed scaffold, whereas the mode of crack formation and propagation can be altered or resisted with post-processing approaches. In this manner, in situ µCT imaging and intermittent compression revealed the origin of fracture and contrasting failure behavior, in relation to their distinct microstructure, resulting from two different post-processing approaches.
Supplementary Material
To view supplementary material for this article, please visit https://doi.org/10.1557/jmr.2018.188.
ACKNOWLEDGMENTS
The authors acknowledge the financial support provided by Department of Science and Technology, Government of India and Department of Biotechnology, Government of India under different research grants to carry out research activities. S. Mandal would like to thank Dr. Alok Kumar, for his encouragement at the starting of this study, Barthi R, for her assistance in acquiring XRD and SEM data, and Dr. Subhomoy Chatterjee, for earnestly extending help in the finite elemental analysis related procedures. We also thank the anonymous reviewers for their constructive criticism in improving the quality of the manuscript and the study.