I. INTRODUCTION
From a mechanistic point of view, electrode reactions in solid state electrochemistry differ significantly from their counterparts in liquid electrochemistry. In the case of liquid systems, the electrolyte is usually both an ionic conductor and a solvent for the reactive species. Thus, the electrode–electrolyte two-phase boundary (2PB) is the location where the electrochemically relevant reaction steps occur.Reference Hamann, Hamnett and Vielstich1 In solid-state electrochemistry in general, and particularly for the oxygen exchange reaction between a gas phase and a solid oxide ion conductor, an analogous situation can hardly be found. This is simply because elementary oxygen does not dissolve in most oxides (The formally electroneutral oxygen exchange of an oxide in terms of stoichiometry change is an electrochemical reaction in itself and completely different from gas dissolution in a liquid electrolyte.). Therefore, not only the electrode–electrolyte interface is relevant for oxygen reduction on solid oxide ion conductors but also the electrode–gas 2PB and the three-phase boundary (3PB) where gas phase, electrode, and electrolyte meet.Reference Fleig2,Reference Fleig3 As a consequence, several different reaction pathways for the reaction  ${\textstyle{{\rm{1}} \over {\rm{2}}}}{\rm{O}}_2 + 2{\rm{e}}^ -\! \mathbin{\lower.3ex\hbox{$\buildrel\textstyle\rightarrow\over {\smash{\leftarrow}\vphantom{_{\vbox to.5ex{\vss}}}}$}} {\rm{O}}^{2 - }$ become possible in solid-state electrochemistry, depending on the properties of the electrode and the electrolyte material.
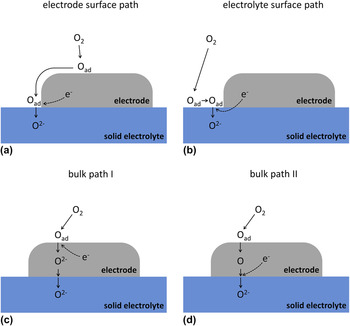
In Fig. 1, three prominent reaction pathways are sketched. Please note that the indicated reaction steps do not reflect an exact mechanistic interpretation; rather they represent one possible mechanism for each path. The first pathway—illustrated in Fig. 1(a)—is commonly referred to as electrode surface path, since the electrochemically relevant reaction steps are restricted to the electrode surface. In this case, the electrochemically active zone of oxygen incorporation into the electrolyte is generally assumed to be in close vicinity of the 3PB.Reference Fleig2,Reference Janek, Luerßen, Mutoro, Fischer and Günther4,Reference Adler5 The model system Pt(O2) | yttria-stabilized zirconia (YSZ) is often regarded to represent such a surface path systemReference Fleig2,Reference Janek, Luerßen, Mutoro, Fischer and Günther4,Reference Beck, Fischer, Mutoro, Srot, Petrikowski, Tchernychova, Wuttig, Ruhle, Luerßen and Janek6,Reference Radhakrishnan, Virkar and Singhal7 though it will be shown in the present contribution that this idealization is only valid under certain conditions. In Fig. 1(b), another kind of surface pathway is sketched, with elementary steps being restricted to the electrolyte surface—consequently, it is called electrolyte surface path. The electron supply from the electrode to the electrochemically active oxygen species proceeds via the electrolyte in this case. Therefore, a certain level of electronic conductivity in the electrolyte is required for this reaction pathway. Noble metal electrodes on acceptor-doped ceria in hydrogen-containing atmosphere have been shown to establish such a kind of reaction path.Reference Chueh, Lai and Haile8
Sketch of reaction pathways on solid electrodes. (a) Electrode surface path: only surfaces of the electrode and the TPB are involved in the reaction. (b) Electrolyte surface path: only the electrolyte surface is involved in the reaction. (c) Bulk path I: the pathway runs through the bulk of the electrode with oxygen being reduced at the electrode surface. (d) Bulk path II: similar to (c) but with the reduction step at the electrode–electrolyte 2PB.

If not only surfaces participate in the electrode reaction but also the volume of the electrode itself, further reaction pathways become possible. In the case of mixed ionic electronic conductors (MIEC), oxygen can already be reduced on the electrode surface and transported through the bulk of the electrode as oxide ion.Reference Jamnik and Maier9,Reference Jamnik and Maier10 The corresponding pathway—often called bulk path—is sketched in Fig. 1(c). Electrode materials such as (LaxSr1−x)(CoyFe1−y)O3−δ (LSCF)Reference Baumann, Fleig, Habermeier and Maier11 or (Ba,Sr)(Co,Fe)O3−δ (BSCF)Reference Wang, Merkle and Maier12 are known to exhibit this kind of reaction pathway. In Fig. 1(d), a second possibility of a bulk path is depicted, which takes into account that the charge transfer process to oxygen may also take place at the electrode–electrolyte interface rather than at the electrode surface. A sufficient solubility of a (neutral) oxygen species in the electrode material is mandatory for bulk path II. Silver electrodes on YSZ, for example, indeed exhibit this kind of bulk path.Reference Van Herle and McEvoy13
Besides the reaction pathways, also the question about the rate determining elementary step (RDS) is controversially discussed. The RDS is the kinetically slowest reaction step of the overall fastest reaction pathway. In the case of Pt(O2) | YSZ, often the charge transfer reaction at the 3PB is reported to be the bottleneck of the surface pathway.Reference Radhakrishnan, Virkar and Singhal7,Reference Wang and Nowick14,Reference Wang and Nowick15 However, other studies also discuss the adsorption of oxygen and/or the surface diffusion of adsorbed species to be rate limiting.Reference Kenjo and Shiroichi16–Reference Mizusaki, Amano, Yamauchi and Fueki20 On mixed conducting LSCF (and related materials), either an electrochemical reaction step at the electrode surface or oxygen diffusion in the electrode bulk is considered to be rate limiting.Reference van der Haar, den Otter, Morskate, Bouwmeester and Verweij21–Reference van Doorn, Fullarton, de Souza, Kilner, Bouwmeester and Burggraaf25 In the case of (La,Sr)MnO3−δ (LSM) even the predominant reaction pathway as well as the RDS are still under debate.Reference Adler5,Reference Brichzin, Fleig, Habermeier, Cristiani and Maier26–Reference la O’, Savinell and Shao-Horn29
A possible reason for the discrepancies between published results is often the fact that electrode geometries or morphologies differed for different studies. A number of experiments were performed on macroscopic samples with porous electrodes. However, the microstructural properties of such porous systems (e.g., the particle and pore sizes and the thickness of the electrode) can have significant effects on the electrode kinetics.Reference Fleig2,Reference Fleig3 For example, a change in the particle size can change the RDS, and especially when not only one reaction path is possible, even a change in the dominant pathway can occur. To systematically investigate elementary steps of electrode reactions, geometrically well-defined model electrodes have therefore been introduced to solid state electrochemistry.Reference Radhakrishnan, Virkar and Singhal7,Reference Chueh, Lai and Haile8,Reference Baumann, Fleig, Habermeier and Maier11,Reference Brichzin, Fleig, Habermeier, Cristiani and Maier26,Reference Bieberle, Meier and Gauckler30–Reference Pöpke, Mutoro, Luerßen and Janek38 Such model systems—which are usually prepared by photolithographical patterning of thin films—offer the opportunity of controlling and tuning geometric parameters such as surface area, film thickness, or TPB length. A defined variation of the electrode geometry can be extremely helpful for the electrochemical interpretation of experimental results. Moreover, morphology changes of these model type electrodes can be monitored much easier than in the case of porous systems. A summary of advantages of micropatterned electrodes is given in Ref. Reference Fleig, Baumann, Brichzin, Kim, Jamnik, Cristiani, Habermeier and Maier39.
A further powerful tool for the investigation of different reaction pathways on model electrodes is 18O incorporation in combination with laterally resolved time-of-flight secondary ion mass spectrometry (ToF-SIMS) analysis.Reference Horita, Yamaji, Sakai, Xiong, Kato, Yokokawa and Kawada40–Reference Fleig, Schintlmeister, Opitz and Hutter46 This method uses cathodic polarization of electrodes in 18O2 atmosphere to visualize electrochemically active sites. When using geometrically well-defined model electrodes, this allows distinguishing regions of different current density (e.g., 2PB and 3PB) and thus enables conclusions on the contribution of different electrochemical reaction pathways. However, experimentalists utilizing this technique have to keep the temperature sufficiently low to avoid blurring effects due to tracer diffusion in the electrolyte.Reference Opitz, Schintlmeister, Hutter and Fleig45–Reference Fleig47 Therefore, only a limited temperature range can be covered by this technique, and additional characterization by standard electrochemical methods is essential.
In the present study, the reaction pathways of oxygen reduction were investigated for different thin film electrodes on YSZ: (i) platinum, which is an oftentimes-used model system with a long history of research activities Reference Adler5,Reference Mizusaki, Amano, Yamauchi and Fueki20 ; (ii) La0.8Sr0.2MnO3−δ, which represents the state-of-the-art cathode material in commercial solid oxide fuel cells (SOFCs)Reference Minh48,Reference Wilson, Duong, Gameiro, Chen, Thornton, Mumm and Barnett49 ; and (iii) La0.6Sr0.4CoO3−δ (LSC) as well as La0.6Sr0.4FeO3−δ (LSF) representing the end members of the La1–xSrxCo1–yFeyO3−δ (LSCF) series. LSCF electrodes are particularly attractive for intermediate-temperature SOFCs. LSC (i.e., LSCF with y = 0) shows the highest conductivity and surface exchange rate within the LSCF family. It was used to prepare electrodes with very low polarization resistances and has thus attracted much interest within the last few years.Reference Søgaard, Hendriksen, Mogensen, Poulsen and Skou50–Reference Hayd, Dieterle, Guntow, Gerthsen and Ivers-Tiffée53 LSF (i.e., LSCF with y = 1) shows lower electrochemical performanceReference Baumann, Fleig, Cristiani, Stuhlhofer, Habermeier and Maier54 but is significantly more stable against reduction than LSC.Reference Kuhn, Hashimoto, Sato, Yashiro and Mizusaki51,Reference Kuhn, Hashimoto, Sato, Yashiro and Mizusaki55
Model-type electrodes were prepared from these materials by means of thin film deposition (sputtering or pulsed laser deposition) on YSZ single crystals and subsequent photolithographic patterning. The obtained geometrically well-defined electrodes were electrochemically characterized by ac as well as dc methods. By changing the electrode geometries, locations of polarization resistances could be distinguished. In addition, cathodically driven 18O tracer incorporation followed by ToF-SIMS analysis was carried out on all materials to gain information about the contributions of different oxygen incorporation sites and thus on the relevance of different electrochemical reaction pathways.
II. EXPERIMENTAL
A. Sample preparation
1. Platinum electrodes
Platinum thin films were prepared by sputter deposition (target: 99.95% Pt, OEGUSSA, Vienna, Austria; sputter machine: BAL-TEC MED 020, BAL-TEC AG, Balzers, Liechtenstein) onto YSZ (100) single crystals (Crystec, Berlin, Germany). The Ar pressure during the sputter process and the sputter current were 2 × 10⁻² mbar and 100 mA, respectively. Resulting film thicknesses were about 400 nm. For high temperature measurements (above 700 °C), the YSZ substrate was heated during the Pt deposition to temperatures of approximately 700–800 °C. These microelectrodes were prepared from the thin films by standard photolithography followed by an etching step in hot nitrohydrochloric acid. Subsequently, the samples were annealed for at least 48 h at 800 °C to obtain sufficiently stable and dense thin film electrodes. In the following, such kinds of samples are referred to as “high temperature (HT)-prepared.” Since this preparation route was quite laborious, electrodes for measurements below 700 °C were prepared by sputter deposition of Pt without heating the YSZ substrate. Microstructuring was then performed by lift-off photolithography. These electrodes were subsequently annealed at 750 °C for 2 h and called “low temperature (LT)-prepared” throughout the text.
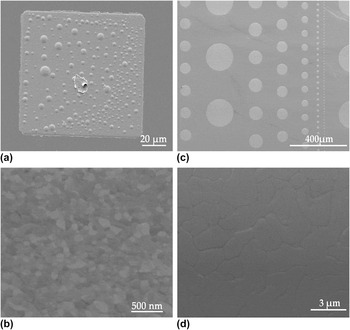
Both routes yielded highly (111) textured Pt thin films as shown in Refs. Reference Opitz and Fleig36 and Reference Opitz, Lutz, Kubicek, Kubel, Hutter and Fleig56. The chosen electrode shapes were either circles of various diameter or squares, depending on the requirements of the experiments. Scanning electron microscopy (SEM) images of the microelectrodes as well as of the Pt surface are given in Fig. 2 where (a) and (b) show a LT-prepared squarish Pt electrode and a magnification of a LT-prepared Pt surface, respectively. The dots on the electrode in Fig. 2(a) are bubbles or hillocks, which usually evolved at LT-prepared electrodes upon the first heat treatment. A likely explanation for the formation of these hillocks is a partial dewetting of the oxide by the Pt film—comparable structures were also reported for Ni thin films on YSZ.Reference Ehn, Høgh, Graczyk, Norrman, Montelius, Linne and Mogensen57 Nonetheless, since the bubbles are gas tight, they are expected to not affect the faradaic reaction pathways.Reference Opitz, Lutz, Kubicek, Kubel, Hutter and Fleig56Figures 2(c) and 2(d) depict circular Pt electrodes and a magnification of Pt deposited via the HT route. Both preparation methods (HT and LT) yield dense thin films, but the grains of LT-prepared Pt were significantly smaller than those of HT-prepared—compare Figs. 2(b) and 2(d).
SEM images of Pt electrodes. (a) LT-prepared squarish 100 × 100 μm2 electrode with dent in the center originating from the contact tip; the circular structures are (gastight) blisters. (b) Surface of LT-prepared Pt thin films—no pores are visible indicating gas tightness. (c) HT-prepared circular electrodes of varying diameters. (d) Surface of HT-prepared Pt indicating significantly larger grains than in the case of LT-prepared films. Again the film is gas tight.

2. Perovskite-type electrodes
Thin films of perovskite-type La0.6Sr0.4CoO3−δ (LSC), La0.6Sr0.4FeO3−δ (LSF), and La0.8Sr0.2MnO3−δ (LSM) were prepared by pulsed laser deposition (PLD) onto YSZ (100) single crystals (Crystec, Germany). The LSC and LSF targets were obtained by powder synthesis via the nitrate route (“Pechini-method”)Reference Januschewsky, Ahrens, Opitz, Kubel and Fleig52 and subsequent pressing and sintering (1200 °C, 12 h). The LSM target was prepared by pressing and sintering (1250 °C, 5 h) of the commercial powder (Aldrich, St. Louis, MO). Ablation of the targets was performed by a KrF excimer laser (COMPex Pro 201 F, Lambda Physics, Göttingen, Germany) with 248 nm wave length. The beam was pulsed with 5 Hz at a beam energy of 400 mJ per pulse. The oxygen base pressure in the PLD-chamber was set to 4 × 10⁻² mbar. The YSZ substrate temperature was monitored by a pyrometer (Heitronics, Wiesbaden, Germany), and temperatures of 650 °C were applied for deposition of LSC and LSF and about 700 °C for LSM deposition. Micropatterning of the LSC, LSF as well as LSM films was done by standard photolithography and subsequent wet chemical etching in diluted HCl. Both squarish (100 × 100 μm2) and circular-shaped microelectrodes with varying diameters (50–200 μm) were obtained by this method.
With the given parameters of deposition, the preparation of dense thin films was already achieved in one of our previous studies.Reference Kubicek, Limbeck, Fromling, Hutter and Fleig58 A detailed demonstration of the density of the present films by transmission electron microscopy studies would, however, be beyond the scope of the present study. In the 18O tracer experiments in Sec. IV, uniform tracer fractions beneath the thin films were obtained. Therefore, pore free oxide thin films and thus 3PB-lengths being exclusively defined by the perimeter of the electrodes can safely be assumed.
It is moreover worth mentioning that the chemical properties of the 3PB as well as the surface of photolithographically micropatterned thin film electrodes can slightly deviate from those of porous paste electrodes used in SOFCs resulting in slightly different electrocatalytic activities. Possible reasons are the different thermal as well as chemical prehistories of thin film and powder-based electrodes. The aim of the present study, however, is not the exact evaluation of resistivity values rather than the separation and identification of different oxygen reduction pathways. For this purpose, these slight differences in electrocatalytic properties can be assumed to play only a minor role.
B. Electrochemical characterization
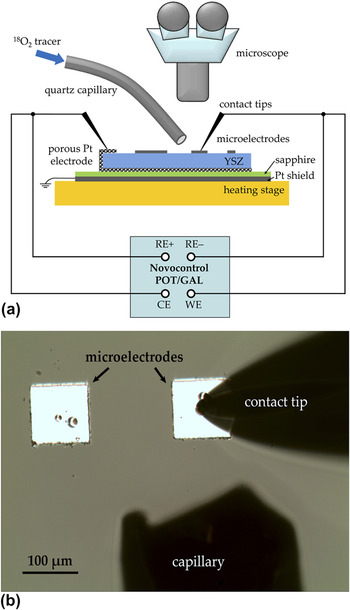
A sketch of the setup for electrochemical measurements is depicted in Fig. 3(a). For measurements at elevated temperature, the sample is placed onto a heating stage (Linkam, Surrey, UK). Individual microelectrodes are electrically contacted by Pt/Ir or Au-coated steel tips, which can be precisely positioned by means of micromanipulators (Newport, CT) under a microscope (Mitutoyo, Kawasaki, Japan). For electrochemical measurements, an Alpha-A high performance frequency analyzer (Novocontrol, Hundsangen, Germany) with ZG-4 or POT/GAL 30V 2A interface was used (The first one allows only impedance measurements, the latter one both ac and dc measurements.). Electrical shielding was ensured by a grounded Pt sheet placed between sample and heating stage. It was electrically insulated from the sample by a thin sapphire disk. For 18O tracer incorporation experiments, the setup is optionally equipped with a quartz capillary for local supply of 18O2. In Fig. 3(b), a view through the microscope is shown during a tracer incorporation experiment on a 100 × 100 μm2 electrode.
(a) Sketch of the experimental setup for electrochemical measurements (ac and dc). The quartz capillary was used in 18O incorporation experiments to locally supply the tracer to the contacted microelectrode. (b) View through the microscope during an 18O incorporation experiment.

The frequency range of electrochemical impedance measurements was usually between 1 mHz and 1 MHz but was adjusted if necessary. The root-mean-square value of the ac voltage was 10 mV to ensure a linear response. On samples with Pt, LSM, or LSF microelectrodes, a porous Pt counter electrode was applied. Owing to its orders of magnitude larger size, the polarization resistance of the counter electrode can safely be neglected and the measurement can be conducted in a 2-point setup. On LSC samples with porous Pt counter electrode, this simplification may not be valid due to the fast oxygen exchange kinetics of LSC. Thus, an approximately 10–30 mm2 large LSC stripe (obtained by photolithography) was used as the counter electrode; its polarization resistance can also be neglected. The asymmetrical heating on the heating stage and an additional cooling effect caused by the tip are responsible for a temperature gradient across the sample. The spreading resistance of ion conduction in YSZ was therefore evaluated from impedance spectra and used to calculate the effective microelectrode temperature by the method introduced in Ref. Reference Opitz and Fleig36.
Current–voltage curves were recorded with a Novocontrol POT/GAL 30V 2A in dc mode (software: WinCHEM, Novocontrol). The voltage was held constant until the current had reached a steady state (i.e., until the typical charging of the interfacial capacitor was completed). Overpotentials of the microelectrodes were calculated by subtracting the voltage drop in the electrolyte; the ohmic resistance of the electrolyte was obtained by impedance measurements.
C. Tracer incorporation and ToF-SIMS measurements
As already mentioned above, the 18O tracer incorporation experiments were also performed in the setup shown in Fig. 3(a). Temperatures between 270 and 380 °C were chosen to keep the effect of 18O tracer diffusion in YSZ as small as possible.Reference Opitz, Schintlmeister, Hutter and Fleig45,Reference Fleig, Schintlmeister, Opitz and Hutter46 For tracer incorporation, a cathodic voltage was applied to a single squarish 100 × 100 μm2 microelectrode. During the first 100–200 s the polarized electrode was exposed to ambient air to minimize the capacitive currents during the subsequent tracer incorporation. Then 18O2 (97.1% isotope enriched, Campro Scientific, Germany) was locally supplied to the polarized electrode by means of the capillary shown in Fig. 3 (approximate flow rate: 2 mL/min). The tracer incorporation process was usually carried out for 600 s (or 300 s in the case of highly active LSC electrodes). After this period, the electrode was disconnected and the sample immediately quenched to room temperature. Subsequently, the electrodes were removed by wet-chemical etching (Pt: hot nitrohydrochloric acid; oxide electrodes: diluted HCl). This step provides a smooth surface without height differences and thus avoids shadowing effects in SIMS measurements. Moreover, it eliminates possible SIMS artifacts caused by extraction field distortions. Such effects could originate from different electrostatic charging of the electrode and YSZ during the dynamic sputter process.
The ToF-SIMS measurements were performed on a TOF-SIMSReference Adler5 (IONTOF, Germany) in “burst alignment” (BA) mode or in the novel “collimated burst alignment” (CBA) modeReference Holzlechner, Kubicek, Hutter and Fleig59,Reference Kubicek, Holzlechner, Opitz, Larisegger, Hutter and Fleig60 with 25 kV Bi+ as primary ions. Images were recorded with a raster of 512 × 512 or 256 × 256 pixels. The CBA mode offers a resolution below 100 nm and was thus used for recording detailed tracer distribution images (between 25 × 25 and 12 × 12 μm2). Lateral profiles were obtained from the distribution images by line integration. Tracer fractions were calculated from these integrated intensitiesReference De Souza, Zehnpfenning, Martin and Maier61,Reference Sakaguchi and Haneda62 and plotted versus the lateral position. For more details regarding the ToF-SIMS measurements, the reader is referred to Refs. Reference Opitz, Schintlmeister, Hutter and Fleig45 and Reference Holzlechner, Kubicek, Hutter and Fleig59.
III. PLATINUM ELECTRODES
A. Impedance spectroscopy measurements
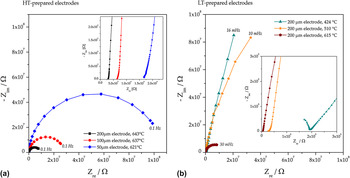
Impedance spectra measured on circular-shaped Pt electrodes are depicted in Fig. 4 where (a) shows measurements on HT-prepared electrodes of different size and (b) measurements on circular 200 μm electrodes prepared via the LT route. Spectra measured above 550 °C exhibit three different features: (i) an axis intercept in the high frequency region (visible in the insets of Fig. 4), which is attributed to the spreading resistance of ion conduction in the electrolyte.Reference Baumann, Fleig, Habermeier and Maier11,Reference Fleig31 This electrolyte resistance was used for the calculation of effective electrode temperatures as follows: from the YSZ resistance, an ionic conductivity was calculated,Reference Newman63 and by means of the known temperature-conductivity relationship of the used YSZ single crystals, the temperature could be obtained. For details regarding this procedure, the reader is referred to Ref. Reference Opitz and Fleig36. (ii) A medium frequency shoulder which can be attributed to a capacitively blocked electrochemical process at the Pt–YSZ interface.Reference Opitz and Fleig36,Reference Opitz, Horlein, Huber and Fleig64 Since the corresponding polarization resistance is orders of magnitude lower than the dominating one and does not contribute to a faradaic current, this pathway will not be discussed in the present paper. (iii) A dominating semicircle in the low frequency part of the spectra reflecting the rate limiting elementary step of the electrochemical electrode reaction.Reference Radhakrishnan, Virkar and Singhal7,Reference Opitz and Fleig36,Reference Opitz, Lutz, Kubicek, Kubel, Hutter and Fleig56
Impedance spectra (Nyquist plots) of platinum electrodes; electrode sizes and measurement temperatures are given in the legends. The insets show magnifications of the high frequency parts of the spectra. (a) Spectra of Pt electrodes prepared via the HT route. (b) Spectra of Pt electrodes prepared via the LT route.

Obviously, the electrode polarization resistance (i.e., the diameter of the low frequency arc) significantly depends on the electrode size—see Fig. 4(a). Unfortunately, a quantitative comparison of the spectra is not straightforward, since differently sized electrodes at a given set temperature exhibit different effective temperatures. This can be explained by the different cooling caused by the tip contact.Reference Opitz and Fleig36 At about 500 °C and below, the YSZ bulk semicircle becomes visible [see the inset in Fig. 4(b)], while the shape of the main electrode impedance feature remains qualitatively the same as for high temperature measurements. However, the temperature dependence of the dominant arc changes at lower temperature: as shown in Fig. 4(b), the measurements at 424 and 510 °C differ significantly less than the measurements at 510 and 615 °C, despite a comparable temperature difference. This behavior can already be regarded as a hint for a change in the activation energy of the rate limiting step and thus in the reaction mechanism.
B. Arrhenius plots and geometry dependence of the rate determining step
Parameterization of the impedance data was done by complex nonlinear least square (CNLS) fits utilizing the software ZView (Scribner, Southern Pines, NC). In the simplest case, two R-CPE elements can be used to fit the electrode feature (CPE denotes a constant phase element) with the sum of both resistors exhibiting the electrode's polarization resistance. A more complex but physically interpretable model was discussed in Ref. Reference Opitz, Horlein, Huber and Fleig64 yielding virtually the same dc polarization resistance as the simplified circuit mentioned above, but different capacitances. For the extraction of the dc value of the electrode resistance, both methods can be applied. Due to the smallness of the high frequency shoulder, conclusions regarding the RDS are not affected by the data analysis.
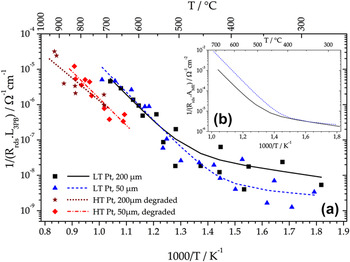
In Fig. 5(a), an Arrhenius diagram of 3PB-length-related inverse polarization resistances is plotted. The measurements on LT-prepared Pt electrodes were carried out between 270 and 750 °C, and data obtained on 200 and 50 μm electrodes are shown. As already supposed from the spectra in Fig. 4(b), the activation energy of the polarization resistance significantly changes around 500 °C, indicating a transition between two different RDS. Moreover, the situation with high activation energy at high temperatures and low activation energy at lower temperatures is a clear indication of a parallel connection of the two reaction pathways.Reference Opitz, Lutz, Kubicek, Kubel, Hutter and Fleig56 The fit equation for such a situation—two Arrhenius-type activated processes connected in parallel—reads
 $$Y_{{\rm{rds}}} = Y_1^0 \times {\rm{e}}^{ - {\textstyle{{E_{a,1} } \over {k_{\rm{B}} T}}}{\rm{ }}} + Y_2^0 \times {\rm{e}}^{ - {\textstyle{{E_{a,2} } \over {k_{\rm{B}} T}}}{\rm{ }}} \quad ,$$
and leads to the fit curves of the LT-prepared Pt data shown in Fig. 5.Reference Opitz, Lutz, Kubicek, Kubel, Hutter and Fleig56 Therein, Y rds denotes the inverse total polarization resistance,  $Y_{\rm{1}} ^{\rm{0}}$ and
 $Y_{\rm{2}} ^{\rm{0}}$ the pre-exponential factors of the RDS of the two paths, E a,1 and E a,2 the corresponding activation energies, k B Boltzmann's constant, and T the temperature. The activation energies amount to 1.55 ± 0.10 and 0.2 ± 0.15 eV for the high and low temperature regimes, respectively. Interestingly, the steeper branches of the fit curves coincide in the 3PB-length normalized plot, indicating a rate-limiting elementary step at the 3PB. For comparison, the fit curves are also shown in the area-related Arrhenius plot in Fig. 5(b). In this diagram, the shallow branches coincide, demonstrating the corresponding RDS to be located at a 2PB (surface or interface) or in the electrode bulk.
Arrhenius plots of geometry-related inverse polarization resistances of Pt electrodes. (a) 3PB-length related data obtained on both HT- and LT-prepared Pt electrodes. (b) Area related fit curves of data from LT-prepared Pt electrodes [i.e., the area related solid and dashed curves from (a)].

The HT-prepared electrodes were only characterized in the high temperature regime (650–930 °C). Again a 3PB-length-related behavior was found for the polarization resistance as can be concluded from the coinciding fit curves of 200- and 50-μm electrode data—Fig. 5(a). The mean activation energy of about 1.4 eV is in acceptable agreement with the value measured for LT-prepared Pt electrodes (differences can most likely be explained by the scatter of data points in Fig. 5). However, the absolute value of the inverse polarization resistance is about an order of magnitude lower than in the case of LT-prepared electrodes. It was already discussed in Refs. Reference Opitz, Lutz, Kubicek, Kubel, Hutter and Fleig56 and Reference Opitz, Horlein, Huber and Fleig64 that this difference is strongly influenced by the thermal prehistory of the electrodes. In these studies, impurities accumulating at the 3PB were supposed to be the origin of the electrodes variability. A detailed discussion of impurity-related effects on the polarization resistance, however, is beyond the scope of the present study and is given in a separate paper.Reference Hoerlein, Opitz and Fleig65 There it will also be shown that HT-prepared Pt electrodes with different annealing treatments can show even better performance than the LT-prepared electrodes in Fig. 5.
C. Current–voltage characteristics at higher temperatures
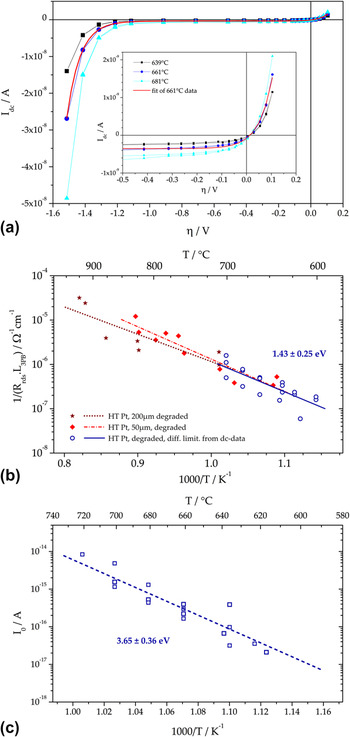
Steady state current–voltage curves were recorded on HT-prepared Pt electrodes between 600 and 700 °C and for dc voltages between +0.1 and −1.5 V. Each voltage set-point was held constant until the current reached a steady state (usually 200 s, which is in good agreement with the impedance results—see Fig. 4). This current is plotted versus the electrode overpotential η and the resulting diagram is shown in Fig. 6(a); η was calculated by subtracting the ohmic voltage drop in YSZ (R YSZ·I dc) from the applied voltage. The shape of the curves is rather uncommon: in the anodic part, an exponential current increase can be observed. At moderate cathodic polarization, the electrodes exhibit a limiting current; and at very high cathodic overpotentials, again an exponential current–voltage relationship is found. Usually, in electrochemistry, the exact opposite is found: an exponential current–voltage behavior at low and a limiting current caused by transport limitations at high polarization values.
(a) Current–voltage curves measured on HT-prepared Pt electrodes (circular shaped, 100 μm) in the higher temperature regime. The solid red line shows the fit of the 661 °C curve using Eq. (2). (b) Arrhenius plot showing the comparison of the differential resistance at η = 0 V calculated from dc curves (open circles) with data from ac measurements (closed symbols). (c) Arrhenius plot of the fit parameter I 0 in Eq. (2), which is relevant in the exponential part of the η–I-curve (at high cathodic polarization).

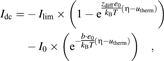
The present case can be explained by again assuming two parallel pathways of oxygen incorporation: (i) one pathway with rate-limiting diffusion, dominating at low and moderate overpotentials and (ii) a pathway with an RDS exhibiting exponential current–voltage characteristics upon high cathodic polarization. This can be quantified by
 $$I_{{\rm{dc}}} = - I_{{\rm{lim}}} \times \left( {1 - {\rm{e}}^{{\textstyle{{z_{{\rm{diff}}} e_0 } \over {k_{\rm{B}} T}}}({\rm{\eta }} - u_{{\rm{therm}}} )} } \right) - I_0 \times\left( {{\mathop{\rm e}\nolimits} ^{ - {\rm{ }}{\textstyle{{b \cdot e_0 } \over {k_{\rm{B}} T}}}({\rm{\eta }} - u_{{\rm{therm}}} )} } \right)\quad ,$$
where I dc denotes the total dc current, I lim the limiting current of the diffusive process, z diff the effective charge related to the diffusing particle, I 0 the pre-exponential fit parameter and b a fit parameter of the exponential process relevant for high polarization, η the overpotential, u therm the thermovoltage (which is caused by asymmetric heating and tip contactReference Opitz and Fleig36) and e 0 the elementary charge. In Fig. 6(a), the fit of the 661 °C curve with Eq. (2) is given by the bold solid line (in red) indicating a good accordance of measurement and model.
From the fit results, the differential resistance of the diffusion-limited process at η = 0 V was calculated. This parameter is expected to be obtained by an impedance measurement under equilibrium conditions. In the Arrhenius plot in Fig. 6(b), the inverse 3PB-length-related differential resistance from dc measurements (open circles) is compared with the ac results on identically prepared electrodes from Fig. 5 (please note: besides comparable preparation, the electrodes also exhibited comparable thermal prehistory). Indeed the data are in excellent accordance in terms of both absolute values and slopes of the Arrhenius fit curve (activation energy obtained from dc data: 1.43 ± 0.25 eV). Consequently, the 3PB-related rate-limiting step at high temperatures and close to equilibrium can be regarded as a diffusion process. It is highly realistic that the diffusion limitation is caused by the presence of impurities at the 3PB. Impurities such as silicon oxide and various alkaline earth oxides are frequently discussed in literature to have tremendous impact on the performance of Pt electrodes.Reference Hertz, Rothschild and Tuller32,Reference Mutoro, Luerßen, Günther and Janek34,Reference de Ridder, Vervoort, van Welzenis and Brongersma66–Reference Mutoro, Baumann and Janek71 The assumption of impurities hampering the oxygen exchange rate at the 3PB might also explain the dependence of the polarization resistance on pretreatment as already mentioned in Sec. III. B. Different thermal prehistories are expected to cause different amounts of impurities accumulating at the 3PB and thus different polarization resistances can be measured. A more detailed discussion on the influence of impurities on the 3PB kinetics of Pt electrodes will be given in a forthcoming paper.Reference Hoerlein, Opitz and Fleig65
The fit parameter I 0, which represents the exchange current of the exponential process, is plotted in the Arrhenius diagram in Fig. 6(c). Interestingly, the activation energy of 3.65 ± 0.36 eV is uncommonly high for electrode processes of Pt(O2) | YSZ. However, stoichiometry polarization in YSZ can explain such a high activation energy owing to the following considerations: the 3PB of Pt electrodes on YSZ is electrochemically highly resistive [see the limiting current in Fig. 6(a)], whereas the counter electrode is reversible. Upon cathodic polarization, the corresponding chemical potential of oxygen at the Pt | YSZ interface is strongly decreased and therefore the electron concentration in YSZ increases.Reference Janek and Korte72 This effect is most pronounced directly beneath the electrode with decaying electron concentration along the free electrolyte surface. For sufficiently high electron concentrations in YSZ, the additional pathway for oxygen reduction at the free YSZ surface becomes active. The increased oxygen reduction current along the free YSZ surface can indeed be visualized by means of tracer incorporation experiments as shown in Sec. III. E. Similar to classical Wagner–Hebb-type stoichiometry polarization,Reference Maier73 the local electron concentration can be expected to depend exponentially on the overpotential. This would explain the observed current–voltage characteristics at high cathodic polarization. A more detailed discussion (see Ref. Reference Opitz, Horlein, Huber and Fleig64) shows that the activation energy of the parameter I 0 may simply reflect the temperature dependence of electronic conductivity in YSZ. This interpretation is supported by the good accordance of our results (3.65 ± 0.36 eV) with literature data for the activation energy of electron conduction: 3.88 eV (8 mol% Y2O3-stabilized zirconia)Reference Park and Blumenthal74 and 3.7 eV (15 mol% CaO-stabilized zirconia).Reference Heyne and Beekman75 A similar reaction pathway was also reported for noble metal electrodes on Sm-doped ceria under reducing conditions (i.e., at low oxygen partial pressure).Reference Chueh, Lai and Haile8
D. Current–voltage characteristics at lower temperatures
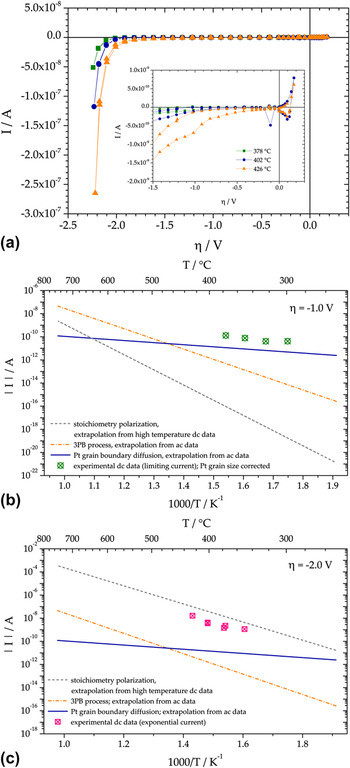
To obtain information about the nature of the RDS at lower temperature, dc curves on LT-prepared Pt electrodes were also measured at temperatures between 280 and 450 °C. The set voltages were between +0.2 and −2.5 V, and the resulting current–overpotential curves are shown in Fig. 7(a). The shape of the curves is very similar to those measured at higher temperatures with a kind of limiting current at low and moderate polarization and an exponential part at high cathodic overpotentials. Consequently, also at lower temperatures, a parallel connection of two pathways, with a rate limiting diffusion process close to equilibrium conditions and stoichiometry polarization at high cathodic polarization, is suggested. However, as discussed in Sec. III. B, the RDS of oxygen exchange close to equilibrium changed from a 3PB-related process to an area-related one when decreasing the temperature. Owing to this conclusion, the diffusion-limited process at lower temperatures cannot be related to the 3PB but has to be attributed to a 2PB or the bulk of the electrode. The transport of oxygen through the electrode along Pt grain boundaries is a very likely process yielding a cathodic limiting current, which scales with the area of the electrode and has relatively low activation energy.Reference Opitz, Lutz, Kubicek, Kubel, Hutter and Fleig56,Reference Schmiedl, Demuth, Lahnor, Godehardt, Bodschwinna, Harder, Hammer, Strunk, Schulz and Heinz76,Reference Stumpf, Liu and Tracy77
(a) Current–overpotential characteristics of LT-prepared Pt electrodes (100 μm, circular) at three different temperatures. The inset shows a magnification of the region with moderate cathodic polarization. (b) Expected dc currents for η = −1 V calculated for circular 100-μm electrodes from ac and dc data by extrapolation to lower temperatures (lines) compared with measured limiting currents (symbols). (c) Expected dc currents for η = −2 V calculated for circular 100-μm electrodes from ac and dc data extrapolated to lower temperatures (lines) compared with measured exponential currents (symbols).

Unfortunately, a quantification of the current–voltage curves as in Sec. III. C and an analysis of the temperature dependence of the fit parameters are not straightforwardly possible for low temperatures. Because of the high polarization resistance at such low temperatures, even within 1000 s, a steady state could not be reached for cathodic polarization between 0 and −2 V [see also the low characteristic frequency of the electrode impedance in Fig. 4(b)]. Thus, it was not possible to obtain true dc curves within meaningful measurement times—see the inset in Fig. 7(a)—and the I–η curves cannot be analyzed by fitting with Eq. (2). Instead, measurements at η ≈ −1 V, i.e., in the potential range of the limiting current, were conducted between 300 and 380 °C with measurement times of 104 s. Within this time, a steady state could indeed be reached. In Fig. 7(b), the measured limiting currents for η = −1 V are plotted in an Arrhenius diagram. Again a rather uncommon temperature dependence is found with a very low activation energy of approximately 0.5 eV. This indicates that the 3PB-related diffusion limitation—which is activated with about 1.4–1.6 eV—is not relevant here. The data points can also be compared with the currents resulting in different reaction pathways when extrapolating the ac and dc data discussed above to lower temperatures. The measured limiting currents at η = −1 V are in acceptable agreement with the current expected from ac measurements—i.e., resistances that scale with the inverse electrode area (solid line). Consequently, the 3PB process and thus the Pt surface path can definitely be excluded to be responsible for the limiting current at lower temperature and moderate cathodic polarizations. Rather, diffusion of oxygen through Pt is rate limiting—see the bulk path II in Fig. 1(d).
The same type of measurements and comparison was performed for η = −2 V, and the results are shown in Fig. 7(c). Clearly, the measured steady state current values coincide best with those extrapolated for the YSZ surface path (stoichiometry polarization, dashed line). Hence, we conclude that also for lower temperatures, the exponential part of the I–η curve predominantly reflects oxygen reduction via the YSZ surface pathway, controlled by stoichiometry polarization. It is worth mentioning that the activation energy of these steady state currents and also of the extrapolated values from the second term in Eq. 2, differ from those of I 0 by b·e 0·η. Thus, they are substantially lower than the 3.65 eV plotted for I 0 in Fig. 6(c).
E. Visualization of electrochemically active sites by 18O tracer incorporation
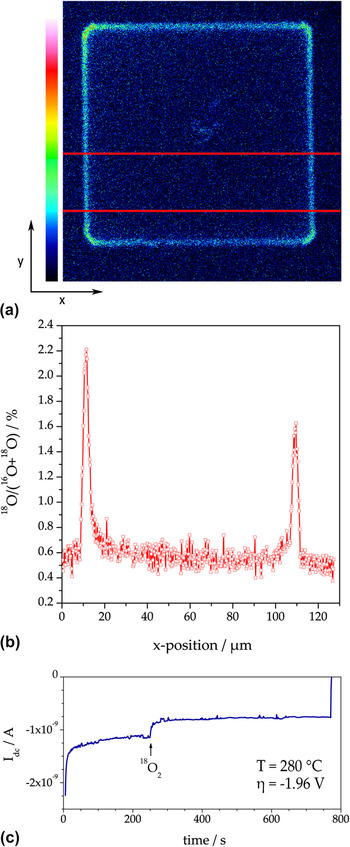
Tracer incorporation measurements on LT-prepared Pt electrodes were carried out at about 280 °C to minimize the inevitable blurring effect caused by diffusion of the incorporated 18O in the YSZ bulk.Reference Opitz, Schintlmeister, Hutter and Fleig45,Reference Fleig, Schintlmeister, Opitz and Hutter46 However, owing to these low temperatures, the cathodic overpotentials need to be in the range of −2 V to incorporate sufficient amounts of tracer oxygen (about three times the natural abundance), i.e., to achieve satisfying signal-to-noise ratios in the subsequent ToF-SIMS measurements. From Fig. 7(c) and the results discussed above, it can be expected that for such conditions, the electrolyte surface path as well as the pathway via Pt grain boundaries are electrochemically active and hence may contribute to the cathodic tracer incorporation current. In Fig. 8(a), the 18O distribution in YSZ is shown after polarizing a 100 × 100 μm2 electrode (T = 280 °C; η = −1.96 V; Pt electrode removed before SIMS measurement). The corresponding cathodic dc current during the incorporation experiment is depicted in Fig. 8(c); the current drop after starting the tracer supply can be explained by the cooling effect due to the tracer gas stream. The lateral profile of the tracer fractionReference De Souza, Zehnpfenning, Martin and Maier61,Reference Sakaguchi and Haneda62 along the x-direction—shown in Fig. 8(b)—was calculated by integration of the tracer intensity along y-direction within the highlighted area in (a). Since the tracer image was recorded in “burst alignment” mode, the lateral tracer fraction profile in (b) exhibits reduced resolution and a somewhat higher noise. However, three distinct regions of oxygen incorporation can already be distinguished from these data: (i) significant oxygen incorporation in a region close to the 3PB, (ii) oxygen incorporation beneath the Pt electrode, and (iii) conventional (thermally driven) tracer exchangeReference Kilner, Skinner and Brongersma78,Reference Kawada, Masuda, Suzuki, Kaimai, Kawamura, Nigara, Mizusaki, Yugami, Arashi, Sakai and Yokokawa79 on the YSZ surface also in some distance from the electrode.
(a) 18O distribution image (intensity plot) obtained on a 100 × 100 μm2 LT-prepared Pt electrode. Temperature and overpotential during tracer incorporation were 280 °C and η = −1.96 V, respectively. (b) Lateral profile (tracer fraction versus x-position) obtained from integration of the intensity in y-direction between the two horizontal lines in (a). (c) Current recorded during the incorporation experiment. The beginning of the tracer supply is indicated by an arrow.

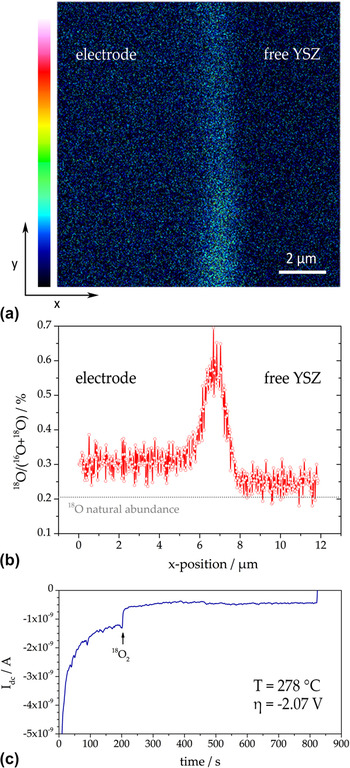
To obtain data of higher quality, the ToF-SIMS measurements were also carried out in a novel mode—referred to as “collimated burst alignment” (CBA) modeReference Holzlechner, Kubicek, Hutter and Fleig59,Reference Kubicek, Holzlechner, Opitz, Larisegger, Hutter and Fleig60 —on a similarly treated electrode. The CBA mode allows a significantly higher spatial resolution and a more reliable determination of the tracer fraction in YSZ. The distribution image obtained at the edge of a LT-prepared Pt electrode (electrode chemically removed) is shown in Fig. 9(a). The temperature and overpotential during the tracer experiment were 278 °C and −2.07 V, respectively [the current was around 0.5 nA—see Fig 9(c)]. In the distribution image, the former 3PB is oriented along y-direction.
(a) 18O distribution image (12 × 12 μm2) measured at the edge of a squarish LT-prepared Pt electrode. Temperature and overpotential during tracer incorporation were 278 °C and η = −2.07 V, respectively. (b) Lateral profile (tracer fraction versus x-position) obtained from integration of the intensity along y-direction in (a). (c) Current recorded during the incorporation experiment; the arrow indicates the beginning of tracer supply.

The lateral 18O fraction profile in Fig. 9(b) was obtained by line integration along the entire image height (y-direction) of (a). Again three tracer incorporation regions can clearly be distinguished: beneath Pt, close to the 3PB, and at the electrochemically unaffected YSZ surface. From the tracer fractions at the 3PB and beneath the electrode, a current ratio I 3PB:I area ≈ 1:4 can be estimated; I 3PB denotes the current via a surface path (i.e., via the 3PB) and I area the current via the bulk pathway, most probably along Pt grain boundaries (with oxygen incorporation at the entire interface area). On a first glance, this result contradicts the extrapolations in Fig. 7. However, this deviation can easily be explained by the relatively broad confidence intervals of activation energies used for the extrapolations. For example, a value of 3.9 eV for stoichiometry polarization (instead of 3.65 ± 0.36 eV; see Sec. III. C) and 0.13 eV for Pt grain boundary diffusion (instead of 0.2 ± 0.15 eV; see Sec. III. B) would indeed yield the above mentioned current ratio I 3PB:I area ≈ 1:4. The current ratio estimated from tracer experiments is thus still within the experimental error of electrochemical ac and dc measurements.
Consequently, the increase in tracer fraction close to the 3PB is caused by oxygen incorporation via an electrolyte surface path rather than by the “classical” electrode surface path relevant at high temperatures and lower polarizations [compare also Figs. 1(a) and 1(b)]. The electrode is strongly ion blocking, and therefore, the concentration of electrons in YSZ regions close to the electrode is increased upon high cathodic overpotentials (stoichiometry polarization; see also Sec. III. C). This high electron concentration along the free YSZ opens the pathway for oxygen incorporation at the electrolyte surface and thus an increased tracer intensity close to the 3PB can be observed in the 18O incorporation experiments.
F. Summary of oxygen reduction pathways identified on Pt–YSZ
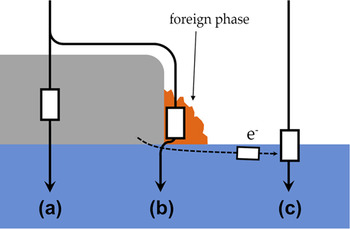
Under equilibrium conditions, two different faradaic reaction pathways could be separated—see Fig. 10: at lower temperatures, a path through the Pt electrode is the fastest one with oxygen diffusion along grain boundaries being rate limiting—path (a). At higher temperatures, a parallel pathway outperforms this bulk path in terms of exchange rates; illustrated by path (b) in Fig. 10. It corresponds to the classical surface path often discussed in the literature and its RDS is located at the 3PB. Oxygen diffusion through a foreign phase at the 3PB is believed to be the elementary process responsible for rate limitation, at least for the Pt and YSZ used in our studies.
Sketch of faradaic pathways of oxygen reduction on Pt electrodes. (a) Bulk path with rate limiting oxygen diffusion along Pt grain boundaries. (b) Electrode surface path with a rate limiting diffusion through a foreign phase at the 3PB. (c) Electrolyte surface path with rate limiting electron supply via the electrolyte (stoichiometry polarization of YSZ).

A third pathway comes into play at very high cathodic overpotentials owing to stoichiometry polarization of YSZ and the associated changes in electron concentration close to the electrode. For high as well as low temperatures, this increased electron concentration opens an electrolyte surface path, which is connected in parallel to the above-mentioned electrode surface and bulk pathways—see Fig. 10(c).
IV. TRACER INCORPORATION EXPERIMENTS ON PEROVSKITE-TYPE ELECTRODES
In the previous section, cathodic 18O incorporation was shown to be a suitable method to visualize electrochemically active zones and different reaction pathways of Pt electrodes on YSZ. Consequently, application of this technique to other electrode materials—such as perovskite-type oxides used as SOFC cathodes—is highly attractive. Indeed the method was first applied to Sr-doped LaMnO3 electrodes.Reference Horita, Yamaji, Sakai, Yokokawa, Kawada and Kato42
A. La0.6Sr0.4CoO3−δ (LSC)
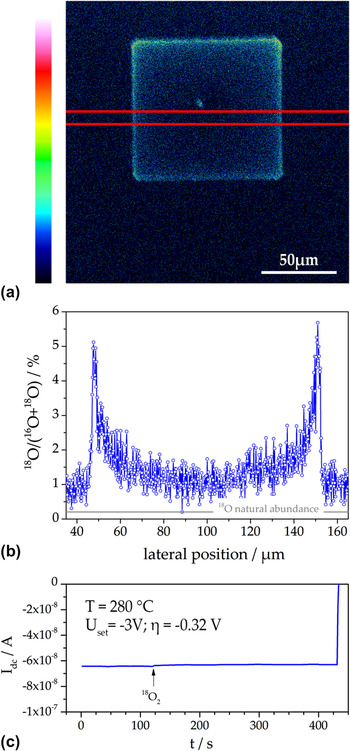
The tracer incorporation experiment on LSC electrodes was carried out as mentioned in Sec. II. C. The temperature was 283 °C and the incorporation time was set to 300 s. The electrode polarization resistance was much lower than for Pt and a sufficiently high level of incorporated tracer could be reached much easier than for Pt. A very high tracer fraction (above ca. 10 %) could even lead to a profile blurring caused by field migrationReference Fleig47 and was therefore not aimed at. The dc current during tracer incorporation at a set voltage of −3 V is shown in Fig. 11(c). From this dc current and the electrolyte resistance (measured by impedance spectroscopy, not shown), a cathodic overpotential η = −0.32 V was calculated. This value and the set value of −3 V already indicate that only about 10% of the voltage drops at the electrode and thus the electrolyte resistance determines the current.
(a) Tracer distribution (18O intensity plot) measured in YSZ by ToF-SIMS after cathodic polarization (U set = −3 V; η = −0.32 V) at 283 °C and then removing the LSC electrode. (b) Lateral tracer profile (18O fraction) obtained from line integration between the two red lines in (a). (c) dc current measured during tracer incorporation.

The 18O tracer distribution image measured by ToF-SIMS after removing the LSC electrode by wet chemical etching is depicted in Fig. 11(a) and shows a frame-shaped zone of high 18O intensity. A lateral profile of the tracer fraction, calculated by line integration in the region between the two red lines, is shown in Fig. 11(b). On one hand, the peaks in tracer fraction at the 3PB seem to indicate an increased electrochemical 3PB activity of the LSC electrode. On the other hand, this stands in contradiction to a bulk path expected for mixed conductors with substantial ionic conductivity such as LSC. However, this apparent conflict can be resolved when considering the exact current distribution of such an electrode geometry. Thin film LSC electrodes can exhibit polarization resistances significantly below 1 Ωcm2 at 600 °C.Reference Kubicek, Limbeck, Fromling, Hutter and Fleig58 Then the spreading resistance of ion conduction in YSZ can become the largest resistive contribution in microelectrode experiments. This was also concluded from the dc overpotential and set voltage discussed above. In such a case, the tracer incorporation experiment may no longer map the distribution of the electrochemical activity of a bulk path (secondary current distribution) but rather the (primary) current distribution governed by the electrolyte and the microelectrode geometry. The following finite element simulation illustrates the consequences.
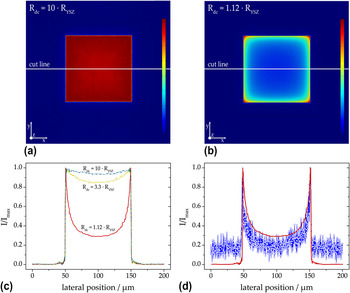
Finite element calculations (software: Comsol Multiphysics 4.3a) were performed for three squarish 100 × 100 μm2 electrodes of different electrochemical properties. In the model, current flow into the electrolyte was only possible via the electrode with a laterally constant area-specific polarization resistance—a lower polarization resistance in the 3PB zone was not assumed. For the first calculations, the electrode polarization resistance was chosen such that R dc = 10·R YSZ (with R dc being the total dc resistance and R YSZ the ohmic resistance of the electrolyte). Figure 12(a) illustrates the distribution of the current density's z-component in the electrolyte (the image is color coded with red indicating high and blue indicating zero current). Figure 12(b) shows the simulation result for a case which resembles the resistance ratios of the tracer incorporation experiment in Fig. 11 (R dc = 1.12·R YSZ). Already from these color-coded images, a strong difference in the current density distribution becomes obvious: for dominating electrolyte resistance, it is much less homogeneous. Figure 12(c) depicts the lateral profiles of the current in z-direction along the cut lines in the 2D plots and the profile of an additional calculation with R dc = 3.3·R YSZ. All curves were normalized to the maximum current.
(a) Finite element simulation result of the current distribution in YSZ (z-component) with a low performing MIEC electrode. The polarization resistance of the electrode was chosen such that R dc = 10·R YSZ results. (b) Simulation result in the case of R dc = 1.12·R YSZ leading to a strongly inhomogeneous current distribution. (c) Lateral profiles along the cut lines in the distribution plots normalized to the maximum current. The top (dash-dotted) and bottom (solid) curves correspond to (a) and (b), respectively. (d) Comparison of the lateral profile corresponding to R dc = 1.12·R YSZ with the measured (normalized) 18O profile from Fig. 11(b); the calculated profile was rescaled to fit the exact width of the LSC microelectrode (104 μm).

This figure clearly shows the differences between a low performing and a highly active MIEC electrode. As long as the electrode polarization resistance exhibits the main contribution to the total resistance (R dc = 10·R YSZ), the electrode controls the current distribution (see the secondary current distribution in aqueous electrochemistry Reference Newman63,Reference Newman80 ). This leads to an almost homogeneous current density. However, in the case of highly active electrodes with polarization resistances being significantly smaller than the electrolyte resistance (R dc = 1.12·R YSZ), the electrolyte is governing the current distribution and we approach the primary current distribution of the given electrode geometry. Also Fig. 12(b) illustrates that the highest current density can be found at the corners and edges of the electrode (red and yellow regions). This pronounced role of the electrode corners and edges is caused by simple geometrical reasons and is well known, also for planar circular microelectrodes.Reference Newman63
In Fig. 12(d), the lateral current density profile of the finite element calculation is compared with the measured lateral 18O profile from Fig. 11(b). The very good agreement strongly supports the validity of our interpretation (the somewhat lower current especially in the middle part can most likely be explained by a local cooling effect caused by the contact tipReference Opitz and Fleig36 during the tracer incorporation). Hence, the pronounced oxygen incorporation close to the edges of the electrode visualized in Fig. 11(a) does not reflect an active electrode surface path via the 3PB. As a consequence, the method of tracer incorporation for the visualization of oxygen incorporation zones has to be applied with caution, particularly on electrode materials with very low polarization resistances.
B. La0.6Sr0.4FeO3−δ (LSF)
Microelectrode measurements already showed that the oxygen exchange pathway of LSF is very similar to that of LSC.Reference Baumann, Fleig, Cristiani, Stuhlhofer, Habermeier and Maier54 The area specific polarization resistances of LSF electrodes are partly higher than those of LSC, the electronic conductivity of LSF is lower, but LSF is significantly more stable against reduction.Reference Kuhn, Hashimoto, Sato, Yashiro and Mizusaki55 However, the electronic p-type conductivity of both materials decreases drastically under reducing conditions due to oxygen release according to
 $${\rm{O}}_{\rm{O}}^x + 2{\rm h^{\cdot} \mathbin{\lower.3ex\hbox{$\buildrel\textstyle\rightarrow\over {\smash{\leftarrow}\vphantom{_{\vbox to.5ex{\vss}}}}$}} {1 \over 2}O_2 +{V^{\cdot\cdot}_{\!\rm O} \quad .$$
For electrochemical oxygen reduction on the surface of thin films, the corresponding changes in charge carrier concentration can play a significant role either because these concentrations directly affect the reduction rate or because of an enhanced electronic transport resistance within the material (i.e., from the current collector to the active surface sites). The latter case can lead to gradients in the chemical potential of oxygen within the electrode and thus to situations with only restricted parts of the thin film electrode being electrochemically active.
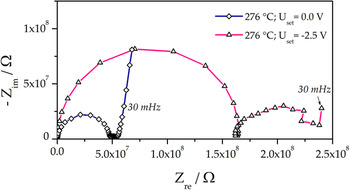
In the present study, impedance measurements using square-shaped 100 × 100 μm2 electrodes on YSZ (100) single crystals were performed for zero and −2.5 V bias at 279 °C (Please note that in this case, the calculation of an electrode overpotential is not reasonable; details will be discussed below.). The obtained impedance spectra are shown in Fig. 13. Without additional dc bias, the LSF electrodes lead to the impedance features often observed for mixed conducting electrodes with high ionic conductivity: a high frequency semicircle, which can be attributed to the electrolyte resistance, an arc in the medium frequency region due to a resistance at the electrode–electrolyte interface and the onset of the low frequency arc reflecting the electrochemical surface process.Reference Baumann, Fleig, Habermeier and Maier11 Upon strong cathodic polarization (−2.5 V set), the total electrode polarization resistance strongly decreases, which is quite common for electrochemical electrode reactions. However, the high frequency arc reflecting the spreading resistance of ion conduction in the electrolyte surprisingly increases significantly (spectrum shown with open triangles in Fig. 13). For planar circular microelectrodes, the spreading resistance of ion conduction in the electrolyte R spr is given by
 $$R_{{\rm{spr}}} = {1 \over {2d_{{\rm{ME}}} {\rm{\sigma }}_{{\rm{ion}}} }}\quad ,$$
with d ME and σion denoting the diameter of the electrode and ionic conductivity of the electrolyte, respectively.Reference Newman63 A similar relation (though without analytical expression) also holds for squarish electrodes.
Impedance spectra (Nyquist plot) measured for LSF microelectrodes on YSZ at 279 °C with 0.0 V and −2.5 V dc bias.

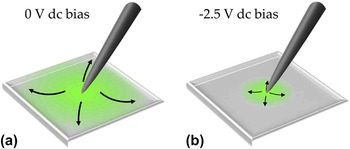
Since changes in the temperature (and thus the conductivity of YSZ) cannot be expected in this experiment, only a change of the effective electrode size can explain the observed phenomenon of an increased bulk resistance. Such a virtual geometry change can be caused by the above-mentioned changes in defect chemistry due to the strong cathodic polarization, which from a thermodynamic point of view is equivalent to reducing conditions. Since acceptor-doped mixed conductors such as LSF exhibit significantly lower electronic p-type conductivities under reducing conditions,Reference Patrakeev, Bahteeva, Mitberg, Leonidov, Kozhevnikov and Poeppelmeier81 electronic charge carriers cannot reach the outermost regions of the thin film electrode. This is sketched in Fig. 14, where (a) and (b) illustrate the situation for equilibrium and cathodic conditions, respectively. Accordingly, the electrochemically active region becomes restricted to a zone around the current collecting contact tip. The size of this active region under polarization can be estimated from Eq. (4) and the electrolyte resistances with and without polarization. When approximating the bulk resistance of a squarish electrode by a circular one with equal circumference, our microelectrode corresponds to a circular electrode with 127-μm diameter. The bulk resistance ratio with and without polarization (0.3) and Eq. (4) then lead to an active circle of 38 μm in diameter. From the bulk resistance without bias and the known temperature dependence of the ionic conductivity in YSZ,Reference Opitz and Fleig36 also the effective electrode temperature could be estimated (276 °C).
Sketch of the lateral distribution of the oxygen reduction current density in a mixed conducting thin film electrode. (a) Under ambient equilibrium conditions (i.e., without a dc bias), the entire electrode is electrochemically active. (b) The application of a large cathodic bias leads to a strong reduction of electronic charge carriers (holes). As a consequence, only a reduced region around the contact tip stays electrochemically active.

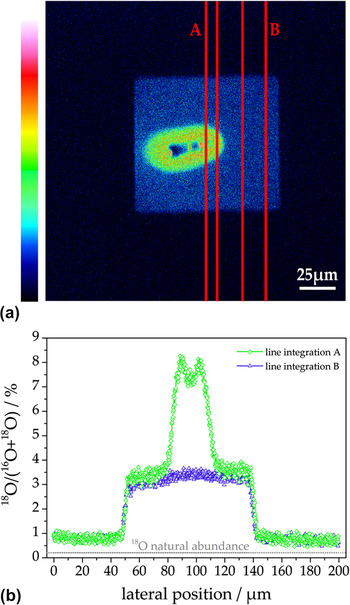
On identically prepared electrodes, 18O tracer incorporation experiments were carried out at the same temperature (276 °C) and the same applied voltage (−2.5 V). The tracer distribution measured by ToF-SIMS after removing the electrode is shown in Fig. 15(a). An oval region with high tracer intensity (red/green) is surrounded by a squarish zone of quite homogenous tracer content (blue); the dark spot in the center was caused by the contact tip. From line integration within the line pairs A and B in Fig. 15(a), the lateral profiles depicted in (b) are obtained. As expected from impedance measurements, only a restricted region (30–40 μm) around the contact tip shows a strongly increased tracer fraction, indicating a high oxygen incorporation rate (i.e., high electrochemical activity). Consequently, the 18O incorporation on the squarish electrode part surrounding the highly active zone can be regarded to be caused by conventional thermally driven tracer exchangeReference Kilner, Skinner and Brongersma78,Reference Kawada, Masuda, Suzuki, Kaimai, Kawamura, Nigara, Mizusaki, Yugami, Arashi, Sakai and Yokokawa79 rather than by polarization-driven oxygen incorporation. Owing to this strong lateral inhomogeneity of the electrochemical driving force within the electrode, the calculation of an overpotential is not meaningful. Hence, also the exact defect chemical state (or the corresponding oxygen partial pressure) in the highly active zone as well as in the surrounding region cannot be deduced from these results.
(a) Tracer distribution in YSZ measured by ToF-SIMS after 18O incorporation using a LSF electrode with a set voltage of −2.5 V; the electrode was removed before SIMS measurements. (b) Lateral 18O profiles obtained by line integration from (a)—the green (diamonds) and the blue (triangles) curves were determined from the region between the line pairs denoted by A and B, respectively.

C. La0.8Sr0.2MnO3−δ (LSM)
LSM is the state-of-the-art cathode material in commercial SOFCs, and it is usually assumed to exhibit a surface path system with oxygen being incorporated at the 3PB,Reference Adler5,Reference van Heuveln, Bouwmeester and van Berkel82 at least for porous electrodes. In tracer incorporation studies, indeed an increased oxygen incorporation activity at the 3PB of model-type LSM electrodes on YSZ was found.Reference Horita, Yamaji, Sakai, Yokokawa and Kato41,Reference Horita, Yamaji, Sakai, Yokokawa, Kawada and Kato42 Since the temperatures in these experiments (700–800 °C) and thus diffusion lengths of the tracer in YSZ were rather high, unambiguous conclusions on a possible bulk path contribution could not be drawn. However, on model-type thin film electrodes with very high surface-to-thickness ratio, a parallel bulk path is frequently discussed to be also relevant,Reference la O’, Yildiz, McEuen and Shao-Horn27,Reference Yan and Salvador28 especially under cathodic polarization.Reference Brichzin, Fleig, Habermeier, Cristiani and Maier26,Reference la O’, Savinell and Shao-Horn29
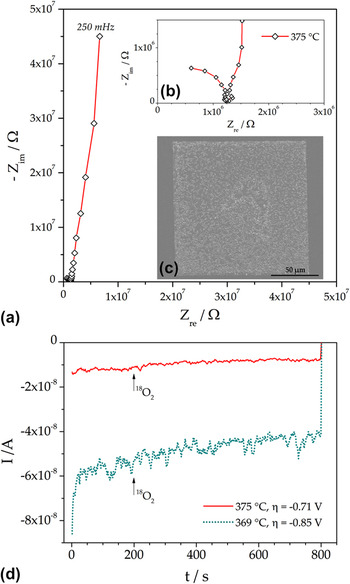
To visualize the electrochemical incorporation of oxygen via surface and bulk path, in the present study, cathodic 18O tracer incorporation experiments were conducted at lower temperatures (about 370 °C) and for different cathodic polarizations. Compared to tracer incorporation on LSF and LSC, two of the problems discussed in the previous sections should be less relevant for LSM: (i) the p-type electronic conductivity of LSM is somewhat higher than those of LSFReference Jiang83 and the applied voltages were lower than those mentioned in Sec. IV. B. Therefore, an electronic sheet resistance should not play a significant role. (ii) The polarization resistances of LSM at the chosen experimental temperatures are orders of magnitude higher than in the case of the LSC electrodes in Sec. IV. A as can be seen in Figs. 16(a) and 16(b). Secondary current distributions only determined by the electrochemical electrode activity can therefore be expected. The impedance spectrum at 375 °C consists of a high frequency arc which can be attributed to the spreading resistance of ion conduction in YSZReference Baumann, Fleig, Habermeier and Maier11 and the onset of a huge electrode feature in the low frequency region.
(a) Impedance spectrum of a square-shaped 100 × 100 μm2 LSM electrode at 375 °C. (b) Magnification of the high frequency region from (a) showing the electrolyte arc. (c) SEM image of a comparable LSM electrode, the light dots are larger, slightly protruding crystallites of the polycrystalline thin film. (d) Cathodic dc currents during tracer incorporation at 375 °C and η = −0.71 V (solid curve) as well as 369 °C and η = −0.85 V (dotted curve). The arrows denote the beginning of tracer gas supply.

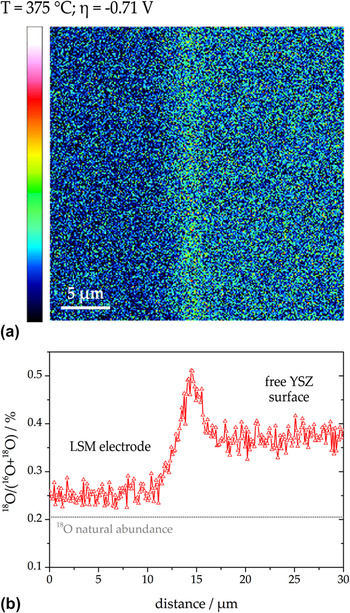
Tracer incorporation experiments were carried out on squarish 100 × 100 μm2 LSM electrodes—a SEM image is depicted in Fig. 16(c). The dc currents during 18O incorporation at 375 °C and η = −0.71 V as well as 369 °C and η = −0.85 V are shown in Fig. 16(d). A highly resolved 18O distribution image of the 3PB region of the electrode polarized with η = −0.71 V is shown in Fig. 17(a)—the SIMS image was recorded in CBA modeReference Holzlechner, Kubicek, Hutter and Fleig59,Reference Kubicek, Holzlechner, Opitz, Larisegger, Hutter and Fleig60 after removing the LSM electrode. In this image, three different regions can be distinguished: (i) an area with low tracer intensity on the left-hand side, where the LSM electrode was located, (ii) a narrow zone with high 18O intensity in the middle of the image corresponding to the 3PB, and (iii) a region with intermediate intensity on the right-hand side reflecting the free YSZ surface. These three zones with different tracer content are even better visible in the lateral tracer fraction profile in Fig. 17(b), which was calculated by line integration from the entire distribution image. The significant increase of 18O at the 3PB shows that in this region, pronounced oxygen incorporation via an electrode surface pathway took place, whereas the tracer fraction beneath the LSM film is only slightly increased indicating lower electrochemical activity. The moderate tracer increase on the free YSZ surface can be attributed to conventional (thermally driven) tracer exchange on a solid oxide ion conductor.Reference Kilner, Skinner and Brongersma78,Reference Kawada, Masuda, Suzuki, Kaimai, Kawamura, Nigara, Mizusaki, Yugami, Arashi, Sakai and Yokokawa79 A contribution of an electrolyte surface path, as in the case of strongly polarized Pt electrodes on YSZ, can be ruled out owing to the considerably lower overpotential during tracer incorporation.
(a) High-resolution 18O distribution image (intensity plot) measured in YSZ after removing the LSM electrode. The tracer was incorporated at 375 °C with a cathodic polarization of −0.71 V. The LSM electrode was on the left hand side of the image. (b) Lateral tracer fraction profile calculated from (a) by line integration over entire height of the image.

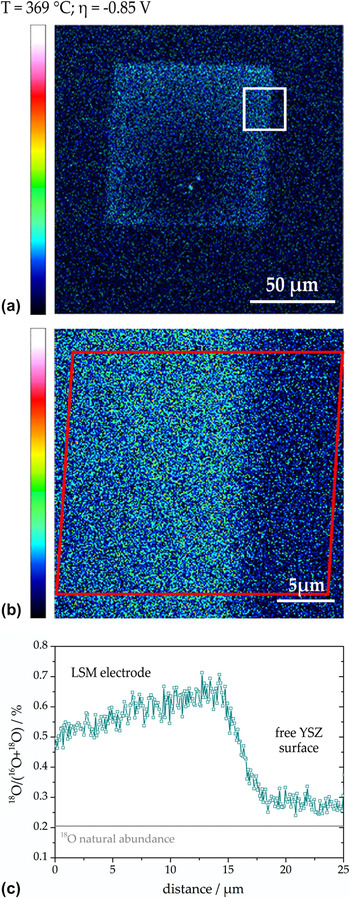
However, the situation tremendously changed when increasing the cathodic polarization to −0.85 V. In Fig. 18(a), an overview of the tracer distribution in YSZ (after removing LSM) is given. In contrast to the situation discussed above, the tracer intensity beneath LSM is now significantly higher than on the free YSZ surface; see the high-resolution image in Fig. 18(b). The latter measurement was carried out in the area indicated by the square in Fig. 18(a). Thus, it reflects the tracer incorporation beneath LSM on the left-hand side and conventional tracer exchange on free YSZ on the right-hand side of the distribution image. From the integration zone indicated by the frame in Fig. 18(b), the lateral tracer fraction profile in Fig. 18(c) was calculated. The amount of tracer incorporated on the free YSZ surface is in good agreement with that found for the less polarized sample. However, the tracer fraction incorporated beneath the LSM electrode is significantly higher—compare Figs. 17(b) and 18(c). Possibly the increase in tracer fraction toward the 3PB is still caused by oxygen incorporated via a surface path; but for unambiguous interpretation, a temperature gradient within the LSM electrode induced by the contact tip has to be ruled out. Nevertheless, it can be definitely concluded from comparison of both measurements that an increase of the cathodic polarization led to a significant increase of the importance of the bulk path.
(a) Overview image (intensity plot) showing the 18O distribution measured in YSZ after removal of LSM. The tracer was incorporated at 369 °C with a cathodic polarization of −0.85 V. The lower tracer intensity around the contact region was most likely caused by a cooling of the thin film due to the tip.Reference Opitz and Fleig36 (b) High-resolution 18O distribution measurement obtained in the region indicated by the square in (a). The LSM electrode was on the left hand side. (c) Lateral tracer fraction profile calculated by line integration from the region indicated by the frame in (b).

This behavior can again be explained by the partial pressure dependence of defect concentrations in acceptor-doped perovskite-type electrode materials. According to Eq. (3), the application of a cathodic dc voltage (i.e., reducing conditions) leads to an increase in oxygen vacancy concentration. Oxygen vacancies are the mobile species for oxide ion transport and thus the bulk path through LSM opens for higher cathodic polarization. For sufficiently high overpotentials, it even outperforms the surface path. Owing to the moderate cathodic overpotential used in our study, the concentration of electronic holes, however, is still high enough to provide sufficient lateral conductivity. Hence, a homogeneous polarization of the thin film is possible—a sharp drop of incorporated 18O within the electrode (as for LSF in Sec. IV. B) is not found here. From the data available so far, the polarization value reflecting equal current contributions via both parallel pathways cannot be obtained—a more detailed analysis dealing with the reaction pathways of oxygen exchange on LSM electrodes will be given in a forthcoming paper.Reference Huber, Kubicek, Opitz, Holzlechner, Navickas, Hutter and Fleig84
V. CONCLUSION
Combined application of electrochemical and tracer methods to model-type thin film electrodes can yield numerous information on reaction kinetics and reaction pathways of oxygen reduction (or oxygen exchange). This could be exemplified for several different electrode materials on YSZ:
(1) For the model system Pt(O2) | YSZ close to equilibrium, a change of the rate-determining step takes place at temperatures of about 500 °C. From the different activation energies of the polarization resistances (1.4–1.6 eV for the 3PB-related high temperature process and 0.2 ± 0.15 eV for the area-related low temperature process), a parallel connection of the corresponding reaction pathways could be concluded. Accordingly, close to equilibrium, an electrode surface path at high temperatures and an electrode bulk path at lower temperatures are the dominant reaction pathways of the oxygen exchange reaction on Pt|YSZ. For high cathodic polarization, an additional path with oxygen incorporation on the free YSZ surface (electrolyte surface path) becomes active. By means of 18O tracer incorporation combined with ToF-SIMS analysis, the electrochemically active zone of this third pathway and of the above-mentioned bulk path could be visualized.
(2) Measurements on acceptor-doped perovskite-type electrodes reveal the limits of the tracer incorporation method for a localization of reaction paths. In the case of electrochemically highly active LSC electrodes with polarization resistances smaller than the ohmic electrolyte resistance, the current density distribution is no longer determined by the electrode activity but by the electrode geometry and the current density in the electrolyte. As a consequence, the mapped tracer distribution reflects the potential distribution due to the spreading resistance of ion conduction in YSZ rather than electrode properties. Another possible challenge for the visualization of electrochemically active sites of acceptor-doped oxides under strong cathodic polarization became obvious for LSF electrodes. LSF is sufficiently stable against reduction, but its electronic p-type conductivity significantly drops under reducing conditions (i.e., for cathodic bias). Therefore, the chemical potential of oxygen varies laterally upon polarization and the tracer incorporation is restricted to a region close to the contact point.
(3) Carefully chosen experimental conditions still allow a tracer mapping of electrochemically active zones of acceptor-doped oxide electrodes and reveal details of the reaction pathways on LSM electrodes. For this electrode material, a voltage-induced change from a surface to a bulk path with increasing polarization was found at about 370 °C. At an overpotential of −0.71 V, the 3PB and thus an electrode surface path were clearly visible in the 18O tracer distribution. An increase of the cathodic voltage to −0.85 V, however, led to a pronounced activation of the bulk path, visible by a significant increase of the tracer signal beneath the entire LSM electrode. This behavior is caused by polarization-induced defect chemical changes. With increasing cathodic overpotential, the concentration of oxygen vacancies in LSM is increased, allowing a higher ionic current through the electrode material and thus opening the bulk path.
In summary, geometrically well-defined model electrodes have been shown to exhibit a large potential for the separation and identification of reaction pathways and rate-determining reaction steps of the oxygen reduction (exchange) reaction on oxide ion conductors. Especially the application of 18O tracer incorporation in combination with SIMS analysis is a powerful tool for identifying the location of electrochemically active zones. However, this technique is prone to artifacts, and additional electrochemical investigations and a thorough characterization of the electrode material are inevitably required.
ACKNOWLEDGMENT
This study was financially supported by the Austrian Science Fund (FWF)—Project No. F4509-N16 (FOXSI).