


Since the publication of The American Voter, partisanship has been a central organizing concept in the study of political behavior. Perhaps the most enduring contribution of the “Michigan School” is the claim that political attitudes and behaviors are powerfully shaped by long-standing and stable partisan attachments (Campbell et al. Reference Campbell, Converse, Miller and Stokes1960). Prior to Campbell et al., researchers had already noted that voters do, in fact, support the same party in most elections. A sufficient explanation for this is, as Key puts it, that they have made a “standing decision” for that party (e.g., Key and Munger Reference Key, Munger, Burdick and Brodbeck1959). The American Voter goes considerably further, however, to claim that stable voting is due to a partisan identity that shapes multiple attitudes and behaviors. In the Michigan view, a citizen's basic partisan orientation solidifies by early adulthood, and partisanship subsequently shapes how new political information is interpreted. Partisanship serves as a “perceptual screen through which the individual tends to see what is favorable to his partisan orientation” (Campbell et al. Reference Campbell, Converse, Miller and Stokes1960, 133). In combination, the persistence of partisanship and its ability to shape perceptions suggest that long ago events that determine partisanship have a causal effect on a citizen's current beliefs and behavior.
This is an arresting and important claim. However, evidence for this expansive view of partisanship has never been fully convincing, in large part because that evidence consists of self-reports of attitudes that cannot be verified against actual behaviors. In this article, we develop a test of partisanship that involves observable behavior other than voting. In particular, we test whether partisan voters, who routinely tell pollsters that the economy is performing better when their party holds the White House, follow-up their survey optimism with higher levels of actual consumer spending. We find evidence that suggests they do.
There is ample survey evidence confirming both the persistence of partisanship and its power in explaining political behavior and assessments of the economy (e.g., Bartels Reference Bartels2000, Reference Bartels2002; Erikson Reference Erikson2004; Evans and Andersen Reference Evans and Andersen2006; Wlezien, Franklin, and Twiggs Reference Wlezien, Franklin and Twiggs1997). Focusing on the last item, partisan divergence in assessments of the national economy provides evidence consistent with partisanship's role as a powerful “perceptual screen.” The president's partisans are both more optimistic about the prospective performance of the national economy and, perhaps more strikingly, provide more sanguine responses to factual questions about objective economic conditions than members of the opposition party. These patterns provide strong support in the survey context for the general contention that partisanship shapes the way citizens see the world of politics and public affairs. In short, this evidence portrays partisan voters as individuals who tend to see what they want to see.
The unanswered question, therefore, is not whether partisanship affects survey response, but rather how these data should be interpreted. Do partisans really see different worlds, or are they just answering survey questions differently? It is well known that survey responses are sometimes unstable and inaccurate, and there are clear psychological (and perhaps political) incentives to shape those responses to portray your party in a favorable light. Political “cheerleading” in survey evaluations of the economy, in particular, is sensitive to context and individual differences: it increases when partisan cues are primed (Lau, Sears, and Jessor Reference Lau, Sears and Jessor1990; Palmer and Duch Reference Palmer and Duch2001; Sears and Lau Reference Sears and Lau1983; Wilcox and Wlezien Reference Wilcox and Wlezien1996), decreases when material incentives discourage misreporting (Prior Reference Prior2007), and is more common among citizens with high levels of political knowledge (Shani Reference Shani2009). More generally, the prevalence of survey misreporting provides a reasonable basis for skepticism about whether survey responses are accurate measures of beliefs and attitudes that affect political and social behavior. We therefore seek to determine whether partisanship affects the response to political information outside the survey context.
In particular, we provide a behavioral test of the claim that partisanship is a “perceptual screen” through which political information is processed. Rather than relying on potentially inaccurate survey reports, we focus instead on citizens’ consumption as a measure of their true economic attitudes and examine how consumption changes in response to new political information. Employing a data set of county-level taxable sales from 1990 to 2006, we test whether changes in local consumption following presidential elections correspond to those areas’ partisan leanings. If, all else equal, Democrats believe that the economy will do better (worse) when a Democrat (Republican) holds power; one would expect that Democratic areas would increase (decrease) their consumption following a Democratic (Republican) victory in a presidential election contest. This approach allows us to assess whether the economic decisions of citizens are consistent with the patterns of partisan divergence found in survey assessments of the economy. If the behavioral data (i.e., costly consumption decisions rather than costless survey responses) do not conform to this prediction, then it is possible that the whole constellation of partisan patterns in survey reports might be dismissed as mere words. This analysis of behavioral data, which is suggested by earlier work on perceptual bias (Gerber and Green Reference Gerber and Green1999: 208), has, to our knowledge, been employed previously only for an exploratory analysis of country-level consumption for a select group of extreme partisan counties in 1992 and 2000 (Trigger Reference Trigger2006).Footnote 1
To provide a clear intuition for our empirical expectations, we present a theoretical model of consumption based on partisan differences in beliefs about economic performance when each party controls the presidency. We present a model of how partisan expectations lead to different consumption patterns and describe two important predictions emerging from this model: (1) local consumption will increase more after an election when local partisanship and postelection partisan control of the presidency align than when they are in conflict, and (2) changes in consumption will occur immediately after the election, rather than after shifts in policy, leadership, or staffing occur. Our empirical findings generally confirm these expectations. We find a substantively large and statistically significant relationship between changes in consumption and local partisanship following presidential elections. Across a variety of model specifications, we find evidence that consumption increases in areas allied with the winning presidential candidate and decreases in those areas where affiliations lie with the losing candidate. Furthermore, this change occurs prior to actual changes in control of government (and, therefore, policy).
The variation in consumption we measure is consistent with partisan differences in the expected economic consequences of elections as expressed in surveys. At the same time, the correlation between changes in consumption and the concordance between local partisanship and election outcomes may reflect not simply differences in expected economic performance associated with partisanship, but also expected distributional consequences that are correlated with partisanship. To clarify the relative contribution of these two mechanisms to changes in consumption following elections, we conduct additional analysis to determine whether it is partisanship per se that explains the patterns we observe. We analyze consumption patterns in areas where partisanship is at odds with many traditional measures of partisan differences in expected policy benefits. In addition, we identify measures for a wide variety of distributional concerns. In both cases, we demonstrate that the patterns of partisan difference in consumption we identify are, at most, only partially explained by these measures of alternative mechanisms.
The remainder of this article is organized as follows. We first review the literature and then present the aforementioned model linking partisan-tinged economic expectations and election outcomes to consumption. Next, we describe the data and results. We present both the basic findings and a collection of robustness tests. Finally, we describe the implications and limitations of our evidence. For instance, one limitation of our empirical test is that although our predictions are at the individual level, we only have data on consumption at the county level. We discuss several additional issues, including alternative interpretations of the findings in light of the magnitude of the empirical estimates, the importance of additional research using individual-level data, and the use of party vote shares as a proxy for geographic variation in partisanship. We also provide some ideas for how these and other related issues might be addressed in future research.
REVIEW OF LITERATURE ON PARTISANSHIP AND ECONOMIC PERCEPTIONS
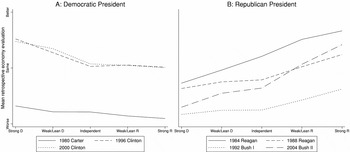
A substantial body of survey evidence shows that perceptions of the economy are correlated with partisanship. Survey responses to a broad range of questions about economic performance are more positive when the respondent's partisanship matches that of the current president. For example, Conover, Feldman, and Knight (Reference Conover, Feldman and Knight1986, Reference Conover, Feldman and Knight1987) show that partisanship affects both prospective and retrospective evaluations of economic performance. More recent work has confirmed the relationship between partisanship and economic assessments (e.g., Bartels Reference Bartels2000, Reference Bartels2002, Reference Bartels, Brady and Johnston2006; Duch, Palmer, and Anderson Reference Duch, Palmer and Anderson2000; Evans and Anderson Reference Evans and Andersen2006; Hetherington Reference Hetherington1996; Ladner and Wlezien Reference Ladner and Wlezien2007; Lewis-Beck et al. Reference Lewis-Beck, Jacoby, Norpoth and Weisberg2008, ch. 13; Prior Reference Prior2007; Wilcox and Wlezien Reference Wilcox and Wlezien1996; Wlezien, Franklin, and Twiggs Reference Wlezien, Franklin and Twiggs1997). The strength and regularity of this pattern is easily observed in surveys. For example, Figure 1 shows the relationship between party identification and retrospective evaluations of economic performance in the American National Election Studies (ANES) from 1980 to 2000. The data show a clear pattern; the party of the president typically has a strong effect on how those attached to a party evaluate the past year's economic performance. When the president is a Democrat, Democratic identifiers are more positive than Republicans, and this pattern is reversed when the president is a Republican.
Partisanship and Retrospective Economic Evaluations

Some partisan differences in assessment of economic performance might arise if partisans use different criteria to evaluate economic performance (e.g., if Republicans worried about inflation, while Democrats were concerned about growth). However, Bartels (Reference Bartels2002) provides interesting examples of how partisans differ in their assessments of “objective” conditions. In the 1988 ANES, respondents were asked whether “compared to 1980, the level of unemployment in the country has gotten better, stayed the same, or gotten worse?” A similar question was asked about inflation. During this period, the national economy showed substantial improvement on both measures, with unemployment dropping from 7.1% to 5.5% and inflation decreasing by nearly 10 percentage points (from 13.5 to 4.1). Despite these improvements, however, only about 30% of strong Democrats responded that unemployment was better than in 1980, in contrast to more than 80% of strong Republicans. Similarly, only about 20% of strong Democrats said inflation was better versus 70% of strong Republicans (Bartels Reference Bartels2002, Figure 3).
Most studies demonstrating partisan differences in evaluations of the economy rely on cross-sectional data. It is therefore possible that these studies yield misleading results due to unobserved differences across respondents that are correlated with both partisanship and economic assessments. For example, under a Republican president, Democrats may experience an objectively poorer local economy than Republicans, but the survey analyst may be unable to observe this context directly. Even panel studies in which the same individuals are interviewed over time may be subject to this criticism if the time between interviews is large and changes in local and personal economic conditions are correlated with partisanship. More recent work by Gerber and Huber (forthcoming), however, addresses this concern. Using a panel design, they measured respondents’ economic forecasts and intended spending on particular goods immediately prior to and after the 2006 Congressional election in which Democrats retook control of the House and Senate. They find that the change in party control of Congress immediately led partisans to revise both their expectations for national economic performance (following the shift to Democratic control, Democrats became more optimistic, Republicans less optimistic) and their intended spending plans.
In sum, there is a broad range and large volume of evidence showing a link between partisanship and economic perceptions in the survey context. Nonetheless, an important next step is to see whether this divergence in survey responses translates into actual behavior. There are compelling reasons to be suspicious about the link between survey response and economic evaluations, as well as more general concerns about the accuracy of survey-based measures of political behavior. First, respondents may answer questions, consciously or unconsciously, to convey their general support for a party. If a respondent wants to send a clear message of partisan support through his or her responses, there will be an inclination to stay “on message” by registering apparently uniform support rather than real ambivalence (Festinger Reference Festinger1957). This pattern might also arise for more conscious reasons if a respondent considers how his or her survey response might subsequently be used. If the survey may be made public, there will be a temptation to answer questions in a way that portrays the respondent's party more favorably to other persuadable citizens (e.g., Meirowitz Reference Meirowitz2005).
Second, the design of political surveys may encourage respondents to avoid cognitive inconsistency and engage in partisan “cheerleading” in their evaluations of the economy. If questions about the economy are embedded in a political survey, this might heighten a respondent's awareness of the political implications of responses, or items may be heard by the respondent as questions about the current administration. In this way, political surveys may prime partisanship in survey response. There is evidence that these general concerns are particularly relevant in this application. Asking political questions prior to economic ones increases the correlation between partisanship and subjective economic evaluations (Lau, Sears, and Jessor Reference Lau, Sears and Jessor1990; Palmer and Duch Reference Palmer and Duch2001; Sears and Lau Reference Sears and Lau1983; Wilcox and Wlezien Reference Wilcox and Wlezien1996), and the tendency to “cheerlead” is diminished when respondents are financially rewarded for factually accurate responses (Prior Reference Prior2007).
More generally, survey evidence has its limits. Survey responses may be unstable over time (e.g., Converse Reference Converse and Apter1964), influenced by perceptions of the social desirability of various answers (e.g., Berinsky Reference Berinsky1999), and sensitive to question wording, ordering, and other survey design features (e.g., Lacy Reference Lacy2001). Misreporting of previous behavior is also common (Anderson and Silver Reference Anderson and Silver1986; Silver, Anderson, and Abramson Reference Silver, Anderson and Abramson1986; Traugott and Katosh Reference Traugott and Katosh1979; Vavreck Reference Vavreck2007). These concerns suggest the wisdom of seeking evidence of partisan differences in behavior outside the survey context. Particularly promising are data that would allow observing some action whose costliness should minimize incentives that may lead to distortions in (costless) survey reports.
A MODEL OF HOW PARTISANSHIP AFFECTS CONSUMPTION AFTER ELECTIONS
In the next section, we investigate whether consumption data support the claim that partisans act on different beliefs about future economic performance. Our data analysis focuses on how consumption shifts in response to the presidential election outcome. To provide a clear basis for our subsequent discussion, we present a simple formal model of how consumption reacts to learning which party will hold political power when partisans hold different beliefs about the effect of each party's governance on the national economy. This section derives the predictions that we investigate in the next section.
Our analysis is based on a three period life-cycle model. Citizens select how much to consume in each of three periods (C1, C2, C3) subject to a budget constraint, C1 + C2 + C3 = Y, where Y equals expected lifetime income.Footnote 2 The election takes place immediately prior to period 2. Let YJ|K be the total income a citizen of party J receives when party K wins the election. For simplicity, we assume citizens and politicians are either (D)emocrats or (R)epublicans.
In period 1, because the election has not yet taken place, there is uncertainty about Y. Define 0 ≤ p ≤ 1 as the common prior probability the Democratic candidate wins the election. When the citizen is a Democrat, expected income prior to the election is therefore

where DL = YJ=L|K=L –YJ=L| K≠L, the differential effect of partisan control on expected income, is how much greater a citizen of party L's income is when party L wins the election rather then the other party. Analogously, expected income prior to the election for a Republican is

A citizen selects consumption to maximize expected utility subject to the budget constraint. Formally, the citizen's problem is
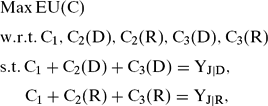
where Ct(L) is consumption in stage t in the event that party L wins the election.
The optimal consumption plan maximizes expected utility given the information available at each point in time. Because consumption for periods 2 and 3 occurs following the election, there are five different consumption levels in a complete consumption plan. The optimal plan can be determined by working backward from period 3. When the stage utility to consumption, U(Ct), is quadratic, the optimal consumption plan can be solved for analytically and takes a simple form. Let U(Ct) = ACt − BCt2, where A > 0 and B > 0. We provide an appendix that shows how to calculate the optimal consumption plan. The utility maximizing consumption plan for a Democratic partisan is
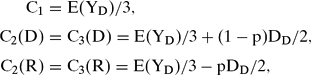
and the optimal consumption plan for a Republican partisan is
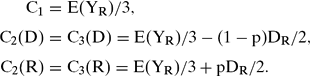
The optimal consumption plan has two interesting features. First, consumption levels in periods 2 and 3 are equal. Following the election, the agent must decide how to allocate a given amount of income to each of the two remaining periods. Because the utility function is concave, there is diminishing marginal utility of income. Any allocation other than equal division can be improved by shifting consumption from the high consumption period to the low one. Second, as long as the election outcome has income consequences (DL, the differential effect of partisan control on expected income, is not equal to zero), consumption adjusts after the election unless p equals 1 or 0. To understand the specific amount of this adjustment, consider the case of a Democrat deciding on postelection consumption. Following a Democratic win, uncertainty regarding the election outcome is resolved. Income is now expected to be higher than the preelection expectation by the amount (1 − p)DD, which is the probability the Republican would win the election times the income advantage of having a Democrat in office rather than a Republican. This “windfall” is, for the reason explained in the previous point, then divided equally across the two postelection periods of consumption.
In the following section, we examine empirically how consumption changes between the period before (t = 1) and the one after (t = 2) the election. Using the results for the optimal consumption plan, the change in consumption for a Democrat following a Democratic victory is (1 − p)DD/2, and after a Republican win, it is −pDD/2. Likewise, for a Republican, the change in consumption following a Democratic victory is −(1 − p)DR/2, and after a Republican win, it is pDR/2. In an area with a mixture of Democratic and Republican citizens, the change in aggregate consumption caused by a Democratic win is therefore

where 0 ≤ α ≤ 1 is the proportion of Democrats in the area. When a Republican wins, the change in local consumption is instead:

According to survey evidence, Democratic identifiers believe that the economy will improve when a Democrat rather than a Republican wins the election, and Republican identifiers believe that the economy will be better when a Republican rather than a Democrat wins. This implies YD|D > YD|R and YR|R > YR|D, in which case DD > 0 and DR > 0. Note that if, instead, neither Democratic nor Republican identifiers really believe that the election will affect their income, then DD = DR = 0. In that case, there will be no systematic relationship between partisan mix and consumption because the election outcome does not affect expected income.
We now summarize our conclusions, which follow immediately from the analysis. There is a change in local consumption (C2 − C1) that occurs immediately following the election. This change is a positive (negative) linear function of the proportion of Democratic citizens (α) when the Democrat (Republican) wins the election. This is the main prediction of the model. It is a striking feature of the life-cycle model that the change in consumption occurs as soon as expected future income changes. We predict that consumption will change in the period immediately following the election, even though, during the sample period, the election will not cause any change in federal policy, the economy, or household income. An additional result is that the change in consumption is a move to a new consumption level, not a one-time surge or reduction. Consumption will remain elevated (or depressed) in all periods (C2, C3) following the election, until some new event occurs to cause subsequent readjustment. This second prediction is somewhat difficult to test because it depends on the definition of a “new event.” If the new event is the disclosure of information about how the economy is really doing, it is possible that once several months have passed citizens will, regardless of their partisanship, adjust their consumption to what is actually happening in the economy.Footnote 3
Our theoretical predictions about consumption changes follow when: (1) partisans believe that their income will be higher when their party holds the presidency and (2) consumption is based on expected lifetime income. Previous theoretical and empirical work has confirmed the basic claim that optimism about the economy is associated with increased consumption (e.g., Blanchard and Fischer Reference Blanchard and Fischer1989; Carroll, Fuhrer, and Wilcox Reference Carroll, Fuhrer and Wilcox1994; Ljungqvist and Sargent Reference Ljungqvist and Sargent2004).
In the next section, we investigate whether the consumption changes following the most recent presidential elections are consistent with predictions that follow from taking the partisan pattern in survey responses seriously. Before proceeding, we note that our predictions follow when there are partisan differences in economic expectations; isolating what causes partisan differences in expected income following an election, and in particular, the role of partisanship relative to class and other differences, requires additional analysis. Partisan expectations may stem from different partisan beliefs regarding the national economy, a pattern apparent in survey responses. But they could also be based on expectations about the distributional consequences of the parties’ economic programs, programs that might tend to favor their own partisans. There are a broad range of policy areas (e.g., agricultural programs, assistance for the elderly) where the party of the president might be expected to lead to differences in policies that affect individual income, holding the health of the national economy constant. These differences in anticipated targeted costs and benefits, which we label distributional policy, may be correlated with local partisanship. In the empirical work that follows, we attempt to account for those factors that predict likely changes in those sorts of policies in order to distinguish differences in expected distributional benefits from differences in expected economic performance.
DATA AND RESULTS
Data
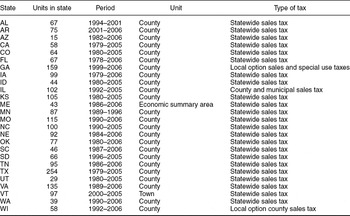
The data set for our analysis was created by merging information about local sales with local political and demographic information. Specifically, we collected records of local (county, township, or local economic area) taxable sales for all states recording these figures on a monthly or quarterly basis for a period spanning at least two presidential elections. For convenience, we refer to these local areas as counties, which they are for all states other than Maine and Vermont. (In most cases, this is a statewide retail sales tax. In other states, it is local option sales tax that is widespread in its adoption.) We were able to obtain data from 26 states. The period of our data collection, the number of local area units for which we have obtained data, and the type of tax in place are listed in Table 1.Footnote 4
Local Sales Data Included in Analysis

Note: These are all states for which we have collected any data. Sample restrictions in the Table 3 specifications (e.g., requiring (a) one Democratic and one Republican victory, (b) the availability of historical election data for Maine ESAs and Vermont towns, and (c) a sufficient series to construct historical lags) eliminate 7 states from that analysis. All observations for presidential election years 1992–2004 are used in the Table 7, columns (6) and (7), specifications.
The taxable sales data were then merged with information about local partisanship and local demographics. Following previous research, we measure local partisanship using the Democratic share of the two-party presidential vote (e.g., Ansolabehere, Snyder, and Stewart Reference Ansolabehere, Snyder and Stewart2001; Canes-Wrone, Brady, and Cogan Reference Canes-Wrone, Brady and Cogan2002). Vote share is believed to be a highly accurate proxy for local partisanship (Levendusky, Pope, and Jackman Reference Levendusky, Pope and Jackman2008) and our own analysis of the National Annenberg Election Survey (NAES) confirms this.Footnote 5 We average the county Democratic presidential vote share from 1992 to 2004 to minimize the effect of short run forces and base our measure on the years from 1992 to 2004 because they are likely to be more accurate proxies for county partisanship during the period covered by our study than are earlier election results. For cases where our records of taxable sales were obtained at the county level, this matching process is straightforward. In Maine and Vermont, however, our data on taxable sales are from economic summary areas (ESAs) and towns, respectively. In those two states, we estimated area-level election outcomes by matching these areas to town-level election data.Footnote 6
Records of taxable sales are a valuable measure of local consumer behavior. We note, however, some potential limitations of these data. First, not all taxable sales are to consumers residing in the area where the retail transaction takes place. For example, citizens living in the suburbs of Chicago (e.g., in Du Page, Lake, and Will counties) may travel to Chicago (in Cook County) to make purchases. Records of those sales will appear as occurring from a relatively Democratic area, when in fact the individuals making those purchases who are from less Democratic areas are more likely to be Republican. Insofar as such cross-county consumption weakens the link between our measure of the partisanship of the consumer and consumption, such measurement error is likely to attenuate correlations between local partisanship and local consumption.Footnote 7, Footnote 8
The second concern is misreporting of the location and timing of retail sales. The most basic problem is that sales may be reported in a period after they took place. So, for example, taxable sales figures for January may reflect sales from December of the prior year. We contacted the sources of our data and adjusted the reporting period to account for the period of actual sales.
Two other concerns also remain, one related to timing and another to the location of sales. Regarding the former, in most states small businesses are exempt from set schedules of monthly or quarterly reporting of taxable sales. According to state officials we interviewed, those small businesses that do not report according to the normal schedule usually choose to report once (in December) or twice (in June and December) a year. Our subsequent analysis employs reported sales in the 1st and 3rd quarter of each year, thus avoiding the potential artificial inflation of sales in the 2nd and 4th quarter. The latter concern arises because businesses with multiple locations in a state may be allowed under state law to report “consolidated filings,” which are sales figures for all their establishments statewide. Fortunately, this does not appear to be a problem for the states whose data we analyzed, which generally require multiple-facility locations to report taxes for each location. More generally, as with misreporting of the time period of sales, these patterns are likely to attenuate finding the causal relationships we seek to estimate.
Analysis and Results
Our analysis proceeds by examining whether changes in local consumer behavior are affected by partisanship. Specifically, we test whether there are partisan differences in changes from pre- to postelection consumption following learning which party will control the government. The dependent variable for our analysis is the natural logarithmic transformation of the amount of taxable sales in an area in the 1st quarter following an election divided by sales in the 3rd quarter of the prior (election) year. Specifically, if taxable sales in area i in quarter q of year t are given by Si,t,q, we calculate Log change in salesi,t = ln(Si,t+1,1/Si,t,3). We also calculate that figure for nonelection years to allow for the inclusion of prior changes in sales as a control variable in our statistical analysis.
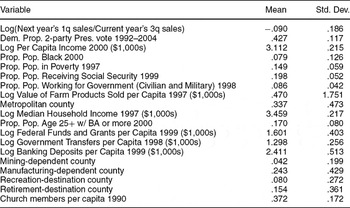
We measure local partisanship as Democratic proportion 2-party votei = Dem. Votesi/(Dem. Votesi + Rep. Votesi) using county-level data from the 1992, 1996, 2000, and 2004 presidential elections. In addition, we create an interaction between that measure and the party of the presidential winner, where Presidential Winnert = 1 if a Democrat wins the presidency (t = 1992 and 1996) and −1 if a Republican does so (t = 2000 and 2004). Summary statistics for model variables appear in Table 2.
Summary Statistics for Model Variables

N = 5,426.
Summary statistics are for cases included in columns (1) and (2) of Table 3.
The main predictions of our model are that there will be an immediate change in consumption following the presidential election and that this change will be correlated with county partisanship. A key advantage of our strategy of examining changes in consumption between periods that are just 3 months apart is that it is unlikely that important economic events in the 4th quarter would create a spurious relationship between partisanship and consumption changes. We account for nationwide trends in economic conditions using a series of year-specific indicators for each year with a presidential election (excluding 2004). Because counties differ in the natural seasonality of their consumption (due, e.g., to whether the economy is based heavily in warm weather agricultural activity), we allow each area to have a different average shift in consumption by including an indicator for each county. We note that the inclusion of this county fixed effect also accounts for any other static feature of these areas, for example, their partisanship and wealth, and so we need not include those measures directly in our subsequent statistical analysis.
In addition, in the specification we label model (1) throughout the article, we include state-year indicators (e.g., Texas 1992, Texas 1996, Texas 2000) for each state-year combination in our data set. (Including state-year fixed effects obviates the need for separate year indicators.) This model allows individual states to have different average changes in consumption in each year and estimates the relationship between consumption changes and partisan voting patterns using the variation within each state-year. This approach removes substantial amounts of the variation in partisanship across states and consequently tends to increase the share of measurement error in the independent variable. As a result, this specification may produce estimates that underestimate the true effect. However, an advantage of using state-year fixed effects is that doing so reduces the risk that any results we observe are due to geographically correlated shocks to statewide consumption due to, inter alia, natural disasters, weather, changes in policy or state-level election outcomes, or correlated measurement error at the state level.
Finally, because there may be persistence in any deviation from average consumption (e.g., due to changes in gross patterns of economic activity), we include a measure of the lagged change in consumption behavior in the 3 years prior to the election year. Formally, we define YEAR as a vector of year indicators for each presidential election year; COUNTY as a vector of area-specific (e.g., counties or other sales tax areas) indicators; STATE-YEAR, as a vector of state-year indicators (e.g., each state in each year it is included in our data set); and Previous 3-year average change in Dependent Variablei,t as (Log change in salesi,t−1 + Log change in salesi,t−2 + Log change in salesi,t−3)/3.
Most of our estimation results build on the model (1) specification, which is Log change in salesi,t = B0 + B1* Previous 3-year average change in Dependent Variablei,t + B2* Democratic proportion 2-party votei *Presidential Winnert + B′STATE-YEAR + B′COUNTY + e. This specification incorporates an indicator variable for each county and state-year in our data set. Therefore, all changes in consumption are calculated relative to average changes in that county (and state-year). In addition, the standard errors we report are clustered at the local area unit (e.g., county) level. The model (1) specification accounts for average differences in partisanship (and changes in consumption) within each state in each year. This is a relatively conservative approach in that it leverages only variation in partisanship within individual states to estimate B2. For this reason, we also estimate model (2), which replaces the state-year fixed effects with year fixed effects (while retaining the county fixed effects). The model (2) specification is Log change in salesi,t = B0 + B1* Previous 3-year average change in Dependent Variablei,t + B2* Democratic proportion 2-party votei *Presidential Winnert + B′ YEAR + B′ COUNTY + e.
Although some states have data going back additional years, we restrict our core analysis to the 4 presidential elections between 1992 and 2004 and to those states for which we have at least one observation from both a Democratic and Republican presidential victory (e.g., the state's data series must include an observation for 1992 or 1996 and 2000 or 2004). Our reasoning is twofold. First, the set of states for which we have sales tax data for elections prior to 1992 is not representative of the partisan composition of the larger panel of states for the post-1992 period. Second, by confining our analysis to states for which we observe both Democratic and Republican victories, we can distinguish the effect of partisan responses to the event of a presidential election from partisan responses to victories by each party.Footnote 9 In addition, we eliminate all counties containing a recognized Native American reservation because of concerns about casino gambling sites and the reporting of on-reservation sales. For these regressions, we have up to four years of observations (one observation for each presidential election year) for approximately 1,450 local areas.
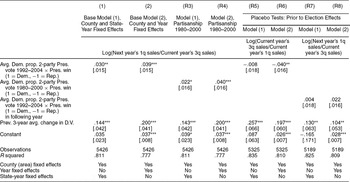
Table 3 provides estimates of the effect of presidential elections on consumption. The models test our core prediction that if the presidential election affects expected income, there will be a change in consumption immediately following the election. Column (1) estimates the effect of the presidential election outcome on the change in consumption from the 3rd quarter of the election year to the 1st quarter of the year following the presidential election using the model (1) specification with county and state-year fixed effects. Confirming our prediction, the interaction between county partisanship and the presidential election outcome is positive and statistically significant (p value < .05, one-tailed test).Footnote 10 The size of this effect is also considerable. According to the estimates in Table 3, column (1), after accounting for the other variables included in the statistical model, following a Democratic presidential election victory, taxable sales are predicted to be about .9% higher in a highly Democratic county (Democratic proportion 2-party vote = .65) than in a very Republican one (Dem. Prop. 2-party vote = .35).Footnote 11 Alternatively, consider the relative difference between strongly partisan counties when a Democrat, rather than a Republican, wins office. In that case, local consumption is predicted to be about 1.8 percentage points greater in the highly Democratic county than in the highly Republican one.Footnote 12
Effect of Partisanship and Election Outcomes on Local Consumption

Note: Dependent variable is Log(Next year's 1q sales/Current year's 3q sales) in columns (1)–(R4), (R7), and (R8) and Log(Current year's 3q sales/Current year's 1q sales) in (R5) and (R6). Sample is years 1992, 1996, 2000, and 2004 in columns (1)–(R6) and 1991, 1995, 1999, and 2003 in columns (R7) and (R8). Analysis restricted to all areas without Native American reservations for which data are available for at least one Democratic and one Republican presidential victory in this period. This causes us to exclude observations from AL, AR, GA, ME, MN, SD, and VT. Missing consumption data cause sample size variation across columns.
In the column (R5)–(R8) specifications, we exclude counties from Iowa in 1996 because of catastrophic flooding in the state in 1993 and 1996 that disrupted economic activity between the 1st and 3rd quarter for some counties. With those observations, the coefficient on Avg. Dem. prop. 2-party Pres. vote 1992–2004 × Pres. win (1 = Dem., −1 = Rep.) is .029 (SE .027) in column (R5) and −.013 (SE .025) in column (R6), whereas the coefficient on Avg. Dem. prop. 2-party Pres. vote 1992–2004 × Pres. win (1 = Dem., −1 = Rep.) in following year is .034 (SE .028) in (R7) and −.002 (SE .026) in (R8).
Robust standard errors in brackets, clustered at the county level. *Indicates significant at 10%; **significant at 5%; ***significant at 1%, two-tailed tests, except for one-tailed tests for partisanship × election outcome variables in columns (1)–(R4).
In column (2), we report results from the model (2) specification, which incorporates county and year fixed effects. Again, we find a substantively large and statistically significant interaction between county partisanship and the presidential election outcome. The effect is about 30% larger than the effect shown in the column (1) specification, suggesting that the column (1) specification results are not being driven entirely by the inclusion of state-year fixed effects and consistent with the possibility that the results in column (1) might be mildly depressed due to measurement issues.
Table 3, columns R3 and R4, tests the robustness of these results to a different measure of local partisanship. The results in Table 3, columns (1) and (2), employ the average Democratic share of the 1992–2004 presidential vote as a measure of county partisanship. These are contemporaneous measures of partisan feeling and so likely to be more accurate than measures from previous elections. These election years are included in the sample, however, and so partisan differences in candidate assessments, rather than partisanship per se, might account for some of the correlation between sales, partisanship, and election outcomes. In columns (R3) and (R4), we substitute the average Democratic share of the 1980–2000 two-party presidential vote and find that the results are similar to those obtained when partisanship is measured using 1992–2004 vote share. In column (R3), the estimated coefficient on the interaction between county partisanship and the presidential election outcome is about 27% smaller than in column (1), and has a p value of <.10. In column (R4), the coefficient of interest is nearly identical to the one shown in column (2).
A concern with models that estimate differences in differences is that they tend to produce “false-positive” results at high rates (Bertrand, Deflo, and Mullainathan Reference Bertrand, Deflo and Mullainathan2004).Footnote 13 Therefore, in addition to standard robustness checks such as those presented in columns (R3) and (R4) and later in the article, we also estimated two sets of placebo regressions, which test the research design by investigating whether “no effect” is observed under conditions where our model predicts partisanship and consumption should be unrelated. Columns (R5) and (R6) display results from models that analyze the relationship between county partisanship and consumption changes between the first and third quarters of the election year (e.g., when both periods are prior to the election). In the model (1) specification with county and state-year fixed effects shown in column (R5), we find a small and statistically insignificant relationship between local partisanship, election outcome, and changes in consumption prior to the election. This “no effect” result is what we expect (unless the uncertainty about which party will win the presidential election is substantially reduced between the 1st and 3rd quarters).
In column (R6), we employ the model (2) specification that includes year and county fixed effects. Here, we find a negative and statistically significant relationship between partisanship, future election outcome, and changes in consumption prior to the election. This result implies that in more Democratic (Republican) areas consumption declines (increases) prior to a Democratic victory, and the magnitude of this effect is similar (in absolute terms) to the result shown in the column (2) specification. In this account, then, the column (2) result may originate in consumption changes from the 1st to the 3rd quarter prior to the election that anticipate the subsequent election outcome. This finding, however, does not appear in the more conservative column (R5) specification with state-year fixed effects, suggesting that it is caused by changes in consumption at the state-year level that are correlated with average statewide partisanship.
We also estimate a second “placebo” model in columns (R7) and (R8). In these specifications, we test whether the outcome of the following year's presidential election explains changes in taxable sales between the current year's 3rd quarter and the 1st quarter of the election year (the dependent variable is, for example, log [1992 1st quarter/1991 3rd quarter] rather than log[1993 1st quarter/1992 3rd quarter]). In both the model (1) specification shown in column (R7) and the model (2) specification shown in (R8), we find no evidence that changes in taxable sales in the year prior to the election are influenced by the combination of the future election outcome and local partisanship. In column (R7), the coefficient on partisanship interacted with the future election winner is close to zero and falls far short of statistical significance, whereas in column (R8) it is somewhat larger although still insignificant.
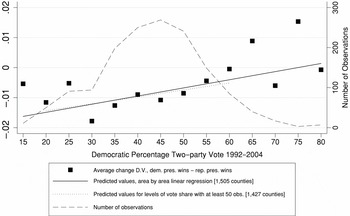
In addition to this regression-based analysis, we also present our data graphically to examine the robustness of our central finding. Figure 2 displays the relationship between postelection changes in consumption, election outcomes, and local partisanship. The horizontal axis plots Democratic vote share (divided into five percentage point bins), whereas the left-hand side vertical axis displays observed changes in consumption from the third quarter of an election year to the first quarter after it when a Democrat rather than a Republican wins the presidency (e.g., consumption change in 1992 and 1996 relative to that change in 2000 and 2004), and the right-hand side vertical axis displays the frequency of observations for each level of partisan vote share. Although consumption on average decreases from the third quarter to the first quarter of the following year (reflecting the seasonality of postholiday and cold weather behavior), it increases relative to this average when the election winner matches area partisanship. Two additional patterns are noteworthy. First, Figure 2 demonstrates that the linearity assumption employed in the regression model is a reasonable approximation for the relationship between partisanship and consumption change. Second, it shows that the regression results do not appear to be driven by changes in the most extreme partisan counties (note the similar slopes for the regression lines for the analysis employing all observations and the analysis restricted to those levels of Democratic vote share [20%–60%] with at least fifty county observations).
Average Change in Consumption 1992 and 1996 − Average Change in Consumption 2000 and 2004 (Democratic Minus Republican Victories)

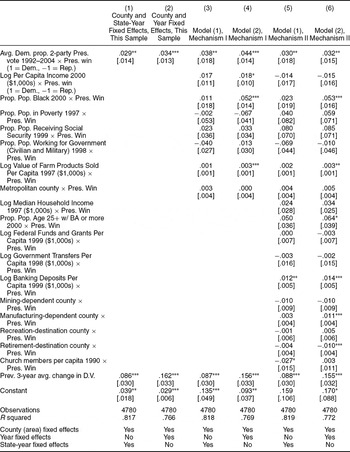
Table 3 shows that postelection consumption changes are correlated with partisanship. What accounts for this empirical relationship? Table 4 explores some of the reasons why partisanship might be related to differences in income expectations after the election. Recall that surveys show that partisans have very different expectations about the performance of the national economy when their party holds the presidency. Therefore, partisanship might be related to income expectations because partisans believe that national income will grow faster when their party has greater political power. Of course, parties also have different constituencies and policy priorities, which have substantial distributional consequences. For example, when a Democrat wins the White House, this might be expected to increase the income forecasts of racial minorities and less affluent citizens.
Testing Additional Mechanisms for Effects of Election Outcomes on Local Consumption

Note: Fixed effects for county (area) included in all models. Dependent variable is Log(Next year's 1q sales/Current year's 3q sales). Sample is the same as in Table 3, with the additional restriction that covariates listed in the column (5) and (6) specifications are available.
Robust standard errors in brackets, clustered at the county level. *Indicates significant at 10%; **significant at 5%; ***significant at 1%, two-tailed tests, except for one-tailed tests for partisanship × election outcome variables in columns (1)–(6).
To capture the contribution of distributional considerations to the coefficient estimate linking partisanship to consumption changes, we reestimated the models in Table 3, columns (1) and (2), adding to the base model specification a large number of variables measuring differences in distributional priorities commonly ascribed to the two major parties. These measures are not available for certain counties, and so we restrict our analysis throughout Table 4 to those cases for which these values are available for all measures. Thus, the column (1) results are for the model (1) specification (county and state-year fixed effects) for this restricted sample, whereas the column (2) specification is the model (2) specification (county and year fixed effects). Comparing the results in columns (3) through (6) with those shown in (1) and (2), it appears that the relationship between partisanship and economic expectations rests on a mixture of expectations about the distributional and general macroeconomic economic consequences of the election. The regressions in columns (3) and (4) of Table 4 include interaction terms for class (log per capita income), race (proportion African American), the poverty rate (proportion in poverty), the share of elderly (proportion receiving social security), the share of government employment (proportion working for the government in civilian or military capacity), agricultural activity (log value of farm products per capita), and urbanization.Footnote 14 The models in columns (5) and (6) incorporate these 7 interactions and add 10 more interactions, including measures of wealth, industry mix, and religiosity.
After adding these variables to the original specification, the effect of partisanship is nearly unchanged in the model (1) specifications employing state-year fixed effects. Although the coefficient on partisanship is somewhat more imprecisely estimated in column (5) than in (1), it is no smaller. In contrast, in the model (2) specifications that do not incorporate state-year fixed effects, the coefficient in the column (6) specification is slightly smaller than in the column (2) specification.
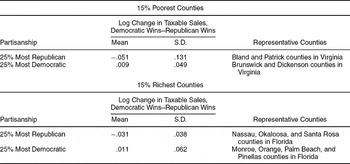
Although the parties are divided by both social and economic issues, income predicts partisanship fairly well, and the distributional policies of the parties often divide along class lines. The regressions reported in Table 4 show that the partisan differences in consumption are predicted by partisanship and not county income (once other factors are controlled for). To further explore the relationship between partisanship, income, presidential election outcomes, and consumption, we examined the relationship between partisanship and consumption for the wealthiest and poorest counties. Table 5 shows the average change in county taxable sales following Democratic wins minus the average change in consumption following Republican wins. The pattern of results in Table 5 is consistent with what we find in Tables 3 and 4. For example, the difference between Democratic and Republican counties holds even when we restrict our attention to poor counties. Table 5 shows that when we restrict our attention to the very poorest counties in our sample, following a Democratic victory the change in consumption was nearly 6 percentage points greater in the most Democratic than in the most Republican counties.
Average Change in Consumption Following Democratic Presidential Victories Minus Change in Consumption Following Republican Presidential Victories, by County Wealth and Partisanship

Note: County wealth classified on the basis of 2000 average per capita income. Log(Next year's 1q sales/Current year's 3q sales) 1992, 1996, 2000, and 2004 is for all counties for which data are available for at least one Democratic and one Republican presidential victory in this period. Partisanship breakdown, using county average presidential vote share from 1992 to 2004, is among counties within wealth categories. 50 to 139 counties in each cell. Pairwise T tests (one tailed) can each reject at the .002 level the null hypothesis that consumption changes are identical across levels of partisanship within levels of county wealth.
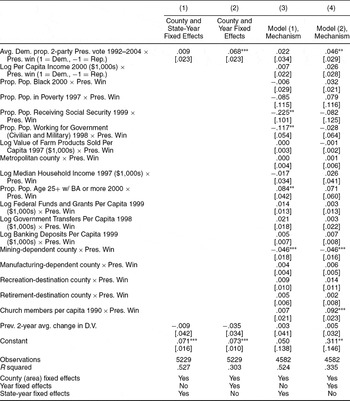
Our model predicts that the immediate increase in consumption will likely be sustained for some time after the election. However, the model is indeterminate as to how long that effect should persist. Once new information becomes available, for example, about the true state of the economy or likely policy outcome, then the life-cycle model predicts that partisan-tinged expectations will have to be reconciled with that new reality. What is unclear is when, over the period after a presidential election, citizens learn how well their partisan-tinged beliefs about economic performance will or will not coincide with economic realities. Thus, in addition to testing the effect of partisanship on changes in consumption from the 3rd quarter prior to the election to the first quarter after it (which is two to five months after the election), we also explored changes in consumption from the third quarter prior to the election to the third quarter in the year after it (eight to ten months after the election). Table 6 presents these results.
Persistence of Effect of Partisanship and Election Outcomes on Local Consumption

Note: Fixed effects for county (area) included in all models. Dependent variable is Log(Next year's 3q sales/Current year's 3q sales). Sample restriction is the same as for Table 3.
Robust standard errors in brackets, clustered at the county level. *Indicates significant at 10%; **significant at 5%; ***significant at 1%, two-tailed tests, except for one-tailed tests for partisanship × election outcome variables in columns (1)–(4).
The dependent variable in all columns is the change between the 3rd quarter of the election year and the 3rd quarter (rather than the 1st quarter, which is used in the previous tables) of the year following the election.Footnote 15 We find that in the column (1) and (3) specifications, which use the model (1) approach with state-year and county fixed effects, the long-term effect of the interaction between partisanship and the election outcome is smaller than the immediate effect and not statistically significant. In column (1), the coefficient is .009, with a standard error of .023. Addition of the mechanism covariates used in Table 4 increases the estimated effect size to .022, about 27% smaller than the result for a similar specification shown in column (5) of Table 4, although here the coefficient is much less precisely estimated (standard error of .034). (Note also the reduction in sample size, as in Table 4, caused by missing county-level covariates.) In contrast, employing the model (2) specification, which includes only county and year fixed effects, produces estimated effects that are statistically significant and larger than those shown in the corresponding columns of Tables 3 and 4. The contrast between the model (1) and model (2) results underscores the potential importance of state-level omitted variables within individual state-year combinations that are correlated with these longer-term changes in consumption.
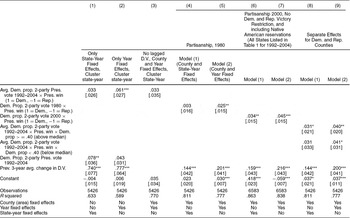
Table 7 presents additional robustness checks for the finding about the relationship between county partisanship and the immediate increase in consumption following an election. This result, presented in Table 3, columns (1) and (2), is affected by certain changes in model specification.
Sensitivity of Estimates of Effect of Partisanship and Election Outcomes on Local Consumption

Note: Dependent variable is Log(Next year's 1q sales/Current year's 3q sales). Sample is years 1992, 1996, 2000, and 2004. Except in columns (6) and (7), analysis is restricted to all areas for which data are available for at least one Democratic and one Republican presidential victory in this period.
Robust standard errors in brackets, clustered at the county (area) level unless otherwise specified. *Indicates significant at 10%; **significant at 5%; ***significant at 1%, two-tailed tests, except for one-tailed tests for partisanship × election outcome variables in columns (1)–(9).
Columns (1) through (3) of Table 7 examine the robustness of our results to different sets of fixed effects and approaches to clustering of standard errors. In column (1), we rerun the base model (1) specification excluding county fixed effects while clustering standard errors at the state-year level. The coefficient on the interaction between county partisanship and the election outcome does not change, although the standard error increases somewhat relative to that shown in Table 3, so the coefficient now falls just short of statistical significance (column [1], p value = .10). Column (2) alters the base model (2) specification by dropping county fixed effects and estimating the standard errors clustering at the state-year. The estimated effect on consumption of partisanship and election outcomes is statistically significant and larger than the corresponding result in Table 3. In column (3), we rerun the base model (2) specification, this time excluding the lag of the dependent variable while clustering at the state-year level. The magnitude of the estimated effect is identical to that shown in column (1) of Table 7, but the standard errors are much larger (p value = .18).
In columns (4) and (5), we replace the Average 1992–2004 Democratic presidential vote share with the 1980 Democratic vote share. In the column (4) specification employing state-year fixed effects, the estimated effect of partisanship is about 90% smaller than in the base model (1) result and is no longer statistically significant. This attenuation is consistent with fixed effects raising the share of measurement error in the independent variable (partisanship) because election outcomes within states in 1980 may be less informative of contemporary differences in preferences. In the column (5) specification, which has only county and year fixed effects, the result is statistically significant and larger than the result shown in base model (2). This suggests that our previous results are neither artifacts nor caused by some simultaneity between expected economic performance and observed partisanship (e.g., posttreatment bias).
In columns (6) and (7), we employ a measure of partisanship from a single year: 2000. This allows us to measure partisanship for Maine ESAs and Vermont towns. In addition, we relax our previous restrictions that (1) a county not include a Native American reservation, and (2) we observe a county after both a Democratic and Republican victory. In columns (6) and (7), the estimated effect of partisanship is about 10% larger than the effects shown in the corresponding base models, presented in Table 3 (columns [1] and [2]).
Finally, in columns (8) and (9), we allow there to be separate effects of partisanship interacted with the election outcome in Democratic (Pres Win × Dem. prop. 2-party vote, 0 if Dem. prop < .4) and Republican counties (Pres Win × Dem. prop. 2-party vote, 0 if Dem. prop ≥ .4). There is no evidence of differential response in these two sets of counties, however. The coefficients for each type of county are nearly identical to each other and to the constrained estimate shown in Table 3 base models (1) and (2). This finding, in addition to the results shown in Figure 2, also suggests that the linearity assumption imposed in the base specification is appropriate.
CONCLUSION
Partisanship is central to our conception of political behavior. There is ample evidence linking partisanship to candidate choice and political participation. Furthermore, it is claimed that partisanship affects how citizens see the world. The contention that partisanship is an active force, producing subsequent differences in beliefs and expectations, is a striking claim. An indication of the broad scope of such partisan influence is provided by survey evidence of large differences in partisan assessments of both economic performance and economic expectations. Survey evidence that partisans believe that their party has done well or that they expect their party to produce superior performance, however, may be interpreted as a survey response rather than as serious economic judgments. This article extends the work on partisanship and economic assessments by examining whether economic behavior is consistent with the robust pattern of partisan differences observed in surveys.
The analysis of county-level taxable sales provides evidence that partisanship is associated with postpresidential election consumption behavior. In the absence of this behavioral confirmation, it is unclear whether survey responses were reliable indications of deep-seated beliefs or simply expressions of support for the respondents’ preferred party. Our findings lend support to the view that these responses should be interpreted as indicators of beliefs about the economy rather than general expressions of party support.
This article makes four contributions to the literature on political behavior. First, we provide evidence that real economic behavior is consistent with the pattern of partisan differences in economic assessments observed in surveys. Observed economic behavior is therefore consistent with the general contention that partisanship shapes the way citizens see the world of politics and public affairs. Had we found no partisan differences in consumption following elections, this would have cast doubt on the importance of survey reports of different partisan expectations regarding the economy, as well as on the whole collection of partisan-tinged responses to economic assessment items. Given that some believe that the differences in partisan assessments stem from perceptual biases, showing that perceptual differences appear to be real rather than a survey artifact bolsters the claim that partisanship causes real perceptual bias. Because perceptual bias is a (perhaps the) key channel through which partisanship affects political behavior, our failure to discredit the survey reports of partisan divergence is a step toward more firmly establishing the empirical significance of perceptual bias and partisanship.
Second, the finding that behavior is consistent with survey reports of economic expectations lends a measure of added credibility to analysis of political behavior through surveys. Determining whether the link between partisanship and survey measures of economic performance is an artifact or real speaks to the important methodological question of how much confidence political analysts should have in surveys as tools for studying political behavior. Despite the ubiquitous presence of survey data in political analysis, previous attempts to validate survey responses beyond demographic information are rare and mostly limited to voter turnout.
In addition, there is a subtle difference between our work and prior attempts to validate survey responses. For many survey items, the validation exercise is to confirm that reported behavior did in fact occur. Previous work examining the accuracy of survey response compares reported behavior against administrative records. Although there are practical difficulties with this process, it is a conceptually straightforward accounting problem. Our problem is more complicated because there is no way to directly verify subject attitudes. Instead, we must identify an observable implication of the attitudes expressed in a survey and then use this observable implication to infer something about the attitudes used in decision making. Of course, one unavoidable hazard to this effort is that if the theory used to connect attitudes to behavior is flawed, inferences about the validity of the survey measure can be compromised by errors in the theoretical link between attitudes and the observable behavior.
Third, our work suggests that citizens respond quickly to political events and alter their consumption behavior in anticipation of policy and economic changes they expect to occur.Footnote 16 This is a more complex behavioral response than using a rule of thumb to adjust current behavior in response to actual changes in income or even in response to passage of a particular piece of legislation. A striking feature of our results is that a change in consumption occurs between the third quarter preceding an election and the first quarter following it. During this period, no new major legislative initiatives are typically passed, let alone implemented. It is also implausible that there were any important administrative changes affecting family income. Rather, citizens appear to be adjusting their consumption based on expected income rather than today's income.
More recent theoretical models in political economy sometimes assume that voters alter their political behavior in response to the anticipated effects of economic policies. Are such models, where voters incorporate future considerations into current decisions, plausible? Our findings suggest that they are—citizens appear to anticipate future outcomes associated with resolving uncertainty about which party will control the presidency before those policy outcomes occur. More specifically, there is an ongoing debate over whether voters are “peasants,” who evaluate candidates by looking back over the past and extrapolating forward, or “bankers,” who observe where the economy is today but also give politicians “credit” for foreseeable improvements in current conditions (Erikson, MacKuen, and Stimson Reference Erikson, MacKuen and Stimson2000; MacKuen, Erikson, and Stimson Reference MacKuen, Erikson and Stimson1992). Our finding suggesting that citizens alter their current behavior in response to political events that yield future income further supports the notion that voters might alter their voting behavior in anticipation of future economic events.
A final contribution of our analysis is to encourage an examination of how political events affect mass behavior. Many previous studies have shown that nonpolitical events, such as economic performance, affect political behavior, such as voting. There is, however, little research on the reverse relationship, the effect of politics on mass economic behavior.Footnote 17
Our analysis nonetheless leaves some important questions unanswered. Our investigation of consumption changes was motivated by ex ante hypotheses regarding how partisanship might influence the individual response to changes in partisan control of the White House. The estimated effect of presidential party was consistent with the hypothesis that individual partisanship shapes perceptions and in turn drives consumption. However, the estimated effect was quite large, and perhaps too large, to be explained solely by individual responses to political events. Our model estimates show that, compared to a county that is equally Democrat and Republican, in counties that are 30 percentage points more Democratic than Republican (the county's Democratic vote share is .65), consumption following a Democratic win is approximately .9% higher than it would have been had a Republican won.Footnote 18 Ignoring other differences between Republicans and Democrats within counties, to account entirely for this county-level effect through a common individual partisan response would require that, all else equal, Republicans (35% of the population in the example) respond strongly to a Democratic presidential win by reducing consumption by roughly 3 percentage points and Democrats (65% of the population in the example) increase consumption by the same amount.Footnote 19 In contrast, the relatively modest change in overall consumption could also be produced if each of the citizens in an area increased their consumption by .9% after a Democratic win in places that were “heavily” Democratic. Although we attempt to model county-level changes in consumption through the use of control variables tailored to various ideas about why countywide consumption changes might occur, to explore this issue further it would be helpful to have data on individual partisanship and consumption, which, alas, are not readily available. More generally, it would be interesting to use individual-level data on other behaviors related to expectations about the future to see if there are correlations between behavioral changes and partisanship at both the individual and area level. Among other things, we might measure whether people who do not share the partisanship of the majority, but live in partisan areas, tend to mimic the behavior of their partisan neighbors. Uncovering evidence of these social effects would be a fascinating complement to the empirical results we report.
Furthermore, we attribute the partisan pattern in the change in consumption to partisan differences in expectations regarding national economic performance. As we discuss in the text, some of the partisan response to the election might be due to partisans expecting a more or less favorable distribution of national income following the election. We show that our conclusions are robust to controlling for measures of many such distributional factors, but it is impossible to remove all doubt. Despite our attempts to investigate the implications of geographic targeting, it is possible that some portion of the partisan response to the election is due to the anticipation of targeted benefits.Footnote 20 Democratic areas may expect that, when a Democrat wins the White House, spending will be targeted to their area. If individual-level data were available, we could examine differences in how spending reacts to an election result by Democratic and Republican partisans, controlling for the partisan composition of their geographic area.
Finally, we rely on average presidential vote share to proxy county partisanship. Although vote shares are very highly correlated with geographic variation in partisanship, use of a proxy variable introduces the possibility of measurement error, which tends to attenuate estimated coefficient estimates. This concern might be addressed by merging validated behavioral measures with survey data that measures partisanship. Until this issue and the others mentioned previously are fully addressed, our empirical findings and interpretations should be considered as an initial, but far from final, step in establishing the link between partisanship and real economic decisions. These qualifications aside, this article provides evidence that there are gains to be made from refining our understanding of how partisanship works and, more generally, from improving our knowledge about how citizens form their opinions about politics and public affairs. Our research suggests that the behavior of citizens as partisan consumers extends beyond surveys into important social and economic interactions in society at large.
APPENDIX: PROOF OF MODEL PREDICTIONS
For convenience, assume that the consumer is a Democrat. The consumer's problem is
Choose C1, C2D, C3D, C2R, C3R to
Maximize: p[U(C1) + U(C2D) + U(C3D)] + (1 − p) [U(C1) + U(C2R) + U(C3R)]
Subject to: C1 + C2D + C3D = YD, C1 + C2R + C3R = YR, where for compactness Yj is the income to the consumer when party j wins the election.
Substituting the budget constraints into the maximand, we have
Maximize: p[U(YD – C2D – C3D) + U(C2D) + U(C3D)] + (1 − p) [U(YR – C2R – C3R) + U(C2R) + U(C3R)].
Suppose that utility for each period is quadratic: AC – BC2, where A and B are greater than 0, and C is the consumption level. Differentiating with respect to consumption levels and setting the result equal to zero produces 4 equations and 4 unknowns. Solving for consumption levels yields:


where E(Y) = p YD + (1 − p) YR. To solve for the first period consumption, use (1) or (1)′ and the budget constraint.
To show how (1) matches the results reported in the text, we can rewrite YD = E(Y) + (1 − p)D, where D = YD − YR. Substituting for YD in (1) reproduces the result.



Comments
No Comments have been published for this article.