1 Introduction
A well-established finding in experimental phonology is that word-likeness judgements are gradient: when evaluating the phonological acceptability of made-up words, listeners systematically exhibit fine-grained preferences for some strings over others (Coleman & Pierrehumbert Reference Coleman, Pierrehumbert and Coleman1997, Vitevitch et al. Reference Vitevitch, Luce, Charles-Luce and Kemmerer1997, Bailey & Hahn Reference Bailey and Hahn2001). In many cases, these preferences have been attributed to the composition of onset clusters: given a set of monosyllables like {blick, dwick, bnick, lbick}, English speakers do not make a binary distinction between the accidentally absent and the completely impossible (blick, dwick ≻ *bnick, *lbick), as predicted by traditional phonological theory (e.g. Halle Reference Halle1959, Hooper Reference Hooper1972, Prince & Smolensky Reference Prince and Smolensky1993). Instead, their judgements tend to fall on a continuum, such that blick ≻ dwick ≻ bnick ≻ lbick (e.g. Scholes Reference Scholes1966, Daland et al. Reference Daland, Hayes, White, Garellek, Davis and Norrmann2011). These judgements are generally taken to reflect the speakers’ phonotactic grammar – the part of their phonological knowledge concerned with sound-sequencing patterns. Fine-grained sensitivity to these patterns is difficult to capture in classical models that cast phonotactics in terms of absolute restrictions, leading to the alternative view, which is that phonotactic knowledge is gradient rather than categorical. This view has received support from a variety of psycholinguistic studies, which have repeatedly shown gradient processing asymmetries related to phonological structure (Vitevitch et al. Reference Vitevitch, Luce, Charles-Luce and Kemmerer1997, Luce & Pisoni Reference Luce and Pisoni1998, Berent et al. Reference Berent, Steriade, Lennertz and Vaknin2007). Recent modelling efforts have attempted to capture this gradience by imputing a stochastic component to the grammar (e.g. Coleman & Pierrehumbert Reference Coleman, Pierrehumbert and Coleman1997, Boersma & Hayes Reference Boersma and Hayes2001, Hammond Reference Hammond2004, Hayes & Wilson Reference Hayes and Wilson2008, Albright Reference Albright2009, Coetzee Reference Coetzee and Parker2009).
Two kinds of factors have been implicated in the gradient well-formedness of nonce forms. The first is the influence of the lexicon: novel forms elicit favourable responses and enjoy certain processing advantages to the extent that they receive lexical support. One way to operationalise this support is in terms of frequencies, transitional probabilities and other statistics accumulated over sublexical units such as segments, syllables and subsyllabic constituents. Nonce forms featuring frequent or highly probable sequences of such units are repeated faster, remembered better and judged as more natural-sounding than forms composed of rare sound combinations (Coleman & Pierrehumbert Reference Coleman, Pierrehumbert and Coleman1997, Vitevitch et al. Reference Vitevitch, Luce, Charles-Luce and Kemmerer1997, Frisch et al. Reference Frisch, Large and Pisoni2000, Bailey & Hahn Reference Bailey and Hahn2001). A related way to measure lexical support is in terms of similarity to real words. A common similarity metric is ‘edit distance’, defined as the number of phoneme additions, deletions or substitutions required to change one string into another (Levenshtein Reference Levenshtein1966). Words within one edit from an item are said to comprise that item's phonological neighbourhood (Luce & Pisoni Reference Luce and Pisoni1998); the size of this neighbourhood correlates with well-formedness ratings and production accuracy (Bailey & Hahn Reference Bailey and Hahn2001, Hammond Reference Hammond2004, Arnold et al. Reference Arnold, Conture and Ohde2005). For the monosyllables blick and dwick, both of which feature attested onsets, the well-formedness asymmetry is transparently projected from the lexicon: blick features eleven phonological neighbours to dwick's two, and bl is about 13 times more likely than dw to begin a word.Footnote 1
The second factor often associated with well-formedness of a monosyllable is the sonority profile of its onset. Several sonority scales, varying in granularity, have been proposed in the literature (see Baertsch Reference Baertsch2012 for a review); a representative coarse scale, from Clements (Reference Clements, Kingston and Beckman1990), is shown in (1), with natural classes increasing in sonority from left to right.
(1)


Cross-linguistically, syllables tend to rise in sonority from edge to nucleus, with rises preferred in onsets and falls favoured in codas. For example, in languages that permit complex onsets, obstruents are generally featured on the periphery, with sonorants closer to the vowel. This typological generalisation has been formalised as the Sonority Sequencing Principle (SSP; cf. Sievers Reference Sievers1881, Jespersen Reference Jespersen1904, Selkirk Reference Selkirk, van der Hulst and Smith1982). According to the SSP, sonority rises are universally preferred in onsets, while falling profiles are favoured in codas.
The origin and cognitive status of sonority are controversial. Some researchers propose that the SSP is innate and synchronically active (Berent et al. Reference Berent, Steriade, Lennertz and Vaknin2007), others claim that sonority is phonetically grounded in perception or production (Parker Reference Parker2002, Wright Reference Wright, Hayes, Kirchner and Steriade2004, Redford Reference Redford2008) and still others argue that sonority-based preferences can be captured with a sufficiently specified lexicalist model (Daland et al. Reference Daland, Hayes, White, Garellek, Davis and Norrmann2011). Whatever its ontological status, the SSP appears to be a useful generalisation, in that it predicts not only word-likeness judgements but also perception accuracy of non-native consonant clusters. For example, among unattested word onsets, those with falling sonority profiles are more likely to be misperceived with an epenthetic schwa than sonority plateaus, which in turn induce perceptual epenthesis at rates higher than rises (p([ləbɪf]|[lbɪf]) > p([bədɪf]|[bdɪf]) > p([bənɪf]|[bnɪf]); see Berent et al. Reference Berent, Steriade, Lennertz and Vaknin2007).This effect appears to hold even for speakers of languages which prohibit complex onsets altogether (Berent et al. Reference Berent, Lennertz, Jun, Moreno and Smolensky2008). The effects of sonority on production accuracy are somewhat less clear. On the one hand, cluster-reduction patterns in children's productions seem to be motivated by the preservation of the best sonority profile available (Ohala Reference Ohala1999). On the other, cluster repairs by adult speakers appear to be sensitive to phonetic factors beyond the scope of the SSP (Davidson et al. Reference Davidson, Jusczyk, Smolensky, Kager, Pater and Zonneveld2004, Wilson et al. Reference Wilson, Davidson and Martin2014).
In summary, people's sensitivity to sound sequences clearly goes beyond categorical distinctions. In some cases, the performance is captured by a straightforward projection of lexical statistics; in others, sonority appears to be at least a useful cover term. Given this sensitivity to gradience, a number of interesting questions arise regarding the relationship between phonotactics with the rest of phonology. How is fine-grained phonotactic knowledge deployed by the grammar? To the extent that other phonological processes interface with this knowledge, what is the relevant level of detail? Does all of phonology respond to gradient phonotactics, or are there processes which rely on more coarse-grained phonotactic generalisations?
In the present article, we address these questions by focusing on the metrical parse – the division of phoneme strings into syllables, which in turn form the constituents of metrical feet. Although this process has been a topic of much controversy, most researchers agree that syllable edges bear some resemblance to word edges (Pulgram Reference Pulgram1970, Vennemann Reference Vennemann1972, Kahn Reference Kahn1976, Clements & Keyser Reference Clements and Keyser1983). By this logic, it follows that at least some of the phonotactic generalisations that constrain word onsets and offsets should play a role in determining word-internal syllable boundaries. But what level of word-edge phonotactic detail is visible to the parsing grammar? Are syllable boundaries determined by categorical restrictions on well-formedness, or are they subject to a more fine-grained parsing algorithm? In other words, what is the phonotactic resolution of the metrical parse?
The mainstream view in phonology holds that syllable boundaries are determined with reference to rather coarse-grained phonotactics. This view is made explicit in two parsing heuristics of the derivational era: the Legality Principle (Treiman & Danis Reference Treiman and Danis1988), which constrains syllable edges to the set of attested word edges (at.las, not *a.tlas or *atl.as), and the Maximal Onset Principle (Pulgram Reference Pulgram1970), whereby the competition for intervocalic consonants is always resolved in favour of legal onsets over legal codas (hy.brid, not *hyb.rid). Treatments within the classical Optimality Theory (OT) framework (Prince & Smolensky Reference Prince and Smolensky1993) encode these two principles in the fixed ranking of violable constraints. For instance, a Law of Initials (LOI) constraint militating against unattested onsets (Raffelsiefen Reference Raffelsiefen1999, Hall Reference Hall2001; see Vennemann Reference Vennemann1972 for the original motivation) might outrank one against syllable codas (NoCoda), forcing the split-cluster parse in atlas, but preserving the complex onset in hybrid. Because the constraint rankings are fixed, they describe a deterministic parser where syllable boundaries are completely predictable for any input string.
A fixed constraint hierarchy cannot capture gradient word-edge phenomena, of course; at a minimum, such effects require a large number of fine-grained constraints plus some mechanism (e.g. constraint weights that yield variable ranking) which allows outputs to be selected in a probabilistic manner. Modern stochastic OT grammars feature both of these properties (e.g. Boersma & Hayes Reference Boersma and Hayes2001, Hayes & Wilson Reference Hayes and Wilson2008). How could a categorical parser be modelled with a stochastic grammar designed to capture gradience? One possibility is to model categoricity as extreme probability. For instance, NoCoda might have an extremely low probability of outranking individual constraints militating against unattested onsets, but a very high probability of outranking those banning attested onsets. This would yield a nearly categorical parser without the need for LOI, while at the same time preserving the relative rankings of the individual markedness constraints. Another possibility is to retain LOI, and assume that different processes interact with the constraint hierarchy in different ways. For example, the parser might appeal to the relative ranking of LOI ⪼ NoCoda when selecting the output, whereas well-formedness judgements might have access to the subhierarchy of lower-ranked, more specific constraints that determines the relative harmony of the losing candidates. Alternatively, the weight of LOI might vary based on lexical statistics. Well-formedness judgements might be driven by the weights of constraints violated by the judged form. Yet the parser may always choose to obey the higher-ranked constraint, regardless of its numerical weight, though this decision may take longer when the numerical difference between the weights of LOI and NoCoda is small. In other words, the candidate-evaluation procedure would need to differ depending on the task. Such hybrid grammar proposals have been advanced to account for the differences in sensitivity to OCP violations across tasks (Berent & Shimron Reference Berent and Shimron1997, Coetzee Reference Coetzee and Parker2009). If this kind of dual architecture applies to syllabification as well, the role of gradient phonotactics may be restricted to well-formedness judgements and processing speed, without necessarily affecting the parser's output.
Contrary to the traditional view, the metrical parse may be gradient rather than categorical. Such a parse would fall out naturally from a stochastic grammar, without the need to posit a separate, coarse-grained evaluation procedure. Here, the empirical question would be whether the sources of gradience that govern the parse are the same as those reflected in phonotactic judgements and other processing tasks. In principle, the influences of sonority and lexical support could be approached as orthogonal (though see Daland et al. Reference Daland, Hayes, White, Garellek, Davis and Norrmann2011). For instance, the parser might be sensitive to the statistics of word-edges: given medial C1C2 clusters, word-initially common sequences might prefer to syllabify as complex onsets, while C1 segments that are frequent in word-offset position might push for a split parse. Independently of this, syllabification might be guided by sonority, with the probability of a heterosyllabic parse rising as the sonority slope across the cluster grows more negative. Such a relationship would not only be consistent with the SSP, which, as discussed above, disprefers falling onsets, but also with the Syllable Contact Law (Vennemann Reference Vennemann1988), which prefers sonority falls across syllable boundaries.
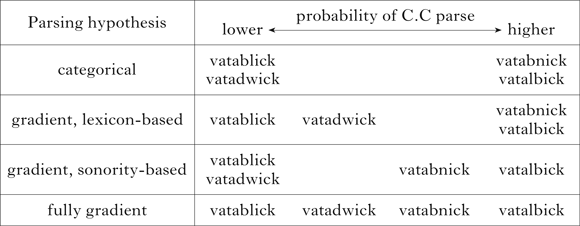
To illustrate, consider the set of pseudo-words discussed above, this time prepended with the sequence vata, in order to place the onsets in medial position: {vatablick, vatadwick, vatabnick, vatalbick}. What is the appropriate metrical parse of each cluster? Table I summarises the four logical possibilities discussed above. In the categorial model, the parser is phonotactically coarse-grained; all else being equal, syllable boundaries are predicted by the Legality Principle. Alternatively, the parse may be gradient, relying on fine-grained word-edge frequency, fine-grained sonority or both. In what follows, we test these four models in two experiments that probe the relationship between phonotactic and metrical knowledge from different angles. The two experiments utilise the same set of stimuli – trisyllabic nonce forms with embedded clusters and singleton consonants, similar in shape to the example items in Table I.
Predictions of four parsing models.

Experiment 1 is a pen-and-paper word-division task, where participants explicitly mark word-internal boundaries. Although this type of metalinguistic task has a long tradition in probing syllable representations (see below), it has never been applied to the questions of gradience pursued here. Experiment 2 is an online production task which exploits the relationship between English syllable structure and stress assignment (see §4.1). In previous work, this type of task has been used to investigate gradient weight phenomena (Ryan Reference Ryan2011, Shelton et al. Reference Shelton, Gerfen and Palma2012). Here, we rely on stress placement to infer syllable boundaries.
To anticipate the results, the studies converge on the finding that syllable boundaries are assigned with reference to fine-grained phonotactics. Moreover, the sources of gradience in the parse appear to match those previously found in processing asymmetries and well-formedness judgements of monosyllables described above: word-edge frequency and sonority each make independent contributions to syllabification. This consistency suggests that a single model of well-formedness is sufficient to account for the performance across any tasks that depend on the deployment of phonotactic knowledge.
The remainder of this paper is organised as follows: in §2, we review prior empirical work probing the nature of syllable boundaries, and present our own word-division experiment. In §3, the model trained on our pseudo-word data is tested on the results of Eddington et al. (Reference Eddington, Treiman and Elzinga2013a, Reference Eddington, Treiman and Elzingab), the largest hyphenation study conducted on English words to date. §4 begins with a brief review of the relevant facts of English stress, continues with a look at the statistics of stress in the lexicon, and concludes with the online stress-assignment experiment. §5 situates our findings with respect to phonological theory, and §6 briefly concludes the paper.
2 Experiment 1: word-division
2.1 Background
A long line of experimental work has explored various theoretical claims about syllable structure by examining how speakers chunk words into smaller units (Fallows Reference Fallows1981, Treiman & Danis Reference Treiman and Danis1988, Treiman et al. Reference Treiman, Straub and Lavery1994, Titone & Connine Reference Titone and Connine1997, Smith & Pitt Reference Smith and Pitt1999, Redford & Randall Reference Redford and Randall2005, Redford Reference Redford2008, Eddington et al. Reference Eddington, Treiman and Elzinga2013a, Reference Eddington, Treiman and Elzingab). The methods employed in these studies can be roughly divided into two categories: metalinguistic and implicit. In metalinguistic tasks, participants are usually provided with a disyllabic word or pseudo-word (written or auditory), and asked to insert a slash or a pause in a place that seems natural, to repeat or reduplicate one of the parts, to permute their order or to infix some element (see Côté & Kharlamov Reference Côté, Kharlamov, Cairns and Raimy2011 for a review). Implicit parsing experiments employ traditional psycholinguistic techniques such as short-term recall and structural priming.
For real English words, the results of these studies support a number of familiar theoretical positions. For example, stressed vowels tend to pull consonants into their margins, lax vowels attract codas and parsing judgements often respect morpheme boundaries (Treiman & Danis Reference Treiman and Danis1988, Treiman et al. Reference Treiman, Straub and Lavery1994, Titone & Connine Reference Titone and Connine1997, Eddington et al. Reference Eddington, Treiman and Elzinga2013a, Reference Eddington, Treiman and Elzingab). With regard to phonotactics, most of the findings have been framed in traditional categorical terms. There is widespread agreement that phonotactic legality plays a major role: word-initially unattested CC sequences almost always receive a heterosyllabic parse (Fallows Reference Fallows1981, Redford & Randall Reference Redford and Randall2005, Eddington et al. Reference Eddington, Treiman and Elzinga2013a). Some studies suggest that sonority affects syllabification behaviour; however, these arguments are often undermined by the fact that, because no English words feature SSP-violating onset clusters, it is difficult to determine whether the effect of sonority is indeed independent from that of the lexicon (e.g. Eddington et al. Reference Eddington, Treiman and Elzinga2013a).
That said, these studies also raise questions that warrant a closer look at phonotactics. First, participants exhibit a great deal of variability in parsing legal clusters like [bl] and [dw]. For example, in the Eddington et al. (Reference Eddington, Treiman and Elzinga2013b) large-scale study, nearly half of such clusters were split. It is conceivable that some of this variability may be explained by fine-grained phonotactic generalisations, perhaps projected from the lexicon. Second, a few studies have found sonority effects in the parsing of intervocalic singletons (Treiman et al. Reference Treiman, Straub and Lavery1994, Eddington et al. Reference Eddington, Treiman and Elzinga2013a), and sonority-based strategies have also been reported in word-segmentation and phonotactic learning experiments (Redford Reference Redford2008, Ettlinger et al. Reference Ettlinger, Finn and Kam2011). In light of these findings, we take a closer look at the relationship between phonotactics and the parse. In this section we probe this relationship with a common metalinguistic method, the hyphenation task.
2.2 Method
2.2.1 Participants
Forty-nine University of Oregon undergraduates took part in the experiment. All participants self-reported as monolingual native speakers of American English with no reading difficulties. All were enrolled in introductory psychology and linguistics courses, and received course credit for participating.
2.2.2 Stimuli
Target CC clusters and singletons were embedded in CVCV_VC context frames, yielding trisyllabic nonce forms. This pseudo-word structure was devised for the benefit of Experiment 2, which relied on the Latin Stress Rule to infer the parse and thus required trisyllables (see §4.1 for details). There were 75 unique inserts in total: 63 clusters and 12 singletons. The inserts varied in both sonority slope and word-edge frequency; furthermore, the clusters were divided into word-initially attested vs. unattested. Sonority slope captured both the direction and magnitude of each insert's sonority profile. The measure was based on Jespersen's (Reference Jespersen1904) fine-grained sonority hierarchy, given in (2).
(2)

For CC inserts, sonority slope was calculated by subtracting the value of the first consonant from that of the second. For example, the values for pr, lv and lp were 6, ―2 and ―5, reflecting a steep rise, shallow fall and steep fall respectively. For singleton inserts, the sonority values were subtracted from 9, the value of a vowel. Word-edge statistics included the log-frequency of each insert in word onset position, and the log-frequency of each singleton (or C1 of each cluster) in word-offset position. These measures were based on a lexicon of 48951 English word forms, compiled by filtering the CMU pronouncing dictionary (Weide Reference Weide1994) to exclude words absent from the SUBTLEXus corpus of film and television subtitles (Brysbaert & New Reference Brysbaert and New2009), and subsequently removing duplicate entries. For all inserts, the counts in word-initial position were increased by 1; this was done to enable the log-transformation on unattested clusters. Appendix A contains the complete list of inserts along with their sonority values and word-edge frequency.Footnote 2
The inserts were hosted in 44 unique CVCV_VC context frames. Each cluster was embedded into two different frames; the singletons in two to five frames. The frames were distributed such that each one covered a similar sonority range. For example, the frames daka_uth and shepi_oph took the same set of inserts, producing the following pseudo-words: dakaduth, shepidoph (singleton), dakadwuth, shepidwoph (attested/rising), dakadmuth, shepidmoph (unattested/rising) and dakamduth, shepimdoph (unattested/falling). This yielded a total of 170 test items, listed in Appendix B.
2.2.3 Procedure
The experiment was administered individually in a laboratory setting. Each participant was given a sheet of paper containing a uniquely randomised list of all 170 test items printed in a 14-point, lower-case font. The participants were instructed to insert two slashes in each pseudo-word with a pen, dividing it into three parts. No overt mention of syllables was made; the instructions simply asked for a division that seemed most ‘natural’ to the participants. The task took approximately 15 minutes to complete.
2.2.4 Coding and analysis
There were 8330 responses in total (49 participants × 170 items). Of these, 283 (3.4%) were discarded because they constituted deviant parses, defined as yielding syllables with multiple vowels or with obstruents for nuclei. An additional 254 responses (3% of the total) parsed the embedded clusters entirely into the penult coda; because we were interested in complex onsets vs. splits, these responses were also excluded. The remaining 7793 responses (93.6% of the total) were included in the analysis.
The dependent variable was the syllabification of the inserts located between the penultimate and final vowels (.CC vs. C.C for clusters, and .C vs. C. for singletons). The predictors included word-initial status (singleton/attested CC/unattested CC), sonority slope, word-initial frequency of the insert and word-final frequency of the singleton/C1 of the cluster. All analyses were performed in R, using mixed-effects logistic regression models constructed with the lme4 package (Bates et al. Reference Bates, Maechler and Bolker2014). The models were fitted by the glmer() function, which uses the Laplace approximation and derives p-values from the normal distribution. Continuous predictors were centred and scaled, enabling direct comparisons of the standardised coefficients. All mixed models featured maximal random effects (Barr et al. Reference Barr, Levy, Scheepers and Tily2013); unless otherwise specified, this meant random intercepts for participant and frame, and random by-participant and by-frame slopes for all nested predictors. Where appropriate, additional details about individual model specifications are presented below.
2.3 Results
2.3.1 Categorical phonotactics
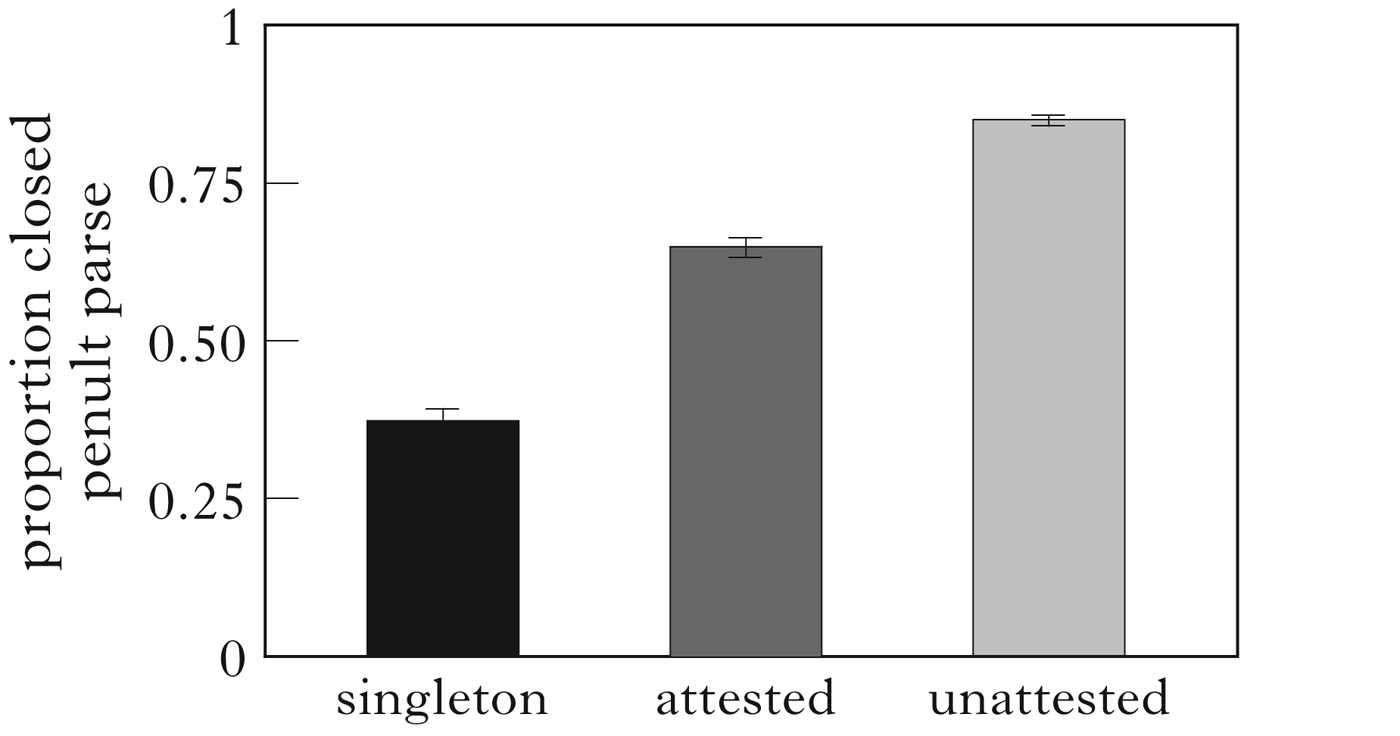
We begin by examining the influence of phonotactic legality. Figure 1 presents the proportion of closed penults as a function of insert status. For each group, the proportion was as follows: singleton 0.41; attested 0.71; unattested 0.94.
Closed penults by insert type. Error bars are 95% CI.

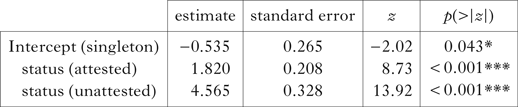
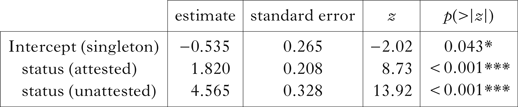
To check for the significance of this pattern, a mixed-effects logistic regression predicting the penultimate rhyme structure (V vs. VC) from the status of the insert was fitted to the data. The model featured by-participant and by-frame random slopes for the predictor, as well as random intercepts for participant and frame. The model output, given as Table II, revealed that items with both attested and unattested clusters featured significantly higher rates of closed penults than did words with embedded singletons. A subsequent planned comparison showed that unattested clusters were more likely to be split than attested clusters (β=2.76, SE=0.26, z=10.56, p<0.0001).
Categorical model output.
These results support the long line of research arguing that word-edge phonotactics play a role in determining syllable boundaries: initially unattested clusters are much more likely than attested clusters to be split. However, it is not clear that the phonotactic generalisations which guide the parser are categorical. First, the finding that singleton obstruents were more likely to be parsed as onsets than legal CC clusters argues that onset maximisation is not prioritised by the grammar, a conclusion also consistent with previous studies (e.g. Eddington et al. Reference Eddington, Treiman and Elzinga2013a). Second, the base rate of closed penults is surprisingly high – in spite of the requirement for filled onsets assumed in traditional theory (e.g. Itô Reference Itô1989), over 40% of singleton inserts were parsed into the coda. In other words, there was a great deal of variability in the treatment of legal clusters and singletons. Third, there was some variability within the illegal clusters as well. We now turn to the question of whether any of this variability can be explained by fine-grained phonotactic generalisations.
2.3.2 Gradient phonotactics
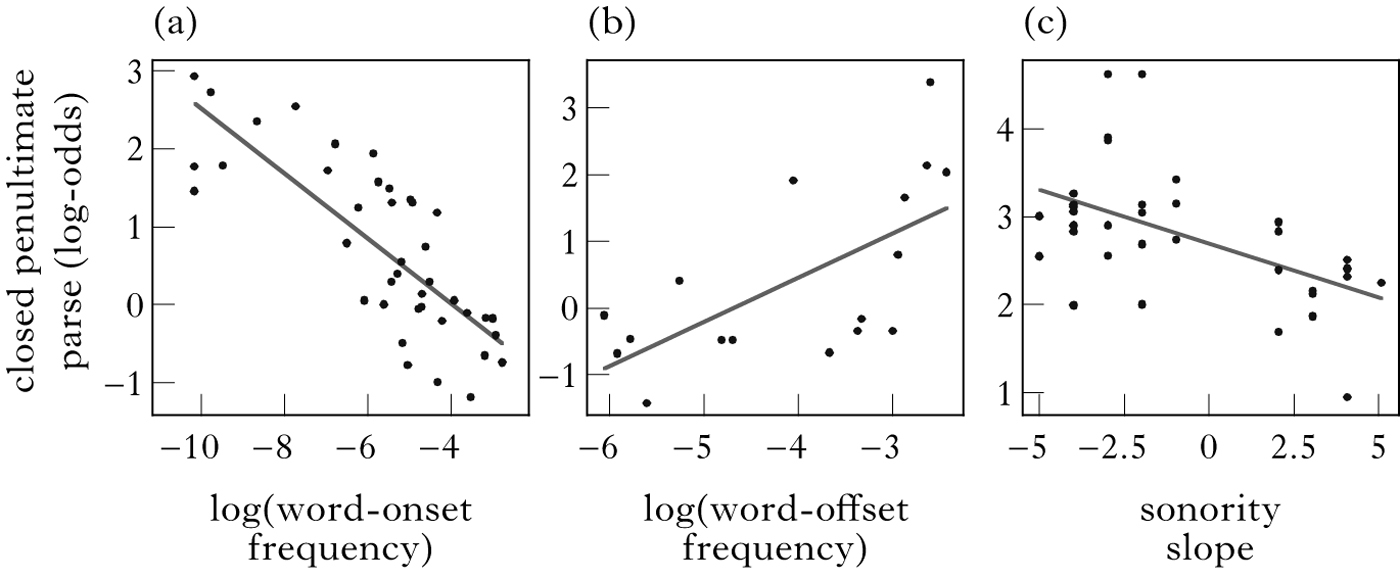
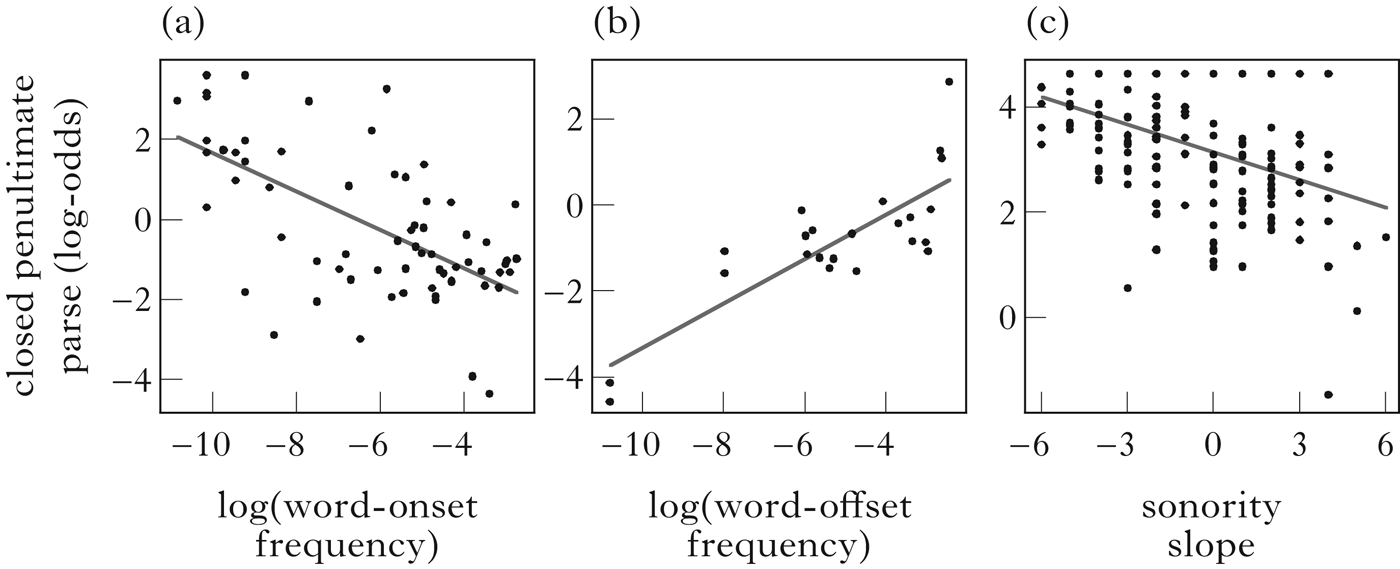
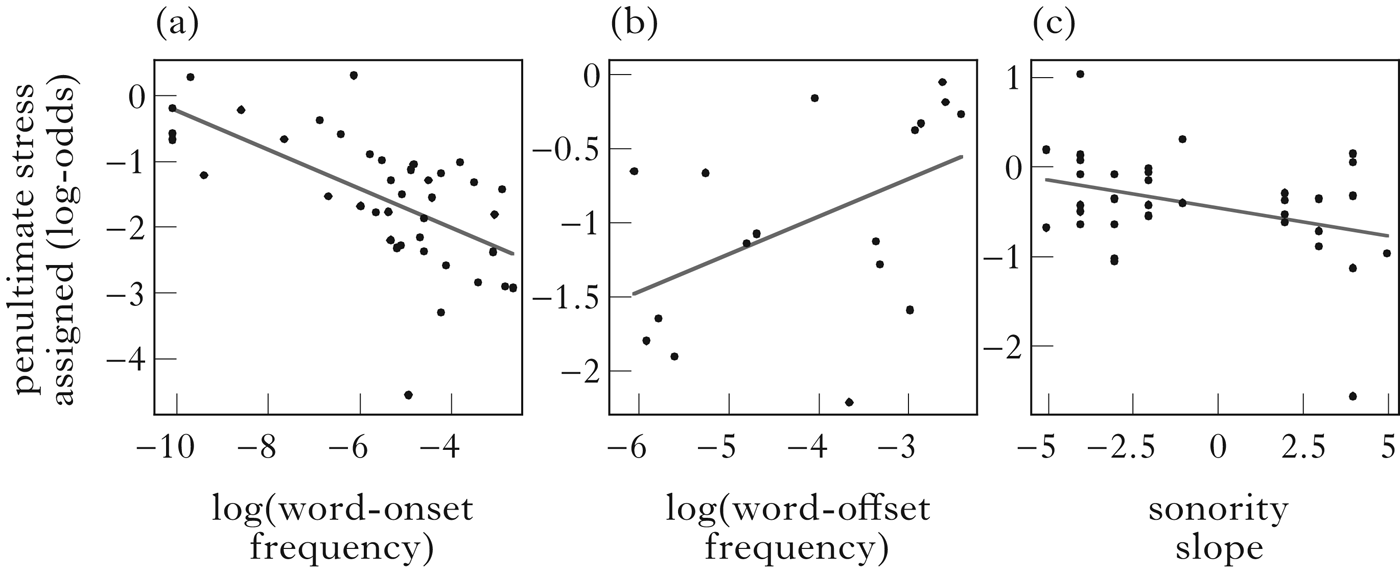
We begin by showing the individual correlations between the proportion of closed penults and each gradient predictor in Fig. 2. Fig. 2a shows the effect of word-onset frequency, with the data aggregated by insert. In order to avoid confounding frequency with legality (all unattested clusters have zero frequency, and could thus anchor the regression line), the data are restricted to singletons and attested clusters. The scatterplot suggests a relatively strong negative correlation: the more frequent an insert is in word-initial position, the less likely its initial (or only) consonant is to syllabify as a medial coda. (b) illustrates the effect of word-offset frequency of each insert's initial consonant. Since some inserts share the same C1, there are fewer data points than in (a). Even so, there seems to be a positive effect of this measure on parsing intuitions: frequent word offsets are more likely to parse as medial codas. Finally, (c) displays the effect of sonority slope. Because this measure is correlated with frequency (no attested clusters feature negative sonority profiles), the dataset is limited to initially unattested clusters. Recall from Fig. 1 that about 94% of these clusters were split – compared with the other insert types, there was relatively little variability in the responses. Nevertheless, sonority appears to account for some of this variability, with negative profiles leading to a higher likelihood of a heterosyllabic parse.
Closed penults by gradient predictors: (a) word-onset frequency (singletons, attested clusters; r=−0.79, p<0.001); (b) word-offset frequency (C1, all inserts; r=0.64, p<0.01); (c) sonority (unattested clusters; r=−0.53, p<0.001).
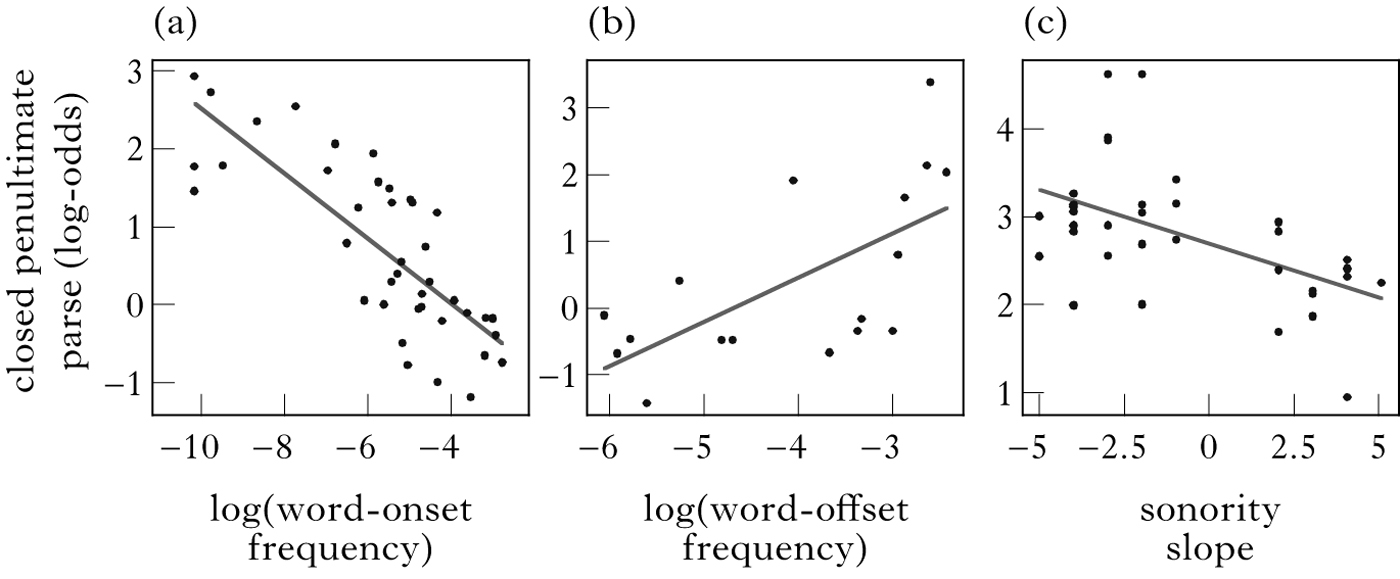
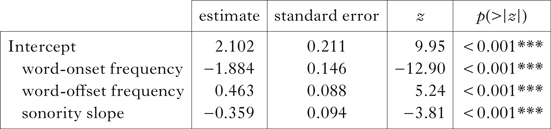
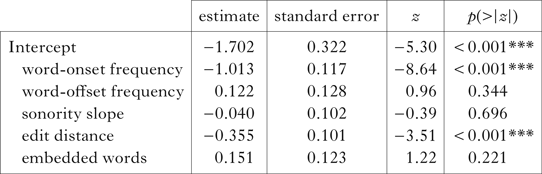
Taken together, the simple correlations suggest that gradient word-edge generalisations may be involved in parsing behaviour. To investigate this idea further, we constructed a mixed-effects logistic regression model containing all three gradient predictors. Because sonority slope was correlated with both word-onset frequency (r=0.74) and word-offset frequency (r=―0.45), it was residualised against these predictors prior to its inclusion in the model. This procedure effectively eliminated collinearity, and was justified on conceptual grounds: since both frequency measures are based on experience with the lexicon, we deemed it appropriate that they account for all of the variance shared with sonority. The output of the model is presented in Table III.
Gradient model output.
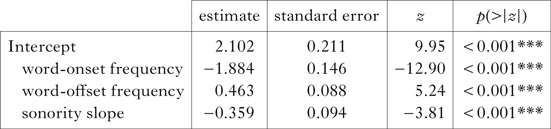
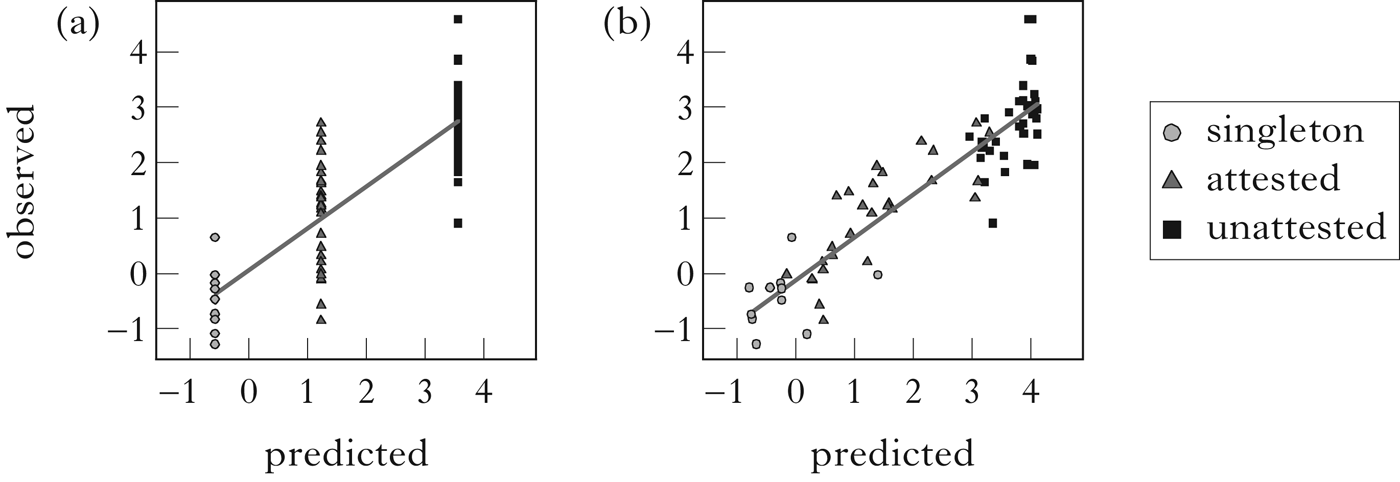
As can be seen, each of the predictors makes a significant independent contribution to the parse, and the effects are in the same direction, as shown in Fig. 2. To give a sense of how this model compares to the categorical model in Table II, we plot the observed vs. predicted values in Fig. 3. The predictions were generated by conditioning on the fixed effects (neither the subject-level nor the item-level variance components were used in the sampling).
Observed vs. predicted values for the two parsing models: (a) categorical model (BIC=5705, r 2=0.69); (b) gradient model (BIC=5457, r 2=0.82). Values are in log-odds.

As expected, the categorical model generated predictions at the three distinct levels of insert status, while the predictions of the gradient model were more evenly distributed across the range of values. The gradient model appears to be a clear improvement over the categorical model. In particular, both attested and unattested clusters seem to benefit from the fine-grained predictors. This conclusion is supported by the two fit statistics listed in the caption to Fig. 3. First, the gradient model accounts for approximately 13% more variance in the aggregate responses over the categorical model. Second, it features a considerably lower Bayesian Information Criterion (BIC) score. The BIC is a measure of fit which penalises model complexity: all else being equal, a model with fewer parameters has a better BIC score (lower scores are better). Because the gradient parser is more complex than the categorical one by virtue of having two additional predictors, it is important to compare the two on an equal footing. By punishing each additional predictor, the BIC aims to factor out any improvement due to potential overfitting.
2.4 Discussion
The results of Experiment 1 suggest that word hyphenation relies on relatively fine-grained phonotactic generalisations. Moreover, the sources of gradience found to predict parsing behaviour – word-edge frequency and sonority – are the same as those implicated in monosyllable well-formedness judgements and other processing tasks. Gradient behaviour was observed within both initially attested and unattested medial inserts, lending support to the idea that the parsing grammar recruits detailed phonotactic knowledge; of the hypotheses presented in Table I, the results appear to support the fully gradient model.
However, before this argument can be given much weight, there are several concerns about the generalisability of the results. Some of these involve the shortcomings of metalinguistic tasks in general; these will be addressed in subsequent sections. Here, we focus on two concerns specific to our stimuli. The first of these is the fact that, because the test probes were novel character strings, we cannot be certain how our participants interpreted the orthography. Specifically, recall that oral syllabification tasks have shown that vowel quality affects boundary placement, with short (lax) vowels attracting codas (e.g. Treiman & Danis Reference Treiman and Danis1988). It is thus possible that our participants based their responses on vowel quality rather than (or in addition to) insert phonotactics. Second, the use of pseudo-words, especially ones with little apparent similarity to real English words, invites the criticism that the participants treated the stimuli as somehow deviant or exceptional. If so, then their behaviour was less constrained by the native grammar, and thus provides little insight into the phonological parser.
In order to address both of these concerns, it is important to show that the results obtained in Experiment 1 generalise to items that do not suffer from the potential shortcomings of our stimuli. Real English words of course fit this description: the mapping between orthography and phonology is familiar to literate speakers, and lexical items must by definition obey the native grammar. In the next section, we test the gradient parsing hypothesis against the results of Eddington et al. (Reference Eddington, Treiman and Elzinga2013a, Reference Eddington, Treiman and Elzingab), where participants syllabified real English disyllables in a variant of a hyphenation task.
3 Generalising to real words
3.1 The data
The syllabification study conducted by Eddington and colleagues constitutes the largest experiment of its kind. The results were released in two companion articles (Eddington et al. Reference Eddington, Treiman and Elzinga2013a, Reference Eddington, Treiman and Elzingab): one describes the results for words with intervocalic singletons, while the other deals with medial clusters of up to four segments. In total, 4990 disyllabic words were distributed across 841 native English speakers; each participant parsed a list of 125 items, resulting in an average of 22 responses per word. The format was an online survey where participants were asked to choose from among alternative, quasi-phonemic parses of orthographically presented words (e.g. photon: fow/tahn or fowt/ahn).Footnote 3
In their analysis, Eddington et al. mainly focus on traditional phonological predictors. Among their findings, stressed syllables were found to attract consonants to both margins, lax vowels attracted codas, and syllable boundaries tended to follow morpheme boundaries. While word-edge phonotactic and orthotactic legality was largely observed by the participants, the Eddington et al. study did not pursue finer-grained measures of lexical support. On the sonority side, however, there was some evidence for gradience: in medial clusters, C1 sonorants were more likely than obstruents to be parsed into codas. While it is unclear whether this effect was independent of cluster legality, the singleton data clearly showed a gradient where the probability of coda syllabification followed the rhotic > lateral > nasal > obstruent sonority hierarchy.
In this section, we take a closer look at the phonotactics behind the Eddington et al. results. Our aim is threefold. First, we wish to determine whether gradient word-edge frequency can account for some of the variance, just as it did for the pseudo-words in Experiment 1. Second, we want to decouple sonority from legality, to test whether sonority slope can capture the behaviour of illegal clusters. Third, we wish to measure the extent to which individual clusters and singletons behaved similarly across the two studies, and the extent to which a model trained on our trisyllabic pseudo-word data succeeds in capturing the parsing of English disyllables reported by Eddington and colleagues.
3.2 Results
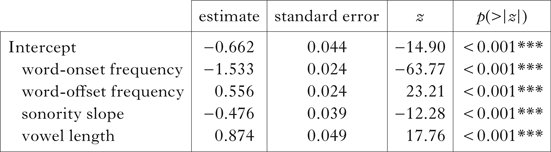
Figure 4 plots the individual effects of word-onset frequency, word-offset frequency and sonority slope on the parse. To match Experiment 1, the data included only words with medial singletons and CC clusters (longer clusters were excluded), resulting in a total of 3888 test items. The figure is organised to parallel Fig. 2, with (a) displaying the effect of onset frequency among the attested inserts, (b) the offset frequency of C1 and (c) the effect of sonority slope within the unattested word onsets. The caption displays the correlation statistics. With the exception of sonority, the plots and statistics both suggest that each measure makes a contribution to the parse. Furthermore, comparison with Fig. 2 indicates that the effects are in the same direction.
Closed penults by gradient predictors; data from Eddington et al. (2013a, b): (a) word onset frequency (singletons, attested clusters; r=−0.64, p<0.001); (b) word-offset frequency (C1, all inserts; r=0.60, p<0.01); (c) sonority (unattested clusters; r=−0.41, p<0.001).

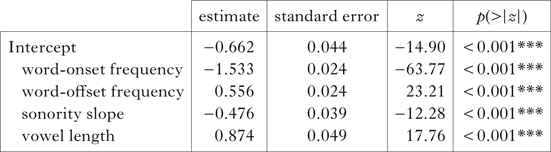
To test for the relative contribution of each predictor, we constructed a new logistic regression model.Footnote 4 Following the logic presented in §2.3, each predictor was centred and scaled, and sonority was once again residualised against the lexical support measures. Recall that ambiguous orthography was a shortcoming of Experiment 1, specifically because of a potential confound due to the fact that tense vowels are known to attract codas. To investigate whether the Eddington et al. participants independently relied on phonotactic knowledge, vowel length (tense vs. lax) was included in the model as a nuisance predictor. The output, shown in Table IV, indicates a significant effect of each phonotactic predictor, with the largest contribution coming from word-onset frequency of the medial inserts.
Gradient model output (data from Eddington et al. 2013a, b).
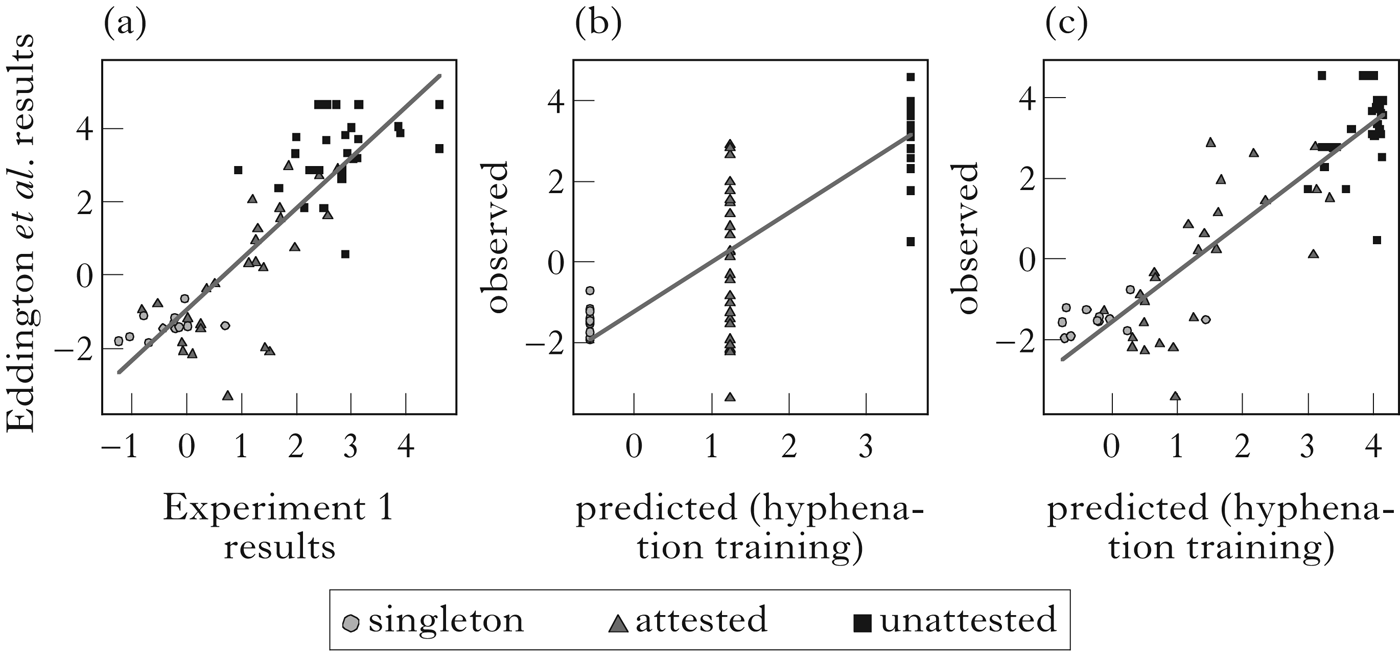
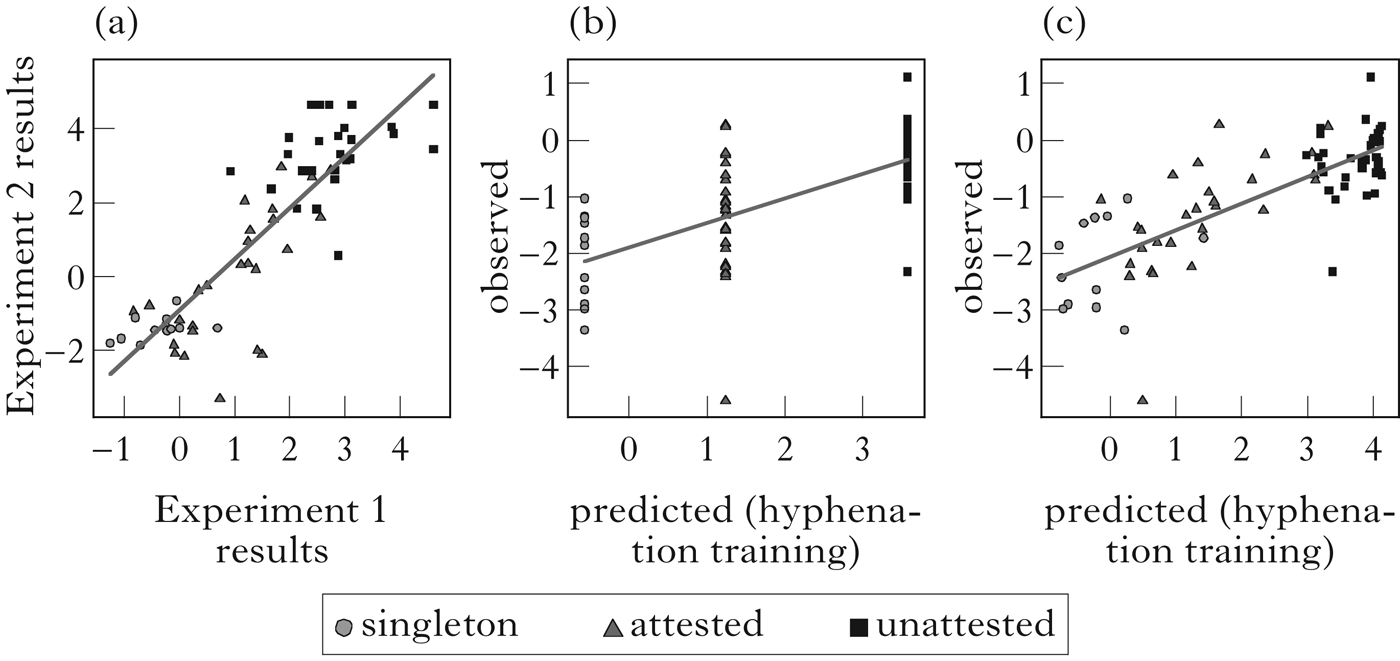
These results are very much in line with the findings of Experiment 1 in supporting the fully gradient model (Table I). The similarity is further explored in Fig. 5. The correlation between the responses on the 67 inserts shared by the two studies is plotted in (a), while (b) and (c) respectively display the fits of the categorical and gradient models trained on the hyphenation data from Experiment 1. As in Fig. 3, the predictions were conditioned on the fixed effects only.
Experiment 1 vs. Eddington et al. (2013a, b) results and model fits: (a) observations (r 2=0.74); (b) categorical model; Experiment 1 (r 2=0.69); (c) gradient model; Experiment 1 (r 2=0.81). Values are in log-odds.

The plot reveals a high degree of agreement between the two studies: regardless of whether they appeared in trisyllabic pseudo-words or real English disyllables, individual clusters and singletons were parsed in a very similar way. Furthermore, the gradient model trained on Experiment 1 outperformed the corresponding categorical parser, capturing about 12% more variance in the aggregate responses in the Eddington et al. (Reference Eddington, Treiman and Elzinga2013a, Reference Eddington, Treiman and Elzingab) study.
3.3 Discussion
The reanalysis of Eddington et al. (Reference Eddington, Treiman and Elzinga2013a, Reference Eddington, Treiman and Elzingab) yielded findings consistent with those of Experiment 1. Word-edge frequency and sonority made significant contributions to the parse across both studies, providing converging evidence for the gradient parsing model and indicating that the pseudo-word results were not contingent on some problematic aspect of the stimuli. Perhaps the most convincing argument for this hypothesis can be made on the basis of Fig. 5c – the finding that a fine-grained model trained on trisyllabic pseudo-words captured so much of the variance observed in shorter, real lexical items speaks to the robust nature of the gradient phonotactic predictors.
Although the consistency between the two parsing studies is encouraging for the fully gradient hypothesis (Table I), both experiments suffer from interpretation problems common to all hyphenation tasks. First, several researchers have warned that the metalinguistic knowledge tapped in such tasks applies at relatively late stages of stimulus processing, where word-division rules and other orthographic conventions may obscure the nature of the underlying phonological representations (Titone & Connine Reference Titone and Connine1997, Smith & Pitt Reference Smith and Pitt1999, Goslin & Floccia Reference Goslin and Floccia2007). Second, it is not clear that the participants in these tasks are parsing syllables rather than possible words. It is well-known that, across languages, word edges are not always coextensive with internal syllable edges (e.g. Pierrehumbert Reference Pierrehumbert and Keating1994, Hammond Reference Hammond1999), and several authors explicitly caution against interpreting all word-edge phenomena as indicative of syllable properties in general (Pierrehumbert Reference Pierrehumbert and Keating1994, Kessler & Treiman Reference Kessler and Treiman1997, Côté & Kharlamov Reference Côté, Kharlamov, Cairns and Raimy2011). It is thus possible that fine-grained word-edge phonotactic knowledge is relevant to word segmentation, but not necessarily to syllabification.
The argument for a fine-grained metrical parse would thus be bolstered by converging evidence from a task that specifically targets internal syllable boundaries. Furthermore, since the aim is to investigate the natural deployment of phonotactic knowledge, an implicit task would offer higher ecological validity than one where behaviour is mediated by metalinguistic introspection. Fortunately, there is a well-documented relationship between English stress and syllable structure. In the next section, we exploit this relationship to probe the nature of the metrical parse from another angle.
4 Experiment 2: online stress assignment
4.1 Weight-sensitive stress and productivity in English
The role of syllable weight is widely acknowledged in formal accounts of English stress (Liberman & Prince Reference Liberman and Prince1977, Hayes Reference Hayes1982, Reference Hayes1995, Halle & Vergnaud Reference Halle and Vergnaud1987, Kager Reference Kager1989). The traditional view holds that, in non-final syllables, stress assignment is sensitive to a binary weight distinction carried by the rhyme: light rhymes consist of a lax vowel (Å) and so carry a single mora, whereas heavy rhymes contain at minimum a tense vowel, a diphthong or a coda (VX), making them bimoraic. In weight-sensitive systems, heavy syllables attract stress, and in the case of English this is perhaps most clearly exemplified by the well-known Latin Stress Rule, whereby the main stress in trisyllabic and longer words tends to fall on the penult if it is heavy, else it falls on the antepenult. Under the Hayesian version of metrical theory, the Latin Stress Rule follows from the interaction of foot type, edge alignment and extrametricality: bimoraic trochees are constructed right to left, usually skipping the final syllable; main stress is then assigned to the head of the rightmost foot (see Apoussidou Reference Apoussidou2007 for a review of various OT approaches). To illustrate this phenomenon, consider the words stamina and cicada, which feature CÅ and CVV penults respectively. Their metrical parses are shown in (3) (syllable boundaries are indicated by periods, feet are enclosed in parentheses and extrametrical syllables in angle brackets).
(3)

As seen in (3), the light penult in stamina foots with the preceding syllable, whereas the bimoraic penult of cicada parses into its own trochee. The difference in stress follows from the fact that trochees are left-headed.
Although weight is associated with English stress, it is by no means completely predictive. The lexicon contains a multitude of other stress patterns, many of which compete with weight-sensitivity and with each other: nouns tend to behave differently from verbs, words of Latinate origin often pattern separately from the Germanic vocabulary, and compounds and affixed forms are said to follow their own rules (Kager Reference Kager1989). Collapsing across morphology, etymology and word class thus yields many surface exceptions to the Latin Stress Rule, with stress often landing on light penults (narˈcotics, speˈcific, toˈbacco, unˈpleasant) or skipping heavy ones (ˈanarchy, ˈdeputy, ˈhandicap, ˈpolygon). Nevertheless, experimental evidence suggests that English speakers acquire the weight generalisation (Guion et al. Reference Guion, Clark, Harada and Wayland2003, Ernestus & Neijt Reference Ernestus and Neijt2008, Moore-Cantwell Reference Moore-Cantwell2015), and appear to do so at an early age (Turk et al. Reference Turk, Jusczyk and Gerken1995, Kehoe Reference Kehoe1998, Redford & Oh Reference Redford and Oh2016). These results argue that, much like phonotactics, weight-sensitivity forms part of English speakers’ internal model of the language. In Experiment 2, we capitalise on this fact in order to explore the relationship between these two components of the grammar. Specifically, we use stress assignment as a means of probing the granularity of the phonotactic generalisations involved in the metrical parse. We provide our participants with trisyllabic pseudo-words like vatablick, ask them to produce each form and record the placement of primary stress. The crucial assumption is that, as long as the second vowel is realised as lax, antepenultimate stress implies that the cluster has been assigned to the onset of the final syllable, whereas stress on the second syllable is evidence of a closed penult, as in (4).
(4)

A similar technique has been employed by historical linguists to reconstruct the syllable structure of Classical Latin: given well-founded assumptions about vowel length, the syllabification of intervocalic consonants and clusters can be established on the basis of the regular rhythmic properties of verse (see Cser Reference Cser2012 for discussion). In Experiment 2, we use stress as an implicit, online measure of the parse; because the stimulus set is identical to that used in Experiment 1, we are able to investigate the same phonotactic generalisations.
4.2 Latin Stress in the English lexicon
Before introducing the experiment, we establish some basic expectations about online productivity of Latin Stress. To gauge the strength of the lexical basis for the pattern, we rely on the lexicon used to calculate the word-edge statistics in the preceding sections. Quantifying the relationship between heavy penults and stress involves several non-trivial decisions. First, in order to determine weight, the lexicon must be syllabified. Of course, the nature of the parse is the empirical question driving the present article; however, since the immediate aim is to establish a rough idea of the weight effect in the lexicon, we simply syllabified the lexicon according to the Maximal Onset Principle, ignoring morpheme boundaries.
The second choice concerns the weight criteria: how is weight to be parameterised? While we find the recent arguments for a gradient treatment of weight compelling, this type of model is beyond the scope of this paper (though see §5.1 for some discussion); for the sake of simplicity, we employ the traditional binary weight distinction. That said, our weight criteria require a brief description, since they differ somewhat from recent work in this area. First, whereas both Carpenter (Reference Carpenter2016) and Moore-Cantwell (Reference Moore-Cantwell2016) classify all monophthongal rhymes as light, we retain the distinction between tense and lax vowels. Hence, while these researchers treat [Ci] and [Cu] syllables as light, here they count as heavy. Second, we assume underlying vowel–sonorant sequences rather than syllabic sonorants, so that rhymes with these sequences count as heavy. This is the opposite approach from the one taken in Moore-Cantwell (Reference Moore-Cantwell2016), where syllabic sonorants in unstressed positions count as light.Footnote 5
The final issue involves assumptions about the relationship between the lexicon and phonological productivity. As noted above, the lexicon contains a number of stress patterns unrelated to syllable weight, with different lexical strata exhibiting different behaviour. Which subset of the lexicon should be taken as the appropriate basis for the generalisations extended to our pseudo-word stimuli? One relevant issue is word length: since the test probes are trisyllables, a prosodic template-based view might call for the search space to be constrained to trisyllabic words only. On the other hand, a more traditional approach based on a right-aligned stress window would include longer words. A second issue is the role of morphology: since many traditional stress rules reference different affixes and compounds, should complex words be included in the search if the test probes contain no transparent morphology? According to exemplar theories which assume the storage of all auditory experiences (e.g. Bybee Reference Bybee2001), the search space should be comprised of all word forms. In contrast, compositional theories of morphology argue that complex words do not contribute to productivity because they are computed rather than stored (e.g. Stockall & Marantz Reference Stockall and Marantz2006). The final issue is syntactic. It is well-known that English stress is affected by lexical class (e.g. Kager Reference Kager1989). For instance, among disyllables, nouns are more likely than verbs to feature initial stress, and native speakers are sensitive to this difference (Guion et al. Reference Guion, Clark, Harada and Wayland2003). While our experiment design encouraged the participants to interpret the stimuli as novel nouns (see below), we cannot be sure that the manipulation was successful; it is possible that the lexical search space extended beyond nominals.
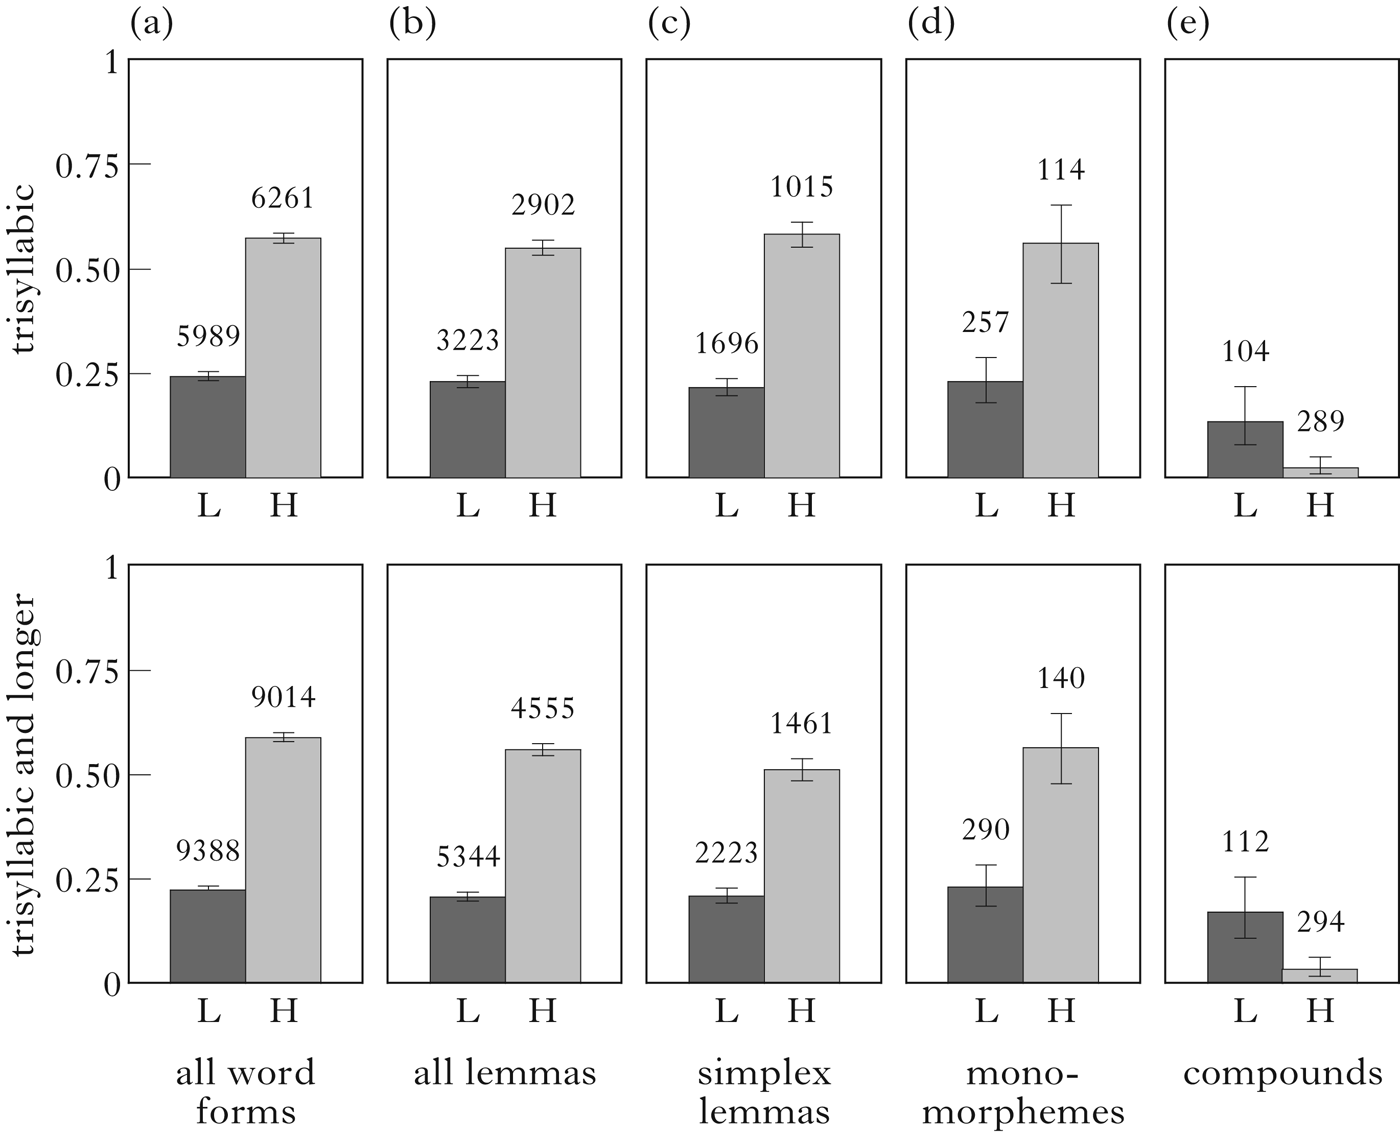
Rather than taking a theoretical position on these issues, we examined the interaction of Latin Stress with these different factors by measuring weight-sensitivity within different lexical strata. Fig. 6 plots the proportion of penult stress as a function of penult weight across all lexical classes (for simplicity, the figure excludes the small number of words with primary stress on syllables other than the penult or the antepenult). The top row of the figure constrains the lexicon to trisyllables only, whereas the bottom row includes longer words as well. Each column represents a different morphological stratum.
Latin Stress in different subsets of the English lexicon. Penultimate weight (L, H) is plotted on the x-axis, and the proportion of penultimate stress on the y-axis. Error bars are 95% CI. ‘All lemmas’ includes all derived forms, while ‘simplex lemmas’ only includes synchronically opaque morphology. The numbers above each bar indicate the number of words making up that category.

The figure shows that, as the search space becomes morphologically constrained from word forms to monomorphemes, Latin Stress remains remarkably robust; across the lexicon subsets, heavy penults are more than twice as likely to be stressed as light penults. This is true for both trisyllabic and longer words. Only compounds exhibit different behaviour: they are overall more likely to be stressed on the antepenult, and the weight generalisation appears to be reversed (though this is a numerically small effect).
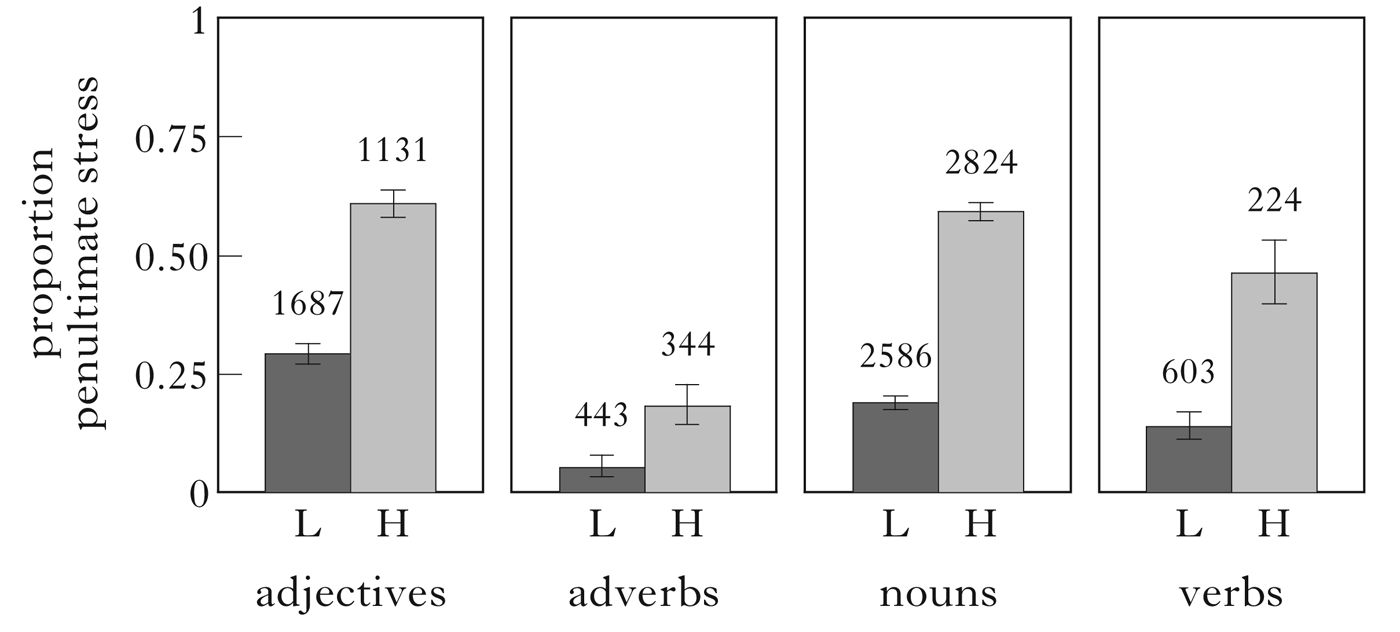
To provide an insight into the syntactic effect, Fig. 7 divides the lemmas in the lower row of Fig. 6b into adjectives, adverbs, nouns and verbs. Although there are differences in the overall rate of penult stress, the weight generalisation holds across all four major word classes.
Latin Stress across English lemmas, by major word class. Error bars are 95% CI.

This stability of Latin Stress throughout the lexicon is crucial for our purposes: because nearly every data subset supports weight-sensitivity to the same extent, we can reasonably expect this generalisation to guide stress assignment in our nonce forms. Only if the participants treat the stimuli as compounds will their behaviour diverge from this prediction.
4.3 Method
4.3.1 Participants
Thirty-six University of Oregon undergraduates were recruited for the study. All participants self-reported to be monolingual native speakers of American English with corrected-to-normal vision and no hearing impairments. Data from six participants were excluded: two due to self-reported dyslexia, and an additional four due to failure to meet the accuracy criterion of 60% usable productions (see below for fluency criteria). The data from the remaining 30 participants were analysed.
4.3.2 Stimuli
The target items consisted of the same 170 pseudo-words used in Experiment 1. In addition to these, 506 fillers were randomly generated with Wuggy software, which is designed to produce phonotactically legal pseudo-words (Keuleers & Brysbaert Reference Keuleers and Brysbaert2010). The fillers were 1, 2, 4 or 5 syllables in length, created by concatenating legal English syllables of various structures.
4.3.3 Procedure
The experiment was administered in a laboratory setting. The participants were seated alone at a computer screen in a quiet room. Test items were presented in a black lower-case font on a white background, randomly paired with images representing unique alien creatures. The participants were told that the words represented the creature names, a manipulation intended to contextualise the pseudo-words as nouns. Trial order was pseudo-random, with each target item separated by three fillers of varying length in order to minimise potential sequence effects between trisyllabic metrical frames. The trials advanced automatically after a time interval of five seconds for the targets and three to five seconds for the fillers, depending on length. The participants were instructed to consider each word silently, decide how to pronounce it so that it would sound as natural and English-like as possible, and finally to read it out loud. No mention of stress or syllables was made. A headset microphone was used to record responses for offline coding of stress placement and acoustic analysis.
4.3.4 Coding and reliability
Stress was coded offline by the first author, who relied on loudness, duration, pitch movement and vowel centralisation (see Cutler Reference Cutler, Pisoni and Remez2005). In the event of multiple productions within the five-second response window, only the final attempt was considered. Responses were coded into five categories: antepenultimate stress, penultimate stress, final stress, ambiguous stress and production error. A total of 5100 response trials were recorded (30 participants × 170 items). Of these, 956 (18.7%) were coded as errors, and excluded from the analysis.Footnote 6
Of the 4144 error-free responses, 174 (4.2%) featured tense or diphthong realisations of stressed vowels. These responses confounded the inference of syllable boundaries, because codas were not required to make the syllables heavy; they were therefore excluded from the analysis. Finally, 191 responses (4.6%) featured final stress and 364 responses (8.8%) elicited ‘ambiguous’ judgements. These items were included in the reliability check (see below); however, the main analysis was restricted to those productions where stress was clearly placed on either the antepenult or the penult. These amounted to 3415 tokens, about 82% of the error-free productions.
To assess the reliability of the coding, 878 randomly selected tokens (25.7% of the total, evenly distributed across the speakers) were judged by a second listener, who was a native English-speaker trained in phonetics and naive as to the experimental hypotheses. Agreement was near perfect (97.5% of cases; Cohen's κ=0.933, z=27.7). The coding was also checked against two acoustic correlates calculated over all 3779 error-free productions (including ambiguous stress but excluding final stress, stressed long vowels and diphthongs): the difference in mean intensity between V2 and V1, and the V2:V1 duration ratio. Linear regressions indicated that items coded as having penultimate stress featured significantly longer and louder penultimate vowels, whereas words perceived with initial stress had significantly longer and louder initial vowels. Ambiguous cases were intermediate on both measures.
4.3.5 Analysis
The dependent measure was stress location; recall that ambiguous and final stress were excluded from the analysis, yielding a binary outcome (antepenultimate, penultimate). This outcome was modelled using mixed-effects logistic regression models similar to those employed in §2 and §3. The set of predictors was identical, consisting of insert status (singleton, attested CC word onset, unattested CC word onset), word-initial insert frequency, word-final frequency of the insert's C1 and sonority slope.
In addition to the predictors of interest, the stress models included two nuisance variables. The first was intended to capture orthographic similarity of the stimuli to existing lexical items. The classic operationalisation of neighbourhood density was not appropriate, because none of our pseudo-words had any neighbours within one edit. Fortunately, recent studies have argued that, for long words, a better operationalisation of lexical similarity is the average edit distance to n-nearest neighbours (Yarkoni et al. Reference Yarkoni, Balota and Yap2008). In order to calculate our predictor, we first split the trisyllabic word-form lexicon (see the top row of Fig. 6a) into words with penultimate and antepenultimate stress, and measured the average orthographic edit distance from each nonce probe to the ten nearest neighbours from each set (see Keuleers Reference Keuleers2013 for an implementation in R). Having obtained two similarity scores for each test item – one for words with antepenultimate stress, one for words with penultimate stress – we subtracted the former from the latter, yielding our predictor: a measure of analogical bias for antepenultimate stress.
The second nuisance variable addressed the possibility that shorter words embedded in our stimuli might cue stress placement (e.g. mad in madaplaz might favour the antepenult, whereas gap in shigaple ff might push for penult stress). For each pseudo-word, we counted the total number of embedded lexical items, and subtracted the number of embeddings that favoured antepenultimate stress from that of penultimate stress cueing items. This procedure produced a measure of embedded word bias for penultimate stress, the second nuisance predictor.
As in the hyphenation models, all continuous predictors were centred and scaled. Model selection followed an ANCOVA-like procedure. In all cases, the initial model fitted all the main effects and interactions between both the predictors of interest and the nuisance variables. Reduced models progressively dropped the predictor–nuisance interactions and the interactions among the nuisance variables, in that order. Hierarchical model comparisons were performed with the anova() function in R, which performs a likelihood ratio test using the χ 2 distribution.
4.4 Results
4.4.1 Categorical phonotactics
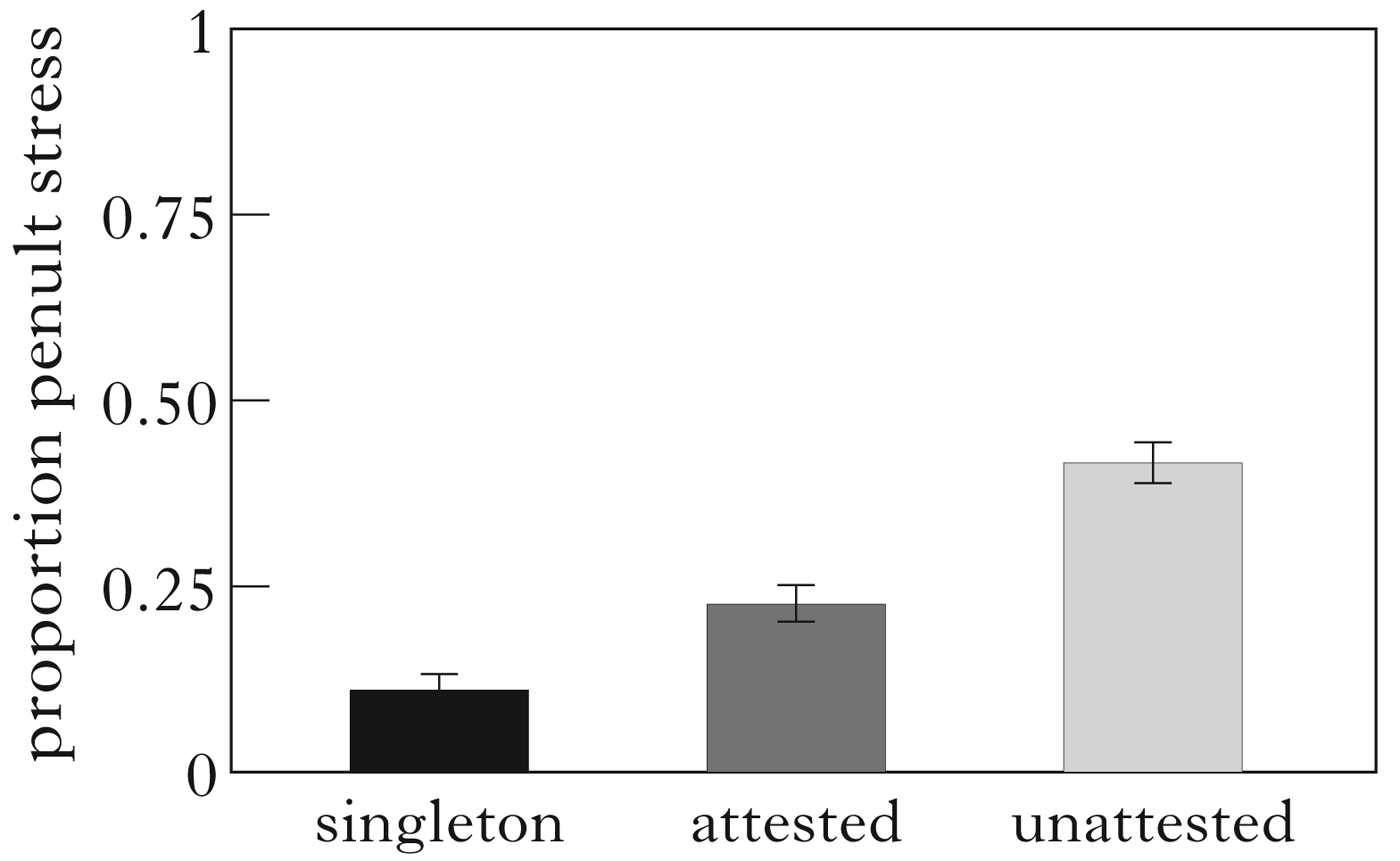
Overall, 897 of the 3415 valid responses were stressed on the second syllable. We begin by investigating the extent to which this distribution was modulated by the categorical phonotactic parse. Figure 8 plots the proportion of penult stress as a function of insert type. As seen in the bar chart, approximately 11% of items featuring singleton inserts were stressed on the penult, followed by 23% and 41% of stimuli with attested and unattested embedded word onsets respectively.
Penultimate stess by insert status. Error bars are 95% CI.

Figure 9 plots the correlations of the nuisance covariates with stress placement, collapsed across individual participants. Figure 9a reveals that the probability of stressing a test probe on the penult decreases as the mean orthographic edit distance between that probe and its ten nearest penult-stressed lexical neighbours grows. (b) shows that the proportion of penultimate stress increases to the extent that it is cued by embedded words. Both correlations are significant and in the expected direction, though the effect sizes are relatively small.
Effects of nuisance predictors on penultimate stress: (a) edit distance (r=−0.37, p<0.001); (b) embedded words (r=0.17, p<0.05).

The model-fitting procedure revealed no significant contributions from the interactions between insert type and the two nuisance covariates (all p>0.05); we therefore dropped all interactions in favour of a main-effects only model. This model significantly outperformed an intercept-only version (χ 2(4) = 44.93, p<0.001), and featured a BIC score of 3025. The output is shown in Table V.
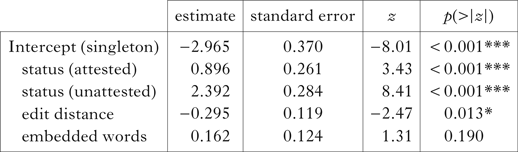
Categorical model output (stress assignment).
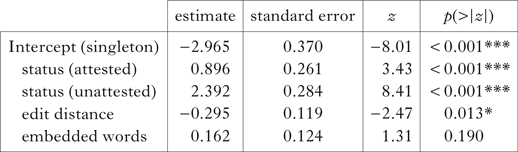
Edit distance played a significant, independent role in stress assignment, but this was not the case for embedded words. Above and beyond these nuisance variables, probes with both types of CC inserts were significantly more likely to receive penultimate stress than probes containing singletons. Furthermore, a planned comparison revealed a significant difference between the two cluster types, with unattested onsets cuing more penult stress than attested onsets (β=1.50, SE=0.25, z=5.99, p<0.0001). Taken together, these findings support the pattern seen in Fig. 8, and suggest that phonotactic generalisations affect stress assignment to a greater extent than just analogy to orthographic neighbours or the parsing out of embedded words. We now turn to probing the granularity of these generalisations, and ask whether they are similar in nature to those found to predict hyphenation.
4.4.2 Fine-grained phonotactics
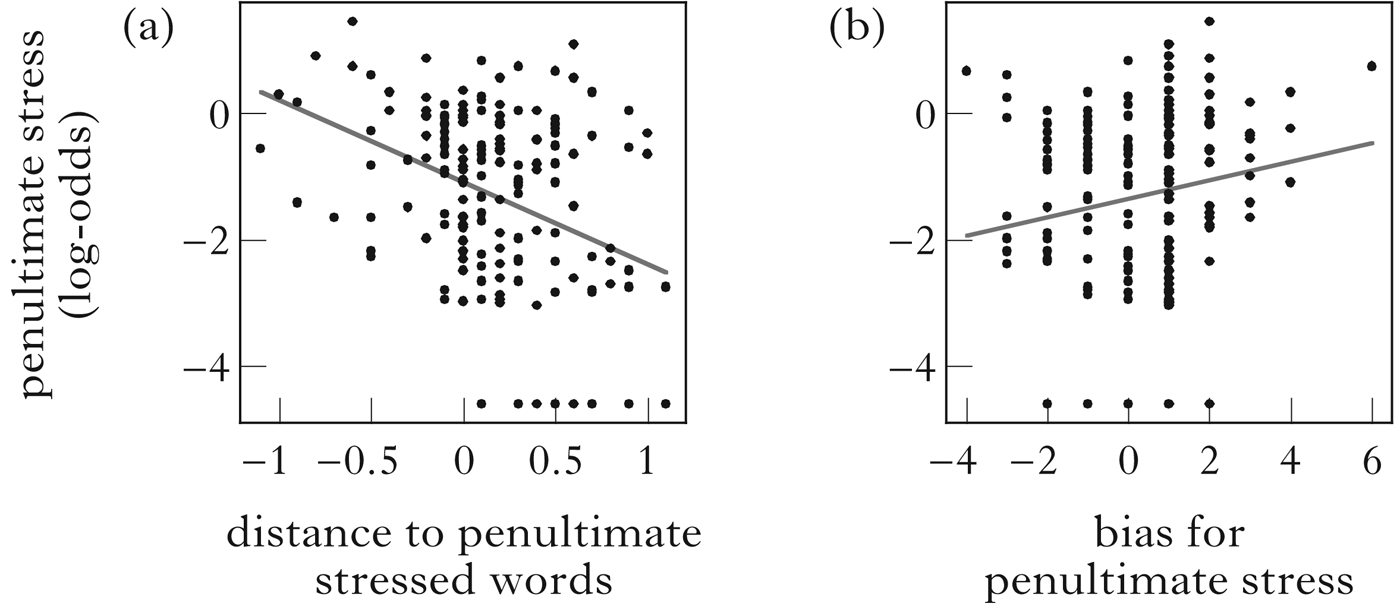
Figure 10 shows the correlation of the responses with each of the three continuous predictors. (a) plots stress against word-onset frequency. As in Experiment 1, the dataset was restricted to singletons and attested CC onsets, in order to prevent unattested (zero-frequency) onsets from biasing the results. Relative to the other panels, the correlation appears to be quite strong. In (b), the responses are aggregated by the first consonant of each insert, and plotted against the word-final frequency of this consonant. The correlation is positive but marginal. Finally, (c) shows the relationship between sonority slope and aggregated responses to items with unattested clusters. This correlation is relatively modest, but statistically significant.
Effects of gradient predictors on stress assignment: (a) word-onset frequency (singletons, attested clusters; r=−0.62, p<0.001); (b) word-offset frequency (C1, all inserts; r=0.48, p=0.052); (c) sonority (unattested clusters; r=−0.36, p<0.05).

In order to examine the performance of each gradient predictor in the presence of the others, a multiple mixed-effects model was fitted on the full data. In addition to onset frequency, offset frequency and residualised sonority slope, the model contained the edit distance and embedded word-based nuisance covariates. This model was a significant improvement over an intercept-only model according to the likelihood ratio test (χ 2(5)=54.56, p<0.001), and featured a BIC score of 2921. The output is shown in Table VI.
Gradient model output (stress assignment).
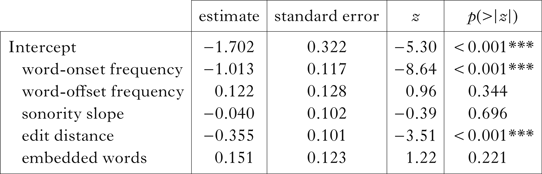
As seen in the table, edit distance significantly contributed to stress assignment, in the expected direction. Of the phonotactic predictors of interest, only word-onset frequency emerged as statistically significant.
4.5 Discussion
Experiment 2 yielded similar findings to Experiment 1: across the two studies, gradient phonotactic predictors successfully accounted for behaviour. However, whereas the hyphenation task was sensitive to all of these predictors, stress assignment responded only to word-onset statistics. Figure 11 further explores the relationship between the two experiments. (a) shows simply the correlation between the results, aggregated by insert. In spite of the fact that stress assignment was influenced by edit distance in addition to phonotactics, the relationship is remarkably strong. In (b) and (c), the observed stress results are plotted against the predictions of the categorical and gradient phonotactic models trained on the hyphenation data respectively. The gradient model appears to provide a better fit (particularly among the singletons and attested onsets), accounting for an additional 14% of the variance relative to the categorical model.Footnote 7 In addition, of the two models fitted to the stress data, the gradient model featured a markedly lower BIC score than the categorical model (ΔBIC = 104), indicating a better fit. This converging evidence suggests that the gradient behaviour observed in the preceding experiments was not an isolated phenomenon or a task effect.
Experiment 1 vs. Experiment 2 results and model fits: (a) observations (r 2=0.64); (b) categorical model; Experiment 1 (r 2=0.44); (c) gradient model; Experiment 1 (r 2=0.58). Values are in log-odds.

5 General discussion
From a mentalist perspective, the phonological grammar can be viewed as a complex system of knowledge, comprised of many interdependent components. In this article, we set out to examine the relationship between two of these components: phonotactic knowledge on one hand, and metrical knowledge on the other. With respect to the former, recent work has led to a paradigm shift wherein grammaticality is seen as a gradient and scalar property of segment sequences. However, this view has not yet been extended to the interaction of phonotactics with the phonological parse – at least implicitly, metrical theory maintains a more traditional, deterministic approach to syllabification (Halle & Vergnaud Reference Halle and Vergnaud1987, Kager Reference Kager1989, Hayes Reference Hayes1995). Is the metrical parse indeed phonotactically categorical, or is it guided by gradient, probabilistic generalisations? To the extent that knowledge of word edges is relevant to word-internal boundaries, what is the level of detail at which this knowledge is accessed by the parser? We defined this problem in terms of the simple hypothesis space in Table I that pitted phonotactic legality against gradient measures of well-formedness (lexical support and sonority), and explored it using two different methods.
The hyphenation task presented in Experiment 1 yielded results consistent with the output of a gradient phonotactic parser. Above and beyond phonotactic legality, infrequent word onsets were more likely to be split in medial position than frequent ones, while the syllabification of unattested word onsets was consistent with the SSP and syllable contact. Word-offset statistics also contributed to the results across the board. The hyphenation behaviour thus paralleled prior results from word-edge judgement and processing studies, suggesting the involvement of the same determinants of well-formedness. This argument was further supported by the success of a model trained on our pseudo-word results at capturing the hyphenation of real words reported by Eddington et al. (Reference Eddington, Treiman and Elzinga2013a, Reference Eddington, Treiman and Elzingab).
The online stress-assignment task reported in Experiment 2 revealed a similar pattern of results. Although word-offset statistics and sonority did not significantly affect behaviour, word-onset frequency contributed to stress assignment. Its effect persisted despite the inclusion of two nuisance variables in the analyses. Furthermore, the stress-placement results displayed a high correlation with the word-division study, and a gradient model trained on the latter was more successful at capturing the results of the former than a categorical model. In sum, both experiments provided converging evidence for the hypothesis that the metrical parse is stochastic, and guided by detailed phonotactic knowledge. Before exploring the implications of these findings, we address several alternative interpretations. As the main objections to Experiment 1 were covered in §2.4, we focus here on the stress-placement results.
5.1 Alternative explanations of the stress results
A potential complication of employing trisyllabic pseudo-words is that in the lexicon of English, most entries longer than two syllables are morphologically complex. For instance, the lexicon contains many trisyllabic compounds, and these are often assumed to follow specific stress rules that do not reference syllable weight. In other words, the Latin Stress Rule does not extend to these lexical items. It is thus possible that if the participants in Experiment 2 interpreted the test probes as compounds (perhaps treating illegal clusters as cues to morpheme boundaries; see Hay Reference Hay2003) they would completely ignore syllable weight when assigning stress. If this had occurred, the results could not be interpreted as providing a window on the metrical parse.
Upon closer inspection, this possibility is inconsistent with the results of Experiment 2. Recall the stress patterns in the lexicon illustrated in Fig. 6. Specifically, the panels in (e) show that compound words are indeed exempt from Latin Stress, and are much less likely to be stressed on the penult than words belonging to other subsets of the lexicon. If the participants had extended compound-based stress generalisations to the stimuli, we would have observed much lower rates of penult stress and no evidence of weight-sensitive behaviour (or perhaps even a weight reversal). This was clearly not the case: Fig. 8 illustrates the productive extension of Latin Stress, with the overall rate of penult stress approaching that of non-compounds in the lexicon. The participants are therefore highly unlikely to have interpreted the stimuli as compounds.
The second alternative to our interpretation is that, rather than following a gradient parse, the stress patterns reflected gradient weight distinctions. Recent evidence from pseudo-word production studies suggests that the stress grammars acquired by learners are considerably more complex than predicted by standard metrical theory. For example, the probability of stressing a syllable seems to rise monotonically as rhyme complexity increases along a V̆ < V̆C < VV < VVC continuum, and onset structure may have a similar cumulative effect (Kelly Reference Kelly2004, Ryan Reference Ryan2011). Extrapolating beyond phonological size, it is possible to imagine that English weight is variably sensitive to phonological features, an idea well established in other languages (e.g. sonorants are often argued to be heavier than obstruents; Zec Reference Zec1995).
Adapted to the current study, the gradient weight account entails that syllabification follows relatively coarse phonotactics, but some coda consonants attract stress more readily than others. While this idea might have some success in capturing the sonority-based differences within the unattested onsets (perhaps English is one of the languages where sonorants carry more weight than obstruents), it cannot explain the results for the attested items, because the stress-assignment and syllabification decisions for these items do not follow from the phonological features of the cluster-initial consonant, but are instead well predicted by word-initial type frequency of the entire cluster.
The third alternative to the gradient parser we consider is offered by Interval Theory (Steriade Reference Steriade2012; see also Hirsch Reference Hirsch2014). This theory assumes that the domain of weight computation is not the syllable rhyme, but rather the total vowel-to-vowel interval, which is defined as the span of material beginning with the onset of a vowel and ending at the onset of the following vowel. Under this proposal, weight is scalar, and may have a phonetic basis; for instance, Hirsch (Reference Hirsch2014) computes weight in proportion to the acoustic duration of each interval.
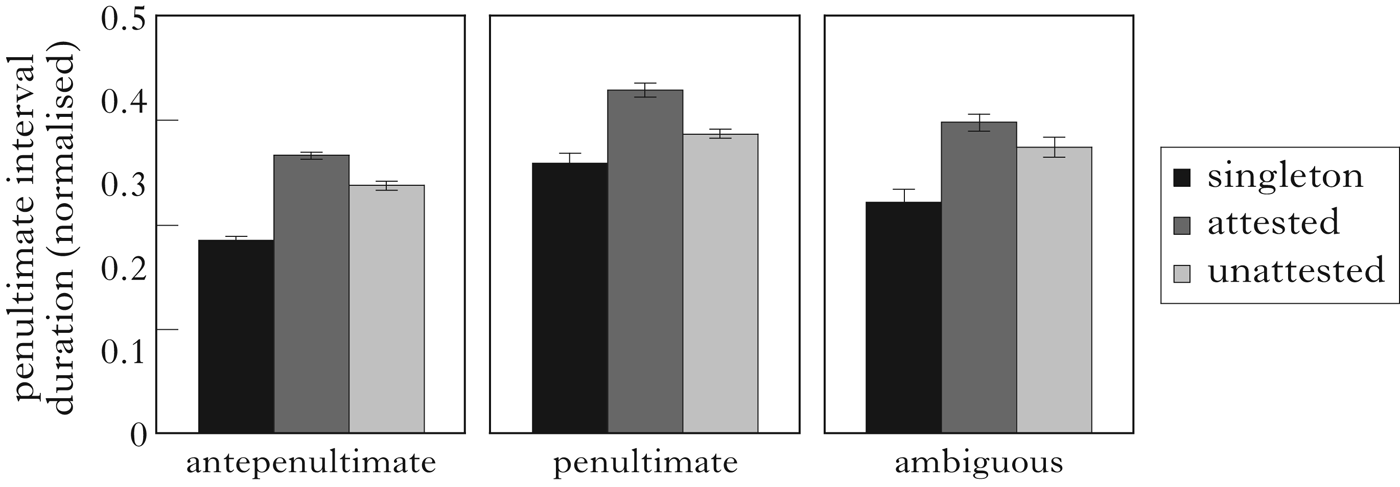
By definition, interval parses of our stimuli invariantly yield VCC penults (VC in the case of singleton items). With respect to Experiment 2, a phonetically grounded version of Interval Theory predicts that acoustically longer penult intervals carry more weight than short intervals, and should therefore attract stress more readily. A simple way to test this prediction is with reference to the coarse-grained stress results (Fig. 8): if weight indeed followed the interval parse, then penult interval durations should match the stress results seen in the figure, falling along the scale singleton < attested < unattested. To test this prediction, we measured the duration of each penult interval, normalising it by word duration. Figure 12 plots the results for the entire set of valid responses (in order to remove the influence of stress on duration, the ratios are plotted separately by stress location).
Penult interval durations by insert status and stress location. Error bars are 95% CI.

As expected, singleton items featured the shortest penultimate intervals. However, words with attested and unattested inserts patterned in the opposite direction than predicted by Interval Theory. Linear mixed models with random intercepts for participants and frames revealed that the VCC penultimate intervals were significantly longer in attested than unattested items for all three stress locations (all p<0.05). In other words, interval durations were not predictive of weight.
None of the three alternatives thus appears to offer a satisfactory explanation for the stress-placement results. Moreover, all three share a common failure: none can account for the strong correlation observed between the results of Experiments 1 and 2 (Fig. 11a). The finding that stress assignment paralleled hyphenation behaviour on an insert-by-insert basis suggests that both tasks were subserved by the same parsing mechanism. In other words, the gradient parsing model provides the best explanation consistent with the two studies.
5.2 Linking stress to gradient phonotactics
If the relationship between the results of the two experiments argues that both tasks were subserved by the same metrical parse, it also reveals an inconsistency: participants appeared to be far more willing to close a penult in the hyphenation study than they were to stress it in Experiment 2 (see Fig. 11a). Why is there a difference between the two tasks?
One possibility is that, relative to the underlying parse, the participants in Experiment 1 were more liberal in closing syllables. Recall that 41% of the singleton inserts were assigned to the preceding syllable, a finding at odds with well-established theoretical arguments for onset filling (e.g. Itô Reference Itô1989). It is plausible that this coda bias was the emergence of the possible word constraint (Norris et al. Reference Norris, McQueen, Cutler and Butterfield1997) during the sequential processing of orthography. As the participants worked their way across the character string, they likely felt some pressure to produce heavy syllables in order to satisfy the word-minimality requirements of English. If the vowel was interpreted as lax, this meant appending a coda. If the order of processing was indeed from left to right, the minimality bias emerged prior to, and thus was able to compete for, the parse with the downstream phonotactic dependencies. One piece of evidence consistent with this argument is the structure of antepenults in the hyphenation study. Recall that every pseudo-word contained a singleton between V1 and V2. Subsequent analysis revealed that 54% of these consonants were parsed as antepenultimate codas, suggesting that word-minimality was indeed competing with onset filling.
Independently of the minimality bias, the second reason for the difference between the two experiments may originate in the lexical statistics of English stress. There are at least two possibilities. First, the lexicon could have affected stress-pattern productivity through shorter words, which are overwhelmingly stressed on the initial syllable, regardless of weight (Cutler & Carter Reference Cutler and Carter1987). Allowing any of these words to infiltrate the search space would result in competition between the trochaic and Latin stress patterns, resulting in lowered productivity of the latter. Second, recall that, while weight-sensitivity is robust across the lexicon, it is by no means categorical (Fig. 6). For instance, the lower panel in Fig. 6f shows that, across all trisyllabic and longer word forms, only about 59% of heavy penults are stressed. Even if we restrict the definition of heavy syllables to those with long vowels (and thus circumvent the potential issues arising from our choice to syllabify the lexicon according to the Maximal Onset Principle), the rate of heavy penults receiving stress barely reaches 61%. It is therefore possible that the lexical statistics of weight add another stochastic dimension to the results: having parsed the pseudo-words according to the fine-grained model, our participants may have probability-matched the weight generalisation in the lexicon. Indeed, it is not unlikely that multiple weight generalisations are involved in stress assignment, perhaps organised into a weight gradient based on vowel quality (Hitchcock & Greenberg Reference Hitchcock and Greenberg2001, Carpenter Reference Carpenter2010). A comprehensive treatment of the interaction between the gradient parser and gradient weight phenomena is beyond the scope of the present paper, and remains an area for future work.
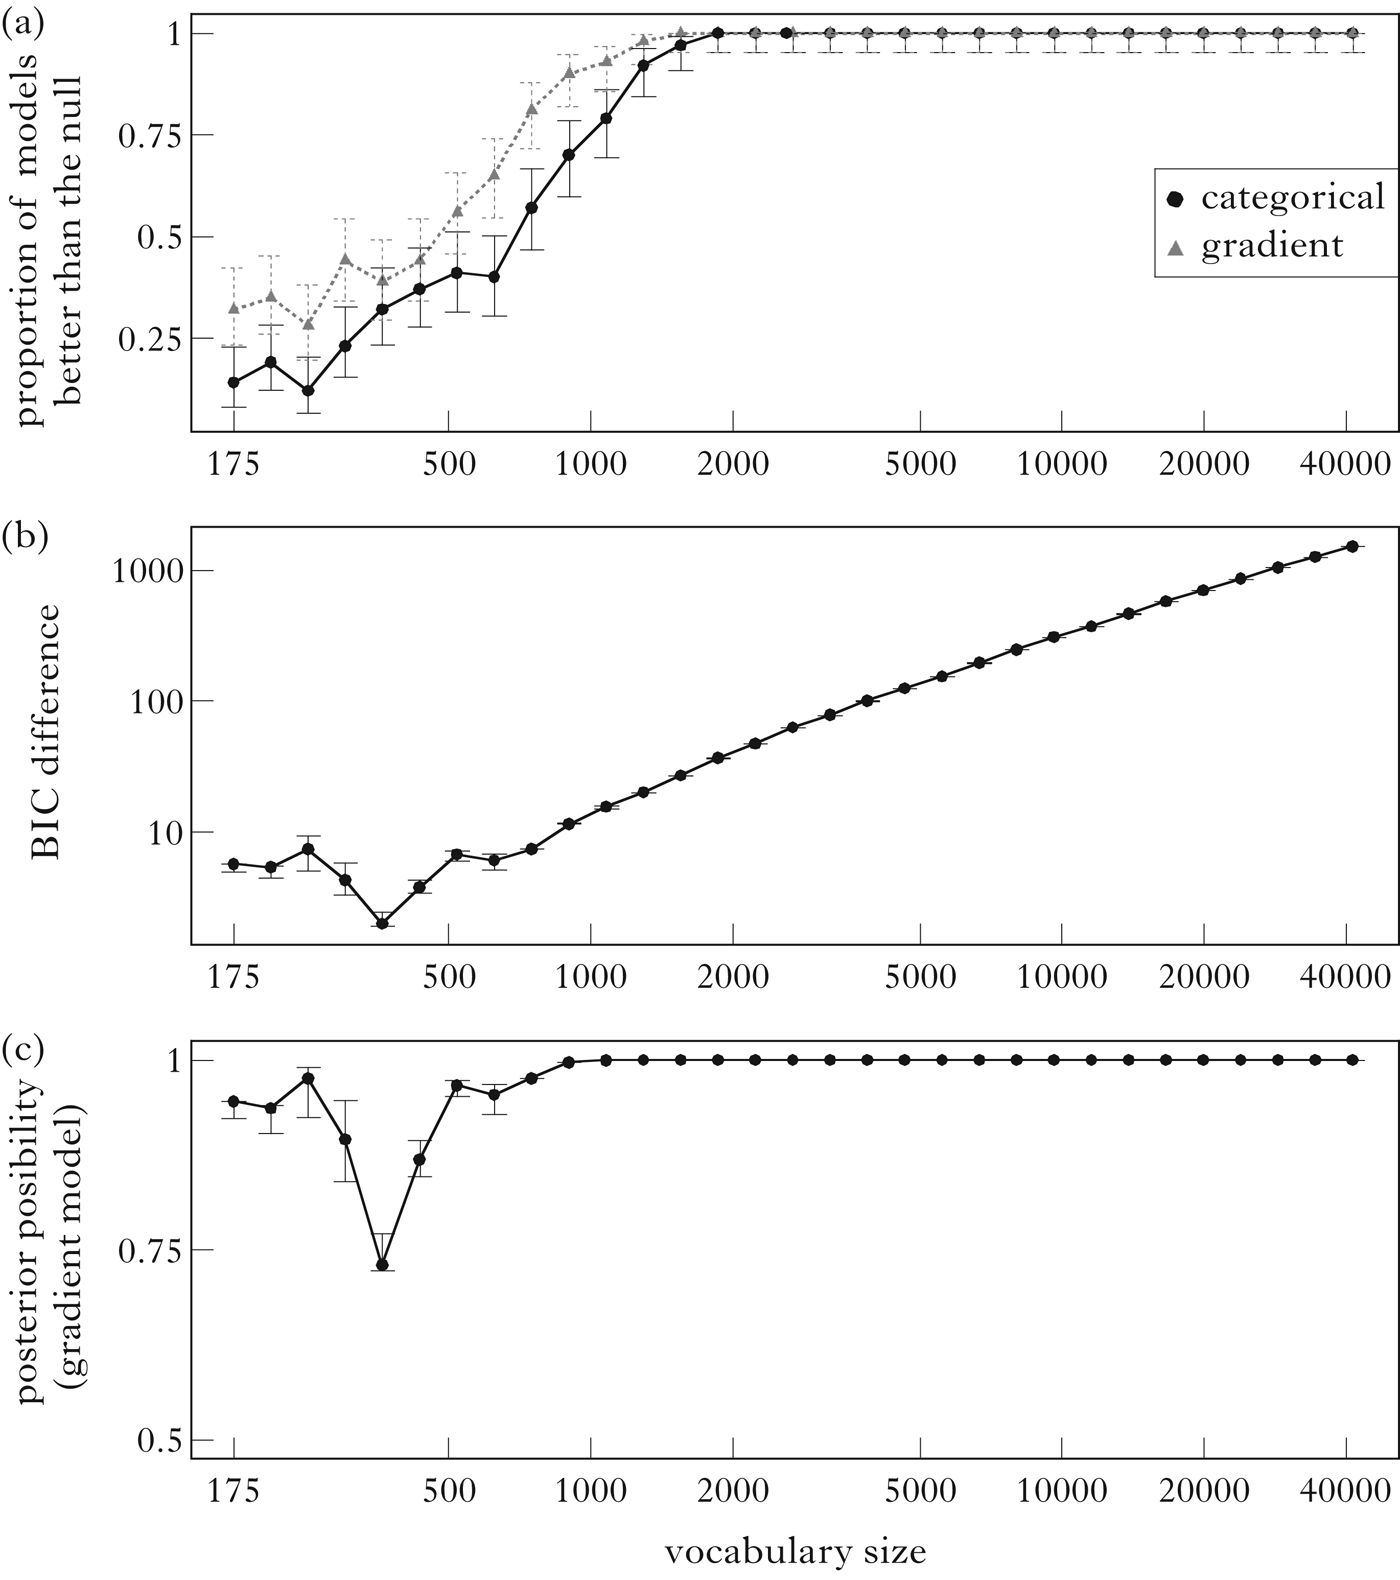
5.3 Simulating the emergence of a gradient metrical parser
In this section, we explore the relative learnability of the categorical and gradient regression models. At first blush, the categorical parser seems to have a learning advantage due to its simplicity: rather than having to estimate the frequency of each individual insert, the learner simply needs to recognise them as previously encountered word edges. Simplicity appears to be an important component to successful phonological learning (Moreton & Pater Reference Moreton and Pater2012), and simple grammars are robust in the face of variability between individual lexicons, which may facilitate mutual intelligibility among speakers and reliable transmission of the grammar across generations (Pierrehumbert Reference Pierrehumbert2001). On the other hand, learners are of course quite good at keeping track of frequency information. Indeed, they can't seem to help but learn and match probabilities in the input, especially when that information ends up being useful for discovering linguistic units like phonetic categories or words (e.g. Saffran et al. Reference Saffran, Aslin and Newport1996, Maye et al. Reference Maye, Werker and Gerken2002, Kapatsinski Reference Kapatsinski2010, Harmon & Kapatsinski Reference Harmon and Kapatsinski2017). The question then becomes not just one about simplicity, but about its trade-off with predictive success. In other words, this is a question of statistical model selection.
How well does each regression model capture the stress facts of English? Recall from Fig. 6 that the categorical parser does a relatively good job of predicting Latin Stress: the heavy penults it produces consistently attract stress across different sections of the lexicon. But what of the gradient parser? After all, our participants appear to have preferred it when stressing nonce forms – would it also outperform the categorical model when applied to their own lexicons? If so, would the improvement be worth the trade-off in complexity? A related issue concerns the time course of learning. Specifically, at what point during acquisition does the learner have a large enough vocabulary to support the relationship between the parser and stress? As the lexicon grows, do the data consistently prefer the same parsing model for predicting stress, or is there a point at which learners should abandon one in favour of the other?
We approach these questions with a series of vocabulary simulations inspired by Pierrehumbert (Reference Pierrehumbert2001). One hundred simulated agents learned vocabularies of different sizes by random sampling from the adult English lexicon consisting of 48951 word forms (defined in §2.2). To approximate the order of acquisition, the sampling was weighted by SUBTLEXus counts, so that frequent words had a greater chance to be learned. Vocabulary size began at 175 words, and grew to over 46000 in 20% increments. After sampling their lexicon, each agent examined the word edges, and extracted both categorical and gradient phonotactic information. The former meant simply assigning an ‘attested’ label to each word onset. The latter consisted of recording word-onset and word-offset frequencies, as well as the sonority slopes of each onset. Having learned their (idiosyncratic) word-edge phonotactics, the agents attempted to predict stress in trisyllabic and longer words using two parsing models. The categorical regression model syllabified each word based on the Maximal Onset Principle, with each agent relying on its own set of attested onsets to determine legality. The gradient regression model contained three predictors: the two word-edge frequency measures and the onset sonority slopes. Both models were formalised as mixed-effects logistic regressions with random intercepts for individual words.
At each of the 25 increments in vocabulary size, model performance was assessed in two ways. First, each model was tested against its null (intercept-only) counterpart, using a likelihood ratio test. This test indicated whether the predictors significantly improved fit over a baseline. Second, BIC values for the two models of a given lexicon were directly compared. Figure 13 plots the measures of model performance, averaging across the 100 agents at each vocabulary size. (a) shows the proportion of agents for whom each parser significantly outperformed the baseline. Here, it is clear that both parsers succeed relatively quickly: by the time they learn about 1500 words, nearly all agents can successfully predict stress using either parser. That said, there is some degree of early separation in favour of the gradient model, suggesting that it is acquired earlier by at least some learners. But the goal of outperforming the intercept is relatively unambitious; (b) plots the mean BIC difference between the models, with the gradient model's scores subtracted from those of the categorical model. The positive values reveal that the categorical model consistently has much higher scores, indicating worse performance. Wagenmakers (Reference Wagenmakers2007) shows that BIC differences between two models can be converted into posterior model probabilities for a rational Bayesian learner under the assumption that both models are available to the learner and that the learner has no prior preference in favour of either model. (c) plots the posterior probabilities of the gradient model derived from the BIC differences. The plot indicates that a rational unbiased learner of English stress is virtually certain to prefer the gradient parser over its categorical competitor at every stage of lexical development.
Simulation results: (a) proportion of models outperforming the null hypothesis; (b) BIC advantage for the gradient relative to the categorical parser, (c) posterior probability of the gradient model. Error bars are 95% CI obtained by bootstrapping. See text for additional details.

Taken together, the simulation results thus suggest that, when learning phonotactic parsing models, the cost of complexity is outweighed by gains in performance. From early on, stochastic phonotactic knowledge offers a predictive advantage over coarse binning. There is no point during development at which this advantage does not hold, allowing learners to retain the same parsing model as they gather new data. To the extent that the phonological learner favours the most predictive grammar, a learner of the English stress system is expected to acquire a gradient metrical parser.
6 Conclusion
In this article, we have provided empirical evidence that the gradient phonotactic knowledge possessed by English speakers has metrical consequences. To the extent that hyphenation and stress assignment are subserved by the parse, it is a parse guided by the same fine-grained generalisations which determine the well-formedness of subsyllabic constituents. We have shown that such a parser is easily formalised as a logistic regression model (which is known to be equivalent to Harmonic Grammar in being a maximal entropy model; Goldwater & Johnson Reference Goldwater, Johnson, Spenader, Eriksson and Dahl2003), and that its probability of having generated the stress patterns in the lexicon exceeds that of the categorical parser for any vocabulary size. It should therefore be selected over its categorical competitor by any unbiased learner to whom both are available. Our findings have also led to some new questions. Foremost among them concerns the general need to capture the relationships among gradient components of phonological knowledge, such as the metrical parse and weight. Proper understanding of such interactions seems to be a worthwhile objective for future work.