The ability to recognize emotion expressions from facial affect displays is essential in virtually all aspects of human interaction, and is critical for the development of adaptive functioning (Izard & Harris, Reference Izard, Harris, Cicchetti and Cohen1995; Izard, Youngstrom, Fine, Mostow, & Trentacosta, Reference Izard, Youngstrom, Fine, Mostow, Trentacosta, Cicchetti and Cohen2006; Sroufe, Reference Sroufe1996). A large body of literature points to the emergence of a broad level of competence in the recognition of facial expressions of emotion very early in development. Typically developing infants have been shown to be able to discriminate static, prototypical facial expressions of happiness, anger, fear, sadness, and surprise (Caron, Caron, & MacLean, Reference Caron, Caron and MacLean1988; Nelson, Reference Nelson1987; Serrano, Iglesias, & Loeches, Reference Serrano, Iglesias and Loeches1992; Walker-Andrews, Reference Walker-Andrews1997). Although this ability undergoes increasing refinement from early childhood through adolescence, the accurate identification of emotions from facial cues is in large part mastered by the preschool years (Izard & Harris, Reference Izard, Harris, Cicchetti and Cohen1995; Thomas, De Bellis, Graham, & LaBar, Reference Thomas, De Bellis, Graham and LaBar2007; Tonks, Williams, Frampton, Yates, & Salter, Reference Tonks, Williams, Frampton, Yates and Salter2007; Walden & Field, Reference Walden and Field1982).
However, the incorrect processing and recognition of facial affect can exert a deleterious impact on numerous areas of socioemotional functioning, including parent–child attachment relationships, emotion regulation, and peer relations (Cassidy, Reference Cassidy1994; Cicchetti, Ackerman, & Izard, Reference Cicchetti, Ackerman and Izard1995; Cicchetti & Izard, Reference Cicchetti and Izard1995; Cole, Martin, & Dennis, Reference Cole, Martin and Dennis2004; Dodge, Pettit, & Bates, Reference Dodge, Pettit and Bates1990; Sroufe, Reference Sroufe1996). Moreover, abnormalities in the recognition of facial expression have been found in a variety of childhood and adult mental disorders and high-risk conditions (Cicchetti & Schneider-Rosen, Reference Cicchetti, Schneider-Rosen, Izard, Kagan and Zajonc1984; Guyer et al., Reference Guyer, McClure, Adler, Brotman, Rich and Kimes2007; Hesse & Cicchetti, Reference Hesse and Cicchetti1982; Izard & Harris, Reference Izard, Harris, Cicchetti and Cohen1995; Izard et al., Reference Izard, Youngstrom, Fine, Mostow, Trentacosta, Cicchetti and Cohen2006; Kats-Gold, Besser, & Priel, Reference Kats-Gold, Besser and Priel2007).
Children raised in low-risk environments are usually exposed to a rich and complex array of predominantly positive emotional experiences from birth (Pollak, Cicchetti, Hornung, & Reed, Reference Pollak, Cicchetti, Hornung and Reed2000). Consequently, the emotional environment experienced by the vast majority of children is likely to be so invariant that experiential influences on perception and recognition of facial affect may be masked (Pollak et al., Reference Pollak, Cicchetti, Hornung and Reed2000). However, the atypical emotional environment often found in homes where maltreatment occurs may exert a deleterious impact on children's perception and processing of facial affect.
Several investigations have examined the overall affective climate of maltreating homes, and, perhaps not surprisingly, found evidence of parents expressing fewer positive and more negative emotions in maltreating families (Herrenkohl, Herrenkohl, Egolf, & Wu, Reference Herrenkohl, Herrenkohl, Egolf, Wu, Starr and Wolfe1991; Kavanaugh, Youngblade, Reid, & Fagot, Reference Kavanaugh, Youngblade, Reid and Fagot1988; Lyons-Ruth, Connell, Zoll, & Stahl, Reference Lyons-Ruth, Connell, Zoll and Stahl1987), as well as very high rates of verbally and physically aggressive interactions between family members (e.g., Bousha & Twentyman, Reference Bousha and Twentyman1984; Crittenden, Reference Crittenden1981). In homes where there is child neglect, although investigators have found the omission of many forms of basic care and increased family stressors (e.g., Connell-Carrick & Scannapieco, Reference Connell-Carrick and Scannapieco2006; Crittenden, Reference Crittenden1981), evidence has further indicated that there are also high levels of family conflict, negative affect, and domestic violence relative to comparison families (Connell-Carrick & Scannapieco, Reference Connell-Carrick and Scannapieco2006; Gaudin, Polansky, Kilpatrick, & Shilton, Reference Gaudin, Polansky, Kilpatrick and Shilton1996).
There is also evidence demonstrating that children who have experienced maltreatment exhibit less accurate recognition of emotions than nonmaltreated children, above and beyond the effects of cognitive ability (Camras, Grow, & Ribordy, Reference Camras, Grow and Ribordy1983; Camras et al., Reference Camras, Ribordy, Hill, Martino, Spaccarelli and Stefani1988). Further investigation has revealed that, despite overall deficits in emotion recognition performance, maltreated children have a selective bias, or hypersensitivity, toward the detection of anger (Camras et al., Reference Camras, Ribordy, Hill, Martino, Sachs and Spaccarelli1990).
Several studies over the past decade by Pollak and colleagues have examined the emotion recognition abilities of maltreated school-aged children. These investigators have broadly hypothesized that physically abused children would exhibit an increased sensitivity to anger-related cues, perhaps also resulting in decreased attention to other emotional cues (Pollak et al., Reference Pollak, Cicchetti, Hornung and Reed2000). For physically abused children, displays of anger, often experienced as the most salient feature of their environment, may be the greatest predictor of threat. Pollak et al. (Reference Pollak, Cicchetti, Hornung and Reed2000) found that physically abused children perceived angry faces as highly salient and more distinctive relative to other emotion categories, and that they also exhibited a response bias for angry facial expressions. Further, in a study of 9-year-olds given the task of identifying emotion from stimuli depicting the formation of facial expressions, Pollak, Messner, Kistler, and Cohn (Reference Pollak, Messner, Kistler and Cohn2009) found that physically abused children accurately recognized anger earlier in the sequence compared to other emotions relative to a group of nonabused comparison children. Moreover, physically abused children also have been shown to display more broad perceptual category boundaries for perceiving anger than nonmaltreated children (Pollak & Kistler, Reference Pollak and Kistler2002) and to require less visual information to detect the presence of angry facial expressions (Pollak & Sinha, Reference Pollak and Sinha2002).
Thus, it appears that physically abused children do not have global emotion recognition deficits (e.g., Pollak et al., Reference Pollak, Cicchetti, Hornung and Reed2000); rather, differential processing of emotion appears to be specific to anger. In contrast, neglected children were found to have more difficulty in accurately discriminating emotional expressions than were physically abused or nonmaltreated children (Pollak et al., Reference Pollak, Cicchetti, Hornung and Reed2000). Furthermore, when instructed to rate the similarity of facial expressions, neglected children made fewer distinctions between emotions (Pollak et al., Reference Pollak, Cicchetti, Hornung and Reed2000).
Other investigators have provided additional evidence supporting the association of maltreatment with aberrations in recognition of facial expressions of emotion. For example, Masten et al. (Reference Masten, Guyer, Hodgdon, McClure, Charney and Ernst2008) showed that, relative to nonmaltreated children, maltreated children both with and without a diagnosis of posttraumatic stress disorder showed a faster reaction time when identifying fearful facial expressions. In a study of high-risk adolescents receiving mental health treatment at a residential facility, Leist and Dadds (Reference Leist and Dadds2009) found an association between maltreatment history and more accurate recognition of sad and fearful facial expressions, but not angry expressions. However, the maltreated adolescents were more likely to perceive neutral faces as angry or sad.
In addition to the behavioral evidence pointing to alterations in facial affect processing in maltreated children, a number of studies have examined the effects of maltreatment on neural processes indexing facial emotion recognition utilizing event-related potentials (ERPs; e.g., Cicchetti & Curtis, Reference Cicchetti and Curtis2005; Pollak, Cicchetti, Klorman, & Brumaghim, Reference Pollak, Cicchetti, Klorman and Brumaghim1997; Pollak, Klorman, Thatcher, & Cicchetti, Reference Pollak, Klorman, Thatcher and Cicchetti2001; Pollak & Tolley-Schell, Reference Pollak and Tolley-Schell2003; Shackman, Shackman, & Pollak, Reference Shackman, Shackman and Pollak2007). ERPs are scalp-derived changes in brain electrical activity, obtained by averaging time-locked segments of the electroencephalogram (EEG) that are synchronized to the presentation of a stimulus (Donchin, Kariss, Bashore, Coles, & Gratton, Reference Donchin, Karis, Bashore, Coles, Gratton, Coles, Donchin and Porges1986). They provide a direct index of neural functioning thought to reflect processing of discrete stimuli (Hillyard & Picton, Reference Hillyard, Picton and Mountcastle1987; Kutas & Dale, Reference Kutas, Dale and Rugg1997). In addition, because of their relative noninvasiveness, ERPs are ideal for examining the relation between brain and behavior in younger children (DeBoer, Scott, & Nelson, Reference DeBoer, Scott, Nelson and Handy2005).
Initial ERP studies by Pollak and colleagues hypothesized that the P3b component, which is believed to reflect neural processes involved in the updating of mental representations in working memory, and varies as a function of task relevance and stimulus probability, may index cognitive processes associated with the encoding of salient emotional stimuli. Pollak et al. (Reference Pollak, Cicchetti, Klorman and Brumaghim1997) compared the ERPs of school-aged maltreated children to those of a group of nonmaltreated children of equivalent socioeconomic background and cognitive maturity. Across several experimental conditions, children were instructed to respond to either an angry or a happy face, both of which appeared less frequently than a neutral face. The P3b amplitude of the nonmaltreated children was equivalent in both the happy and angry target conditions. In contrast, the P3b of the maltreated children was larger in the angry than in the happy condition, perhaps reflecting more efficient cognitive organization in the anger condition for the maltreated children.
In a subsequent study, Pollak et al. (Reference Pollak, Klorman, Thatcher and Cicchetti2001) compared the ERP responses of maltreated and nonmaltreated children to happy, angry, and fearful facial expressions. As in their prior study, nonmaltreated children exhibited equivalent P3b amplitude in response to all of the target facial expressions of affect. However, the amplitude of the P3b of the maltreated children exceeded that of the nonmaltreated children in response to the angry target, suggesting that maltreated children are uniquely sensitive to detecting anger over other facial expressions of emotion (Pollak et al., Reference Pollak, Klorman, Thatcher and Cicchetti2001).
In a further examination of maltreated children's hypersensitivity to anger, Pollak and Tolley-Schell (Reference Pollak and Tolley-Schell2003) posited that the early experience of physical abuse may alter the development of perceptual systems by decreasing the minimum amount of threat-related stimulation needed to engage focused attention upon such stimuli. In this study, physically abused children demonstrated a selective increase in ERP response on angry trials as indexed by the P3b, and behavioral evidence demonstrated that abused children orient more rapidly to cues primed by anger, providing additional support for alterations in attentional processing of anger. Shackman et al. (Reference Shackman, Shackman and Pollak2007) utilized ERPs to examine attentional processing of both facial and vocal emotion cues in children ages 7–12 years. Findings from this study revealed that, relative to a nonmaltreated comparison group, maltreated children showed enhanced selective attention to angry facial expressions posed by their mother, as indexed by the P3b ERP component.
Although the work of Pollak and colleagues has focused on school-aged maltreated children, Cicchetti and Curtis (Reference Cicchetti and Curtis2005) examined ERPs evoked while viewing angry, happy, and neutral facial expressions in a group of 30-month-old children who had experienced maltreatment in the first 12 months of life. This work was implemented to examine the effects of maltreatment on neural processes associated with recognition of facial affect during a developmental period marked by crucial experience-dependent brain developmental processes, in particular, the refinement of synaptic connectivity (Stiles, Reference Stiles2008). Such neurodevelopmental processes, shaped in part by environmental input, could potentially be undermined by aberrant emotional experiences that may accompany maltreatment. In addition, the study sought to examine whether maltreatment would have altered neural processes associated with emotion recognition nearly 5 years earlier in development than previously observed.
Maltreated children in this study had greater amplitude of an early positive ERP component (P260) at frontal leads in response to viewing angry facial expressions, relative to happy and neutral, compared to a group of nonmaltreated children. This component likely indexes a late perceptual process that includes the identification of affective facial expressions (a very similar waveform in response to facial affect was reported by Parker, Nelson, and the Bucharest Early Intervention Core Group (Reference Parker and Nelson2005) in a sample of children in a similar age range). As such, this finding suggests an increased sensitivity to angry facial affect in maltreated toddlers even at 30 months of age.
In addition, the maltreated children exhibited greater amplitude of the Nc waveform over central electrode sites while viewing angry faces compared to happy and neutral faces, reflecting increased familiarity of angry facial expressions in the maltreated group (Cicchetti & Curtis, Reference Cicchetti and Curtis2005). Finally, in this study, a late positive slow wave (PSW), thought to index updating in working memory of partially encoded stimuli, also was examined. The nonmaltreated 30-month-olds had a greater PSW area score in the right hemisphere in response to viewing angry facial expressions compared to the maltreated group, suggesting that, for these children, angry facial expressions were less familiar and thus required more neural resources for encoding into memory.
The goal of the current study was to investigate whether young children who have experienced maltreatment in the first year of life would manifest aberrations in neural processing of facial expressions of emotion. We have continued to focus our work on early childhood because it is a period when critical experience-dependent neurodevelopmental processes associated with synaptic connectivity and organization, as well as myelination, are occurring (Cicchetti & Curtis, Reference Cicchetti, Curtis, Cicchetti and Cohen2006; Huttenlocher, Reference Huttenlocher2002; Stiles, Reference Stiles2008). Moreover, increasingly complex abilities to recognize facial expressions of emotion continue to emerge throughout early childhood (e.g., Durand, Gallay, Seigneuric, Robichon, & Baudouin, Reference Durand, Gallay, Seigneuric, Robichon and Baudouin2007; Mondlach, Geldart, Maurer, & Le Grand, Reference Mondloch, Geldart, Maurer and Le Grand2003) and brain areas relevant for facial emotion processing, such as the prefrontal cortex and amygdala, continue to develop through late childhood and adolescence (e.g., Casey, Giedd, & Thomas, Reference Casey, Giedd and Thomas2000; Giedd et al., Reference Giedd, Vaituzis, Hamburger, Lange, Rajapakse and Kaysen1996). Thus, it is important to chart the developmental course of neural processes indexing facial affect recognition in young children and how the experience of maltreatment early in life may alter such development.
Further, although our previous study documented ERP responses to facial affect of 30-month-old maltreated and nonmaltreated children (Cicchetti & Curtis, Reference Cicchetti and Curtis2005), we felt it was of critical importance to continue to investigate these neurofunctional phenomena in a group of slightly older children closer to school age. Although the current sample of children is 1 year older than the sample previously reported, it is important to note that this apparently brief period of chronological development is accompanied by significant achievements in all domains of development. In particular, emotional and cognitive development that facilitates the continued refinement of perception and processing of facial affect takes place at a rapid pace during early childhood; thus, it would be of importance to document the effects of maltreatment in the current sample of children. In addition, experience-dependent neurodevelopmental processes, most notably synaptic pruning, continue during this period. Peak synaptic density is not attained in the prefrontal cortex until 3–4 years of age, with subsequent synaptic pruning following a more protracted course through childhood and adolescence (e.g., Huttenlocher, Reference Huttenlocher2002). Thus, continued exposure to the atypical affective environment that characterizes maltreating families could contribute additional risk for later maladaptation, and cumulative exposure could amplify the observed effects of experience on the neurofunctional correlates of affective face processing.
Two sets of hypotheses guided this work, which were formulated based on two groups of ERP components that emerged from our data. The first group of components, the P1, N170, and P400 maximal over occipital electrode sites, have been shown to be sensitive to and modulated by faces (e.g., Batty & Taylor, Reference Batty and Taylor2006; Moulson, Fox, Zeanah, & Nelson, Reference Moulson, Fox, Zeanah and Nelson2009). The second group of waveforms, the N150, P240, Nc, and PSW sites, are maximal primarily over frontal and central scalp regions and have been shown to be influenced by facial affect (e.g., Cicchetti & Curtis, Reference Cicchetti and Curtis2005; Parker et al., Reference Parker and Nelson2005).
Occipital Components
P1
Previous research with typically developing children has shown this component to be sensitive to emotion in faces (Batty & Taylor, Reference Batty and Taylor2006). Consistent with our general expectation that maltreated children would be hyperresponsive to angry facial affect, we hypothesized that maltreated children would manifest greater P1 amplitude in response to angry facial expressions relative to happy, and also greater amplitude in response to angry compared to nonmaltreated children.
N170
This face-sensitive component, believed to index the structural encoding of faces, has also been shown to be responsive to facial expressions of emotion in young children (e.g., Dawson, Webb, Carver, Panagiotides, & McPartland, Reference Dawson, Webb, Carver, Panagiotides and McPartland2004). Consistent with the expectation that maltreated children would be hyperresponsive to angry facial affect, it was hypothesized that maltreated children would show greater N170 amplitude in response to angry facial expressions relative to happy, and also greater amplitude in response to angry compared to nonmaltreated children.
P400
This component has been shown to be sensitive to facial expressions of emotion in infants (e.g., Hoehl & Striano, Reference Hoehl and Striano2008; Leppanen, Moulson, Vogel-Farley, & Nelson, Reference Leppanen, Moulson, Vogel-Farley and Nelson2007), and amplitude differences in this waveform in response to facial emotion have been shown to discriminate between children who have experienced early deprivation and those developing in normative contexts (e.g., Moulson et al., Reference Moulson, Westerlund, Fox, Zeanah and Nelson2009). We hypothesized that maltreated children would show greater amplitude of the P400 in response to angry facial expressions relative to happy, and also greater amplitude in response to angry compared to nonmaltreated children.
Frontal–Central Components
N150
In our previous ERP study of 30-month-old maltreated children (Cicchetti & Curtis, Reference Cicchetti and Curtis2005), there were no maltreatment status related differences on this waveform. Thus, in the current sample, we did not expect to find amplitude differences between maltreated and nonmaltreated children.
Early positive component (P240)
We hypothesized that maltreated and nonmaltreated children would differ in perceptual processes most likely reflected by this component (identified as P250 by Parker et al., Reference Parker and Nelson2005; and as P260 by Cicchetti & Curtis, Reference Cicchetti and Curtis2005). We hypothesized that maltreated children would show larger P240 amplitude in response to angry facial expressions relative to happy and greater amplitude in response to viewing angry facial affect compared to children in the nonmaltreated group.
Nc
Because the Nc waveform is thought to reflect a child's allocation of attention to salient or relevant stimuli, we expected to find that the amplitude of Nc would be greater in maltreated children in response to viewing angry stimuli. In contrast, we expected that the Nc amplitude would be larger in nonmaltreated children in response to happy facial expressions.
PSW
A preponderance of evidence has suggested that the PSW indexes the updating of working memory (e.g., Nelson & Monk, Reference Nelson, Monk, Nelson and Luciana2001). In our previous study of 30-month-olds, nonmaltreated children exhibited greater PSW amplitude in response to angry facial expressions compared to the maltreated children, suggesting that increased neural resources were required by the nonmaltreated children to process the less familiar, angry facial expression. Accordingly, we hypothesized that maltreated children would exhibit greater PSW amplitude in response to viewing happy versus angry facial expressions. Similarly, because anger may be a less familiar stimulus to nonmaltreated children, we expected to find an increased PSW while viewing angry stimuli in the nonmaltreated group.
Topographic differences
In addition to the primary focus on emotion and maltreatment status in the hypotheses outlined above, the current study also examined topographic differences in ERPs between maltreated and nonmaltreated children. The investigation of these topographic differences was considered important, yet exploratory in nature, thus no specific hypotheses were formulated regarding group differences in topography of the ERP components. Hence, for the frontal–central components, analyses will explore aggregate regional differences (i.e., frontal, central, temporal–parietal) between the maltreated and nonmaltreated groups. All regional findings will be reported, and interactions between region and maltreatment status will be discussed.
Method
Participants
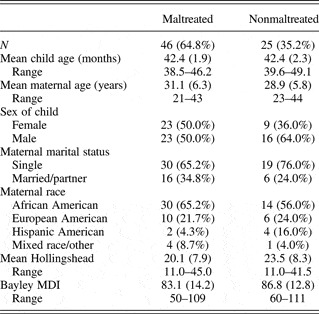
A total of 81 children, all residing with their biological mothers and from low socioeconomic status backgrounds, participated in the ERP data collection. Data from 71 of these children were retained for analyses, and the final sample consisted of 46 children from maltreating families and 25 children from nonmaltreating families. Maltreated children were oversampled as part of the original study design in order to achieve a balance of maltreatment subtypes. However, many children who experience physical abuse during the first year of life, particularly if the abuse is severe, are no longer living with the biological parent(s), resulting in a lower number of these children eligible for recruitment into the study. Demographic characteristics of the sample are summarized in Table 1 and are described in detail below. Prior to data collection, mothers of all children participating in the study received complete information concerning the study procedures, and provided informed consent for their child's participation, as well as consent for examination of all Department of Human Services (DHS) records involving the family. All participant recruitment and research procedures were approved by the Research Subject Review Board at the University of Rochester.
Demographic characteristics

Note: MDI, Mental Development Index.
Participant recruitment
Maltreating families were recruited from Monroe County DHS and were representative of families receiving services from the DHS. Specifically, all families identified as having a young child who had resided in a maltreating home during their first 12 months were contacted by a DHS liaison, who requested permission from families to be contacted by project staff to be recruited for possible participation in this study. Determination of maltreatment status was based upon Child Protective Service (CPS) and Preventive Services records, coded by trained raters utilizing the Barnett, Manly, and Cicchetti (Reference Barnett, Manly, Cicchetti, Cicchetti and Toth1993) classification system for child maltreatment. In order to maximize demographic comparability to the maltreatment sample, low socioeconomic status comparison families were recruited from families receiving public assistance (Temporary Assistance to Needy Families). Nonmaltreatment status was confirmed by an absence of CPS or Preventive Services records for the family, and by maternal interview (Cicchetti, Toth, & Manly, Reference Cicchetti, Toth and Manly2003).
During participant recruitment, 17 families who were approached concerning participation in the study declined to take part, but there were no statistically significant demographic differences between this group and those who agreed to participate. Further, 5 of the 81 children (6.2%) who began the data collection procedure yielded no data or incomplete data due to fussiness of the child and/or technical problems, and were not included in the analyses. Another five children who completed the ERP experiment were not included because of too few artifact free trials, yielding a final sample of 71 children.
Demographic characteristics
Maltreating and nonmaltreating families were similar on most key demographic variables, summarized in Table 1. Males comprised 50.0% of the maltreated group and 64.0% of the nonmaltreated group, with no statistically significant difference in gender composition between the two groups. In addition, there were no statistically significant differences between the two groups on maternal age, maternal marital status, or maternal ethnicity. Finally, 87.8% of the maltreating families and 72.0% of the families in the nonmaltreating group fell in the two lowest social strata defined by Hollingshead's (Reference Hollingshead1975) Four Factor Index of Social Status.
Maltreatment characteristics: Inclusion and exclusion criteria
The presence or absence of three subtypes of maltreatment was determined utilizing the Maltreatment Classification System (Barnett et al., Reference Barnett, Manly, Cicchetti, Cicchetti and Toth1993). Subtype grouping was based upon family level maltreatment reports, in addition to CPS reports on individual children, providing a more comprehensive account of the type of maltreating environment experienced. Within the final sample of 46 maltreated, 71.7% of the maltreating families demonstrated physical neglect, 19.6% physical abuse, and 8.7% sexual abuse. Further, comorbidity of subtypes of maltreatment has been well documented (Barnett et al., Reference Barnett, Manly, Cicchetti, Cicchetti and Toth1993; Cicchetti & Barnett, Reference Cicchetti, Barnett, Grove and Cicchetti1991); in the present study, 26.1% of the maltreated sample had experienced two or more subtypes of maltreatment. The most commonly co-occurring subtypes were physical neglect and physical abuse, co-occurring in 17.4% of the sample, with only one case in which documented physical abuse occurred in the absence of another maltreatment subtype.
For all maltreating families, biological mothers were a perpetrator of maltreatment (although additional perpetrators may have been present) and remained the primary caregiver. Children who had been placed in foster care were excluded from the study because of the potential for greater variation in the type and quality of care received in foster homes compared to that provided by the biological mother. In addition, because of the potential for developmental and medical complications, HIV-positive infants were not included in the sample, as well as children born more than 4 weeks prematurely and/or with severe perinatal medical complications.
EEG recording
The EEG was recorded from midline (Fz, Pz, Oz) and lateral scalp sites (fP1, fP2, F3, F4, F7, F8, C3, C4, T3, T4, T5, T6, P3, P4, O1, O2) using a Lycra Electro-Cap (Electro-Cap International, Eaton, OH) fitted with Ag-AgCl disc electrodes sewn into the cap, arrayed according to the International 10/20 system (Jasper, Reference Jasper1958). EEG also was recorded from left and right mastoids, as well as the reference site at the vertex (Cz). An anterior midline site (AFz) served as the ground electrode. Following cap placement, a small amount of Electro-Gel was placed into the scalp and mastoid electrodes. After pressing the gel into the electrode and creating good contact with the scalp, a small quantity of electrolytic conducting gel was inserted into each electrode. The electrooculogram (EOG) was recorded from electrodes placed vertically above and below the right eye bisecting the midline, and horizontally at the right and left canthus. The EOG electrodes were held in place with small adhesive collars, and conducting gel was placed inside the electrode prior to placement on the face. The capping procedure was considered complete when impedances were at or below 5 kΩ for scalp electrodes and 10 kΩ for eye electrodes.
EEG signal was recorded using a SYNAMPS 32 channel EEG amplifier and the Acquire module of Scan 4.2 software (Neuroscan, Inc., Charlotte, NC). Amplifier gain was set to 500 for scalp electrode channels and 150 for EOG channels. Data were sampled at 500 Hz and digitized using a 12-bit A/D converter after being bandpass filtered from 0.10 to 30 Hz. Prior to each experimental session, a 400-mV 20-Hz calibration signal was input into each of the channels.
During data collection, all participants viewed a total of 133 images, which were divided into three stimulus conditions (angry, happy, or neutral facial expressions). Angry and happy expressions were each presented across 20 trials (each comprising 15% of the total number of trials), whereas the neutral stimuli comprised 93 trials (70% of total trials). Trials consisted of a 200-ms prestimulus baseline, followed by a 1000-ms stimulus presentation. Stimulus offset was followed by a blank screen for 800 ms. The intertrial interval was 1000 ms for all trials.
Continuous EEG was monitored online during the experimental session, and periods with excessive artifact were marked. Videotapes of subjects during EEG data collection were coded offline by two research assistants, who were unaware of participants' maltreatment status, to determine whether the child was looking at the computer monitor during presentation of stimuli. Trial sequencing information (i.e., trial number) was overlaid onto the video prior to coding. All trials during which the child failed to attend for fewer than 20 of the 30 video frames spanning each of the 1000-ms stimulus presentation intervals were not included in the calculation of individual averages. The two raters achieved 89% agreement for looking across a randomly selected subset of 20% of the subjects for whom data were used, with no statistically significant differences on interrater agreement across stimulus type. Further, there were no statistically significant differences in the proportion of trials attended to across the three trial types (angry, happy, neutral).
Stimuli
Participants viewed black and white images of the face of an adult Caucasian female, randomly selected from three of the models included in the standardized set of face stimuli developed by Ekman (Reference Ekman1976; slide numbers 21, 23, 24, 51, 53, 54, 66, 68, and 69). The ordering of the three trial types, angry, happy, and neutral, was different across each of the three image sets, and was randomly determined, with no stimulus type presented more than two times consecutively. Images appeared one at a time on a computer monitor 120 cm from the subject, yielding a subtended visual angle of 8.5 × 13 degrees. Stimulus presentation was controlled using the STIM module of Scan 4.2 software (Neuroscan, Inc., Charlotte, NC, 1998).
ERP data reduction
Scalp leads were referenced to an inactive mastoid electrode and later rereferenced to linked ears offline. Trials were excluded if the EEG signal exceeded ±250 µV in any 50-ms window. A software algorithm based on procedures described by Gratton, Coles, and Donchin (Reference Gratton, Coles and Donchin1983) was applied to correct for the influence of eye movement or blinks on the EEG, where data were adjusted for their regression on EOG for vertical and horizontal movements separately.
Data reduction and ERP waveform coding were conducted without knowledge of maltreatment status or of experimental hypotheses. Individual participant averages were then computed for each stimulus type. Careful inspection of the data, in particular averages consisting of 4 to 10 trials, indicated that the signal to noise (S/N) ratio was adequate only for those averages containing 7 or more trials. Thus, an individual participant's data were used if there were a minimum of 7 artifact-free trials for each stimulus type during which they attended to the stimulus. Subsequently, a grand average for each condition and group was computed. Across all participants with complete data, there were an average of 15.6 (SD = 3.5, range = 7–20) trials included in the averages for the angry condition, 15.2 (SD = 3.2, range = 7–20) trials in the averages for the happy condition, and 67.7 (SD = 15.1, range = 24–91) for the neutral condition. There were no statistically significant differences between the maltreated and nonmaltreated groups on the number of trials included in the averages for all conditions.
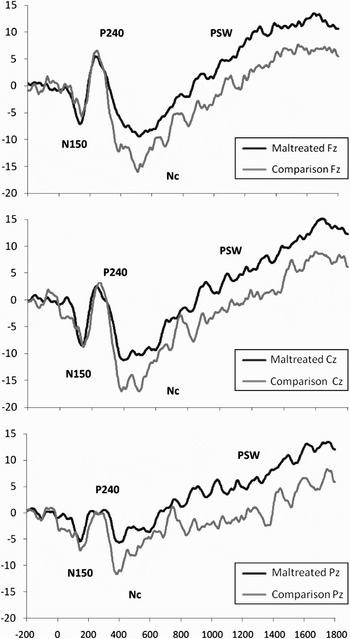
Based on inspection of the grand averages, seven ERP components were identified. Four of these were maximal across frontal, central, and parietal electrode sites; and three components were manifested across occipital electrodes. The first of the frontal–central components was an early negative waveform within a time window of 90 to 200 ms, with an average peak latency of approximately 150 ms, and thus is referred to as the N150. The second component, identified within a window of 200–350 ms, was a relatively early positive peak with maximum amplitude over central electrode sites with a latency of approximately 240 ms, thus labeled P240. A third, prominent negative component, between 350 and 600 ms, was maximal over central electrodes, with an average peak latency of approximately 400 ms, and was identified as the Nc. Finally, a long latency, positive component (PSW) was identified between 900 and 1800 ms.
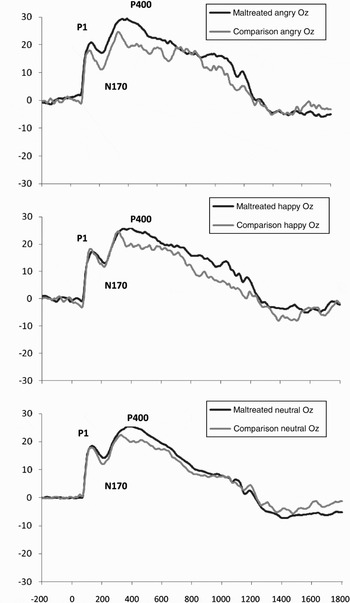
The first occipital component, P1, was a positive peak observed within the window from 90 to 200 ms and had an average peak latency of approximately 130 ms. The second occipital component, a negative-going deflection observed from 170 to 300 ms, had an average peak latency of approximately 210 ms. This waveform was identified as the N170. Finally, the P400 was identified in the window from 260 to 620 ms. This component exhibited a relatively long latency, with a somewhat poorly defined peak that occurred at approximately 380 ms.
Peak amplitude relative to a 200-ms baseline and latency to peaks were determined within these windows for the P1, N170, N150, P240, and Nc. Individual averages for each scalp electrode were manually edited for these components after peak amplitude and latency were determined by computer algorithm to ensure that none of the automatically detected peaks occurred on the edge of the waveforms. Area scores (rectified) relative to baseline were computed for the PSW and P400 within their respective time windows, using an algorithm that estimated area by computing the product of the sampling interval and the sum of all points in the interval (except the two endpoints, which are given one-half weight).
Assessment of infant cognitive development
The Mental Scale of the Bayley Scales of Infant Development, Second Edition (Bayley, Reference Bayley1993) was administered to all participants in the current study. This scale provides a global assessment of intellectual development, and measures cognitive functions such as memory and learning, as well as verbal communication skills. A Mental Development Index (MDI) score for each participant was derived from this measure. Although there was not a statistically significant difference between the maltreated and nonmaltreated groups on the MDI, there was a wide range of scores within both groups (see Table 1). Thus, MDI score was employed as a statistical covariate in all analyses in order to maximize comparability of cognitive development and mental age.
Procedure
All children were determined to be in good health and free of any medications at the time of the EEG laboratory visit. After the capping procedure was completed, all children were seated on their mother's lap in a darkened, sound-attenuated room. During data collection, a research assistant observed the child's behavior on a video monitor, and experimental stimuli were presented only when the child was attending to the monitor in the subject booth. If the child was not attending, then the mother was instructed, over an intercom system, to attempt to redirect the child's attention. During periods when the child was not attending to stimuli, a white box was presented. Occasionally, a “bulls eye” pattern was presented in conjunction with a rattle sound if the observer thought the child's attention could be redirected without the assistance of the mother. Each of these events was marked on the EEG recording as they occurred. If the child became distracted or fussy to the extent that their attention could not be redirected to the experimental stimuli, then the session was terminated. Parents were reimbursed for travel expenses and their time, and children were given a small toy after the experimental session.
Results
Repeated-measures analyses of variance (ANOVAs) were computed for the P1, N150, N170, P240, and Nc components; one used peak amplitude as the dependent variable, and the other employed peak latency as the dependent variable. For the PSW and P400 components, a repeated-measures ANOVA was also employed with rectified area scores as the dependent variable. All p values were corrected for sphericity using the Greenhouse–Geisser procedure when ɛ was <0.90 (Vasey & Thayer, Reference Vasey and Thayer1987). In cases where the ANOVA yielded statistically significant main effects, pairwise comparisons were employed utilizing t tests with a Bonferroni correction for multiple comparisons. When the ANOVA resulted in statistically significant interactions, pairwise comparisons using t tests, with Bonferroni corrections, were employed to examine within group differences, and independent samples t tests were used to evaluate between-group differences. An alpha level of p = .05 was used as the threshold for statistical significance. In the case of ANOVA effects of marginal statistical significance (.05 < p < .10), post hoc analyses were carried out to explore a priori hypotheses. All statistical analyses were computed using the Statistical Package for the Social Sciences (SPSS) for Windows, Version 17 (SPSS, 2009).
For the P1 and P400 components, preliminary analyses showed that there were no statistically significant interactions between hemisphere and maltreatment status. Thus, data from the three occipital sites (left occipital [O1], mid occiptal [Oz], and right occipital [O2]) were combined to form a single occipital region. Emotion (angry, happy, neutral) was a within subjects factor, and group (maltreating, nonmaltreating) was the between subjects factor. For the N170 component, there were statistically significant effects for hemisphere; thus, it was retained as a within subjects factor in the analyses. Data from the individual O1 and O2 leads were utilized as the dependent variables in the analyses for the N170.
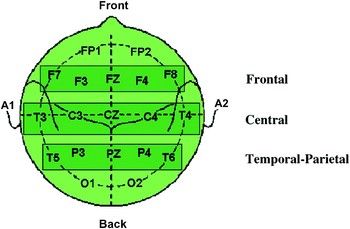
For the remaining components, electrode sites were combined to form three composite scalp regions, each consisting of five electrodes: frontal, which included F3, F4, F7, F8, and Fz; central, which included C3, C4, T3, T4, and Cz; and temporal–parietal consisting of P3, P4, T5, T6, and Pz (see Figure 1). Data from each of these sites were averaged to yield a mean regional peak amplitude and latency for each component. Preliminary analyses for these components included hemisphere as a within-subjects factor, with each composite region divided left and right (excluding the midline site). However, there were no statistically significant interactions between hemisphere and maltreatment status. Therefore, left and right hemisphere electrode sites were combined in the composite regions, as well as the midline sites. Thus, region (frontal, central, temporal–parietal) and emotion (angry, happy, neutral) were within-subjects factors, and group (maltreating, nonmaltreating) was the between-subjects factor. Chronological age and scores on the Bayley MDI were employed as covariates in all analyses.
A schematic of the electrode sites comprising frontal (F), central (C), and temporal–parietal (P) composite regions utilized in the reported analyses. Electrodes comprising each region are in the shaded boxes. [A color version of this figure can be viewed online at journals.cambridge.org/dpp]

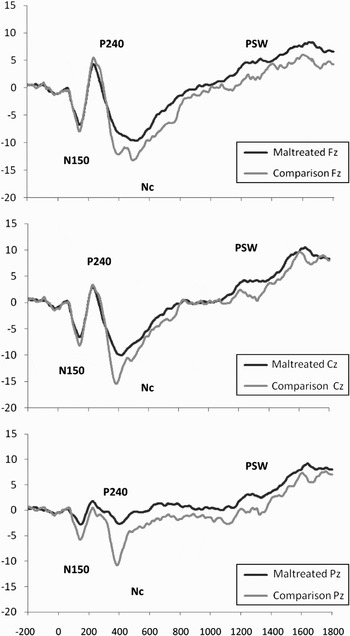
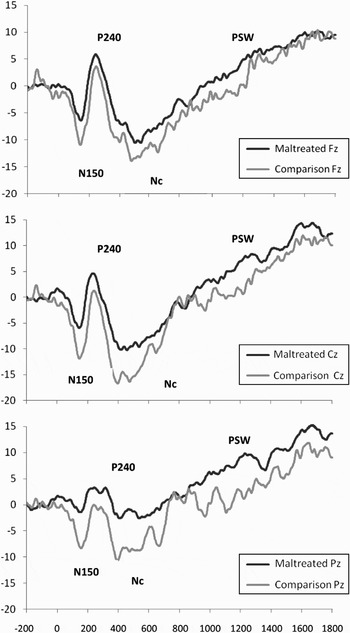
In addition, for all components, child gender was included as a between subjects factor in preliminary analyses. No statistically significant interactions between gender and maltreatment status emerged, hence, subsequent analyses did not include gender as a factor. Front-polar electrodes (fP1, fP2) were not included in the analyses due to unacceptable noise and consequent low S/N ratios. Grand means for children from maltreating and nonmaltreating families for each of the three emotion conditions for the midline electrode sites are shown in Figure 2, Figure 3, Figure 4, and Figure 5.
Grand averages of frontal–central event-related potential waveforms in response to the neutral face condition. Amplitude is represented on the vertical axis in microvolts, and time in milliseconds is on the horizontal axis. PSW, positive slow wave.

Grand averages of frontal–central event-related potential waveforms in response to the angry face condition. Amplitude is represented on the vertical axis in microvolts, and time in milliseconds is on the horizontal axis. PSW, positive slow wave.

Grand averages of frontal–central event-related potential waveforms in response to the happy face condition. Amplitude is represented on the vertical axis in microvolts, and time in milliseconds is on the horizontal axis. PSW, positive slow wave.

Grand averages of occipital (Oz) event-related potential waveforms in response to angry, happy, and neutral face conditions. Amplitude is represented on the vertical axis in microvolts, and time in milliseconds is on the horizontal axis.

It is important to note that a byproduct of the original design of the experimental procedure resulted in the mean number of trials comprising the individual averages for the neutral condition being significantly larger than the number of trials in the angry and happy conditions. A greater number of trials in an individual average will serve to increase the S/N ratio and hence will tend to reduce the peak amplitude of all components (Luck, Reference Luck2005). In cases where the results indicate smaller amplitude in neutral conditions relative to angry and/or happy, it is not possible to determine whether this was due to actual differences between conditions or to the increased S/N ratio in the neutral condition. However, the key comparisons in the study involve examining differences between the angry and happy emotion conditions, and although the findings from all three conditions will be presented, any findings concerning differences between the neutral and angry or happy conditions will not be interpreted in the discussion.
P1 amplitude
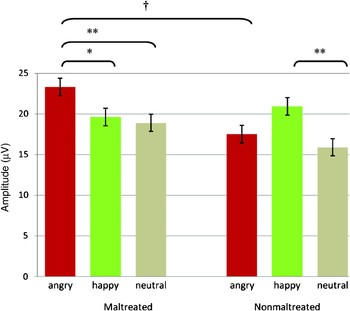
For this component, there was a statistically significant Group × Emotion interaction, F (2, 134) = 4.78, p = .013, ηp2 = 0.07, illustrated in Figure 6. Within the maltreated group, post hoc paired comparisons indicated that the amplitude of the P1 was greater in response to angry compared to happy faces, t (45) = 2.60, p = .013, and for angry compared to neutral, t (45) = 3.49, p = .001. Within the nonmaltreated group, P1 amplitude was greater in response to happy relative to neutral, t (24) = 2.86, p = .009. Follow-up t tests between groups showed that the maltreated children had greater P1 amplitude than nonmaltreated children for angry faces, t (70) = 1.77, p = .081.
The amplitude of the P1 component across three face emotion conditions for maltreated and nonmaltreated children, illustrating Group × Emotion interaction. Error bars are standard errors of the means. †p < .10. *p < .05. **p < .01. [A color version of this figure can be viewed online at journals.cambridge.org/dpp]

P1 latency
There were no statistically significant effects for peak latency.
N170 amplitude
There was an overall main effect for group, F (1, 67) = 4.48, p = .038, ηp2 = 0.07, with children in the maltreated group showing smaller amplitude relative to the nonmaltreated group across all emotions (maltreated M = 12.6 µV, SD = 12.4 µV; nonmaltreated M = 9.1 µV, SD = 7.3 µV; note that as the N170 is a negative-going peak and the mean amplitude is greater than zero, a lower positive value indicates greater amplitude).
There was also a significant Group × Emotion interaction for the N170, F (2, 134) = 4.32, p = .023, ηp2 = 0.07, illustrated in Figure 7. Post hoc comparisons indicated that, within the maltreated group, N170 amplitude was greater in response to happy relative to both angry, t (45) = 1.88, p = .066, and neutral, t (45) = 1.97, p = .055, facial expressions. Within the nonmaltreated group, there were no statistically significant differences in N170 amplitude between emotions. Between group comparisons indicated that for the nonmaltreated group, the N170 was larger in response to angry facial expressions, t (70) = 2.73, p = .008, and neutral facial expressions, t (70) = 2.20, p = .031, relative to the maltreated group.
The amplitude of the N170 component across three face emotion conditions for maltreated and nonmaltreated children, illustrating Group × Emotion interaction. Error bars are standard errors of the means. †p < .10. *p < .05. **p < .01. [A color version of this figure can be viewed online at journals.cambridge.org/dpp]

Although there was not a main effect for hemisphere, there was a statistically significant interaction of Emotion × Hemisphere for the N170, F (2, 134) = 3.51, p = .043, ηp2 = 0.05. Paired comparisons showed that for the angry and happy emotion conditions, across both maltreated and nonmaltreated groups combined, the N170 was greater in amplitude over the left hemisphere than right; angry, t (70) = −2.08, p = .041; happy, t (70) = −2.83, p = .006. There were no statistically significant differences between emotions within hemisphere.
N170 latency
There were no statistically significant effects for peak latency.
P400 amplitude
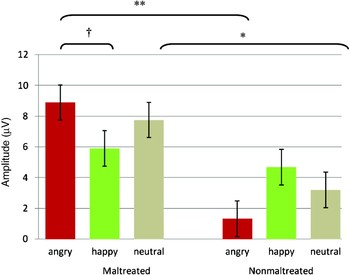
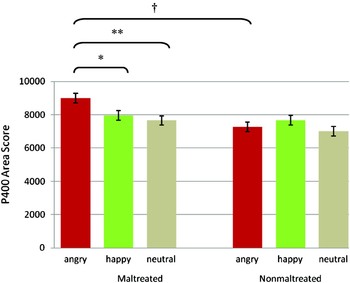
There was a statistically marginal Group × Emotion interaction for P400 amplitude, F (2, 134) = 2.74, p = .079, ηp2 = 0.04, as shown in Figure 8. Post hoc paired comparisons indicated that the P400 area score was greater for angry than happy faces, t (45) = 2.53, p = .015, and greater in response to angry compared to neutral, t (45) = 3.98, p < .001, within the maltreated group. However, there were no statistically significant differences between emotion conditions within the nonmaltreated group. Follow-up t tests between groups showed that the P400 was greater in response to anger in the maltreated group compared to the nonmaltreated children at the level of statistical trend, t (70) = 1.72, p = .091.
The amplitude (areas score) of the P400 component across three face emotion conditions for maltreated and nonmaltreated children, illustrating Group × Emotion interaction. Error bars are standard errors of the means. †p < .10. *p < .05. **p < .01. [A color version of this figure can be viewed online at journals.cambridge.org/dpp]

N150 amplitude
For this component, there was an overall main effect for group, F (1, 67) = 19.63, p < .001, ηp2 = 0.23, with maltreated children showing smaller amplitude relative to the nonmaltreated group across all emotions and regions (maltreated M = −6.4 µV, SD = 2.8 µV; nonmaltreated M = −9.6 µV, SD = 3.5 µV). In addition, a statistically significant main effect for emotion emerged, F (2, 134) = 4.29, p = .017, ηp2 = 0.06. Post hoc paired comparisons indicated that, across all regions and both groups, N150 amplitude was greater in response to viewing angry, t (70) = −4.04, p < .001, and happy faces, t (70) = −3.77, p < .001, relative to neutral.
This effect was qualified by a statistically marginal Group × Emotion interaction, F (2, 134) = 2.96, p = .06, ηp2 = 0.04. Within the maltreated group, amplitude of the N150 was greater in response to viewing happy faces relative to neutral, t (45) = −2.12, p = .039. Within the nonmaltreated group, N150 amplitude was greater in response to viewing both angry, t (24) = −4.69, p < .001, and happy faces, t (24) = −4.25, p < .001, relative to neutral. Post hoc comparisons between groups showed that the nonmaltreated group had greater N150 amplitude across all three emotions relative to the maltreated group; angry, t (70) = 3.44, p = .001; happy, t (70) = 2.57, p = .012; neutral, t (70) = 2.56, p = .013.
In addition, there was a statistically significant Group × Region interaction, F (2, 134) = 5.34, p = .012, ηp2 = 0.07. Post hoc paired comparisons indicated that, within the nonmaltreated group, the amplitude of the N150 was greater overall across central sites compared to temporal–parietal sites, t (24) = −2.44, p = .023. Within the maltreated group, N150 amplitude was greater overall across central sites, t (45) = −7.85, p < .001, and frontal sites, t (45) = −7.37, p < .001, compared to temporal–parietal sites. Comparisons between groups showed that the nonmaltreated children had greater N150 amplitude across all three regions relative to the maltreated group; frontal, t (70) = 2.03, p = .046; central, t (70) = 3.06, p = .003; temporal–parietal, t (70) = 5.29, p < .001.
N150 latency
There were no statistically significant effects for peak latency.
P240 amplitude
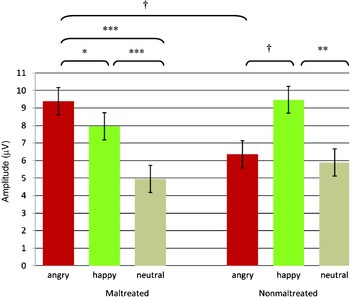
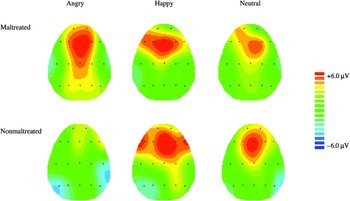
Although there were no main effects for the P240 component, there were two statistically significant interactions. The first was an interaction of Group × Emotion, F (2, 134) = 4.13, p = .024, ηp2 = 0.06, illustrated in Figure 9. Post hoc paired comparisons indicated that, for children in the maltreated group, P240 amplitude was greater while viewing angry faces compared to happy faces, t (45) = 1.97, p = .055. Further, P240 amplitude was greater in response to viewing angry, t (45) = 6.26, p < .001, and happy faces, t (45) = 4.94, p < .001, relative to neutral. For those in the nonmaltreated group, P240 amplitude was greater in response to viewing happy faces relative to neutral, t (24) = 3.67, p = .001, and greater in response to happy faces relative to angry, t (24) = 1.76, p = .094. Between group comparisons revealed that children in the maltreated group had greater P240 amplitude in response to viewing angry facial expressions compared to those in the nonmaltreated group, t (70) = 1.93, p = .058. These findings are represented topographically in Figure 10.
The amplitude of the P240 component across three emotion conditions for maltreated and nonmaltreated children, illustrating Group × Emotion interaction. Error bars are standard errors of the means. †p < .10. *p < .05. **p < .01. ***p < .0001. [A color version of this figure can be viewed online at journals.cambridge.org/dpp]

A topographic representation of Group × Emotion interaction for the amplitude of the P240 component. The amplitude of P240 is shown across three emotion conditions for maltreated and nonmaltreated children at mean peak latency across all three emotion conditions separately for each group (maltreated = 240 ms, nonmaltreated = 242 ms). Amplitude range is ±6.0 µV.

There was also a statistically significant interaction of Group × Region for P240 amplitude, F (2, 134) = 3.22, p = .043, ηp2 = 0.05. Children in the maltreated group had greater amplitude in frontal areas compared to central electrode sites, t (45) = 5.72, p < .001, as well as in central sites relative to temporal–parietal regions, t (45) = 2.47, p < .018. Children in the nonmaltreated group showed greater P240 amplitude in frontal areas compared to central electrode sites, t (24) = 3.25, p = .004, and in frontal areas relative to temporal–parietal regions, t (24) = 1.76, p = .094.
P240 latency
There were no statistically significant effects for peak latency.
Nc amplitude
For Nc amplitude, there was an overall main effect for group, F (1, 67) = 9.26, p = .003, ηp2 = 0.12, across all emotions and regions, with children in the maltreated group showing smaller Nc amplitude relative to the nonmaltreated group (maltreated M = −11.4 µV, SD = 4.8 µV; nonmaltreated M = −15.3 µV, SD = 5.5 µV). There was also a statistically significant main effect of emotion, F (2, 134) = 3.81, p = .025, ηp2 = 0.05. Post hoc paired comparisons indicated that, across all regions and both groups, amplitude of the Nc was greater in response to viewing angry, t (70) = 5.62, p < .001, and happy faces, t (70) = 6.20, p < .001, relative to neutral. There was also a marginally significant main effect for region, F (2, 134) = 2.50, p = .086, ηp2 = 0.04. Post hoc comparisons showed that Nc amplitude was greater at frontal, t (70) = 11.35, p < .001, and central sites, t (70) = 14.04, p < .001, relative to temporal–parietal sites across all emotions and both groups.
Nc latency
There was a statistically significant interaction of Group × Region, F (2, 134) = 3.19, p = .045, ηp2 = 0.05, for latency of the Nc. Post hoc paired comparisons indicated that peak latency in the maltreated group, across all emotion conditions, occurred later at frontal sites relative to central, t (45) = 4.91, p < .001, and posterior electrode sites, t (45) = 2.83, p = .007. In the nonmaltreated group, peak latency occurred later at frontal compared to central, t (24) = 4.99, p < .001, and posterior sites, t (24) = 5.84, p < .001, as well as later at central relative to more posterior sites, t (24) = 2.96, p = .007. Between group comparisons revealed that Nc peak latency occurred earlier in the nonmaltreated group in the temporal–parietal composite region relative to the maltreated group, t (70) = 2.27, p = .026.
PSW
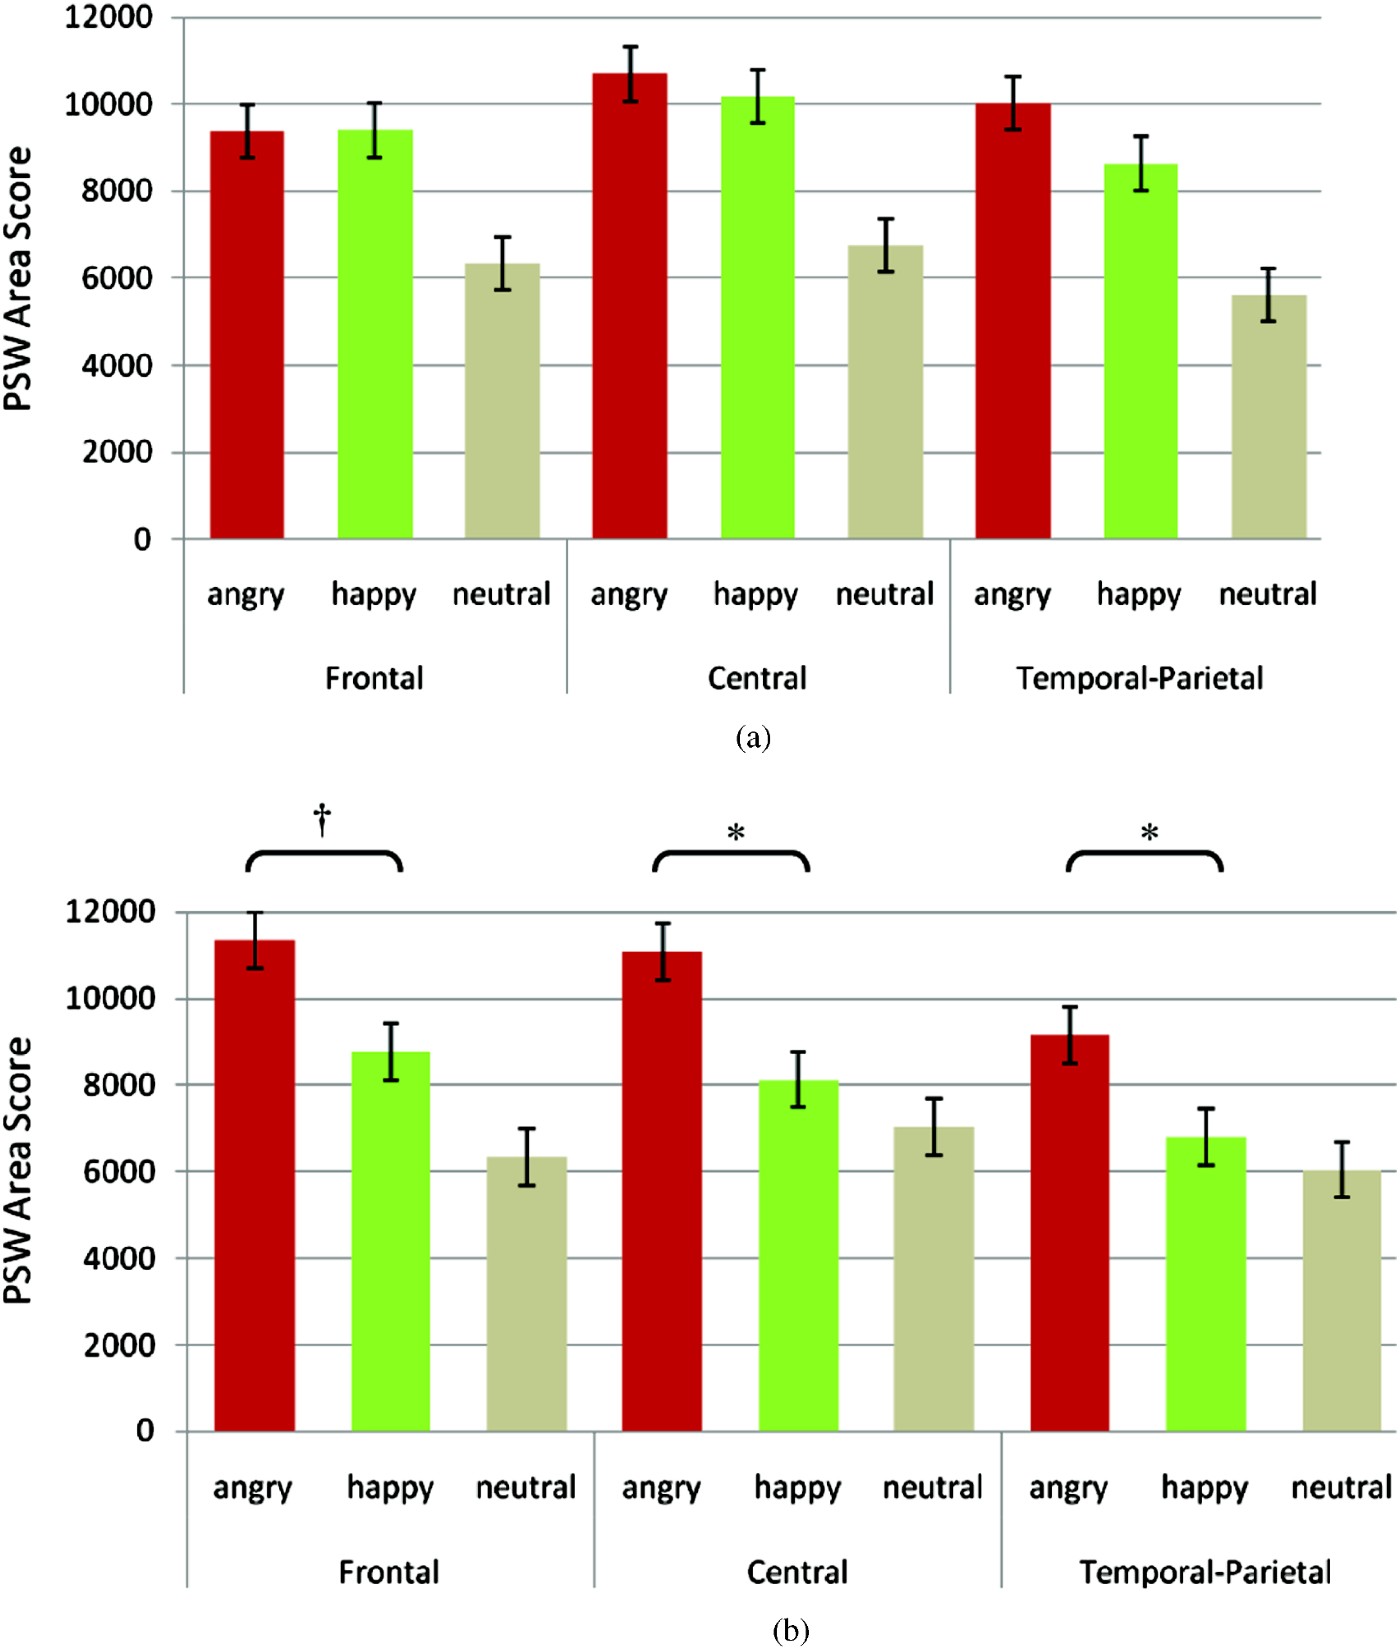
There were no main effects for the PSW; however, there was a statistically significant three-way interaction of Region × Emotion × Group, F (4, 268) = 2.62, p = .035, ηp2 = 0.04, as illustrated in Figure 11. Post hoc paired comparisons indicated that, for the maltreated group, PSW area score was greater at frontal electrode sites in response to viewing angry, t (45) = 3.94, p < .001, and happy faces, t (45) = 4.44, p < .001, relative to neutral. A similar pattern of greater PSW area score in response to angry and happy faces compared to neutral faces for the maltreated group was also observed over central sites, t (45) = 4.97, p < .001, and t (45) = 5.04, p < .001, for angry versus neutral and happy versus neutral, respectively, and temporal–parietal sites, t (45) = 6.50, p < .001, and t (45) = 4.26, p < .001, for angry versus neutral and happy versus neutral, respectively.
The Region × Emotion × Group interaction of the positive slow wave (PSW) area score in the (a) maltreated group and (b) nonmaltreated group. Error bars are standard errors of the means. †p < .10. *p < .05. [A color version of this figure can be viewed online at journals.cambridge.org/dpp].
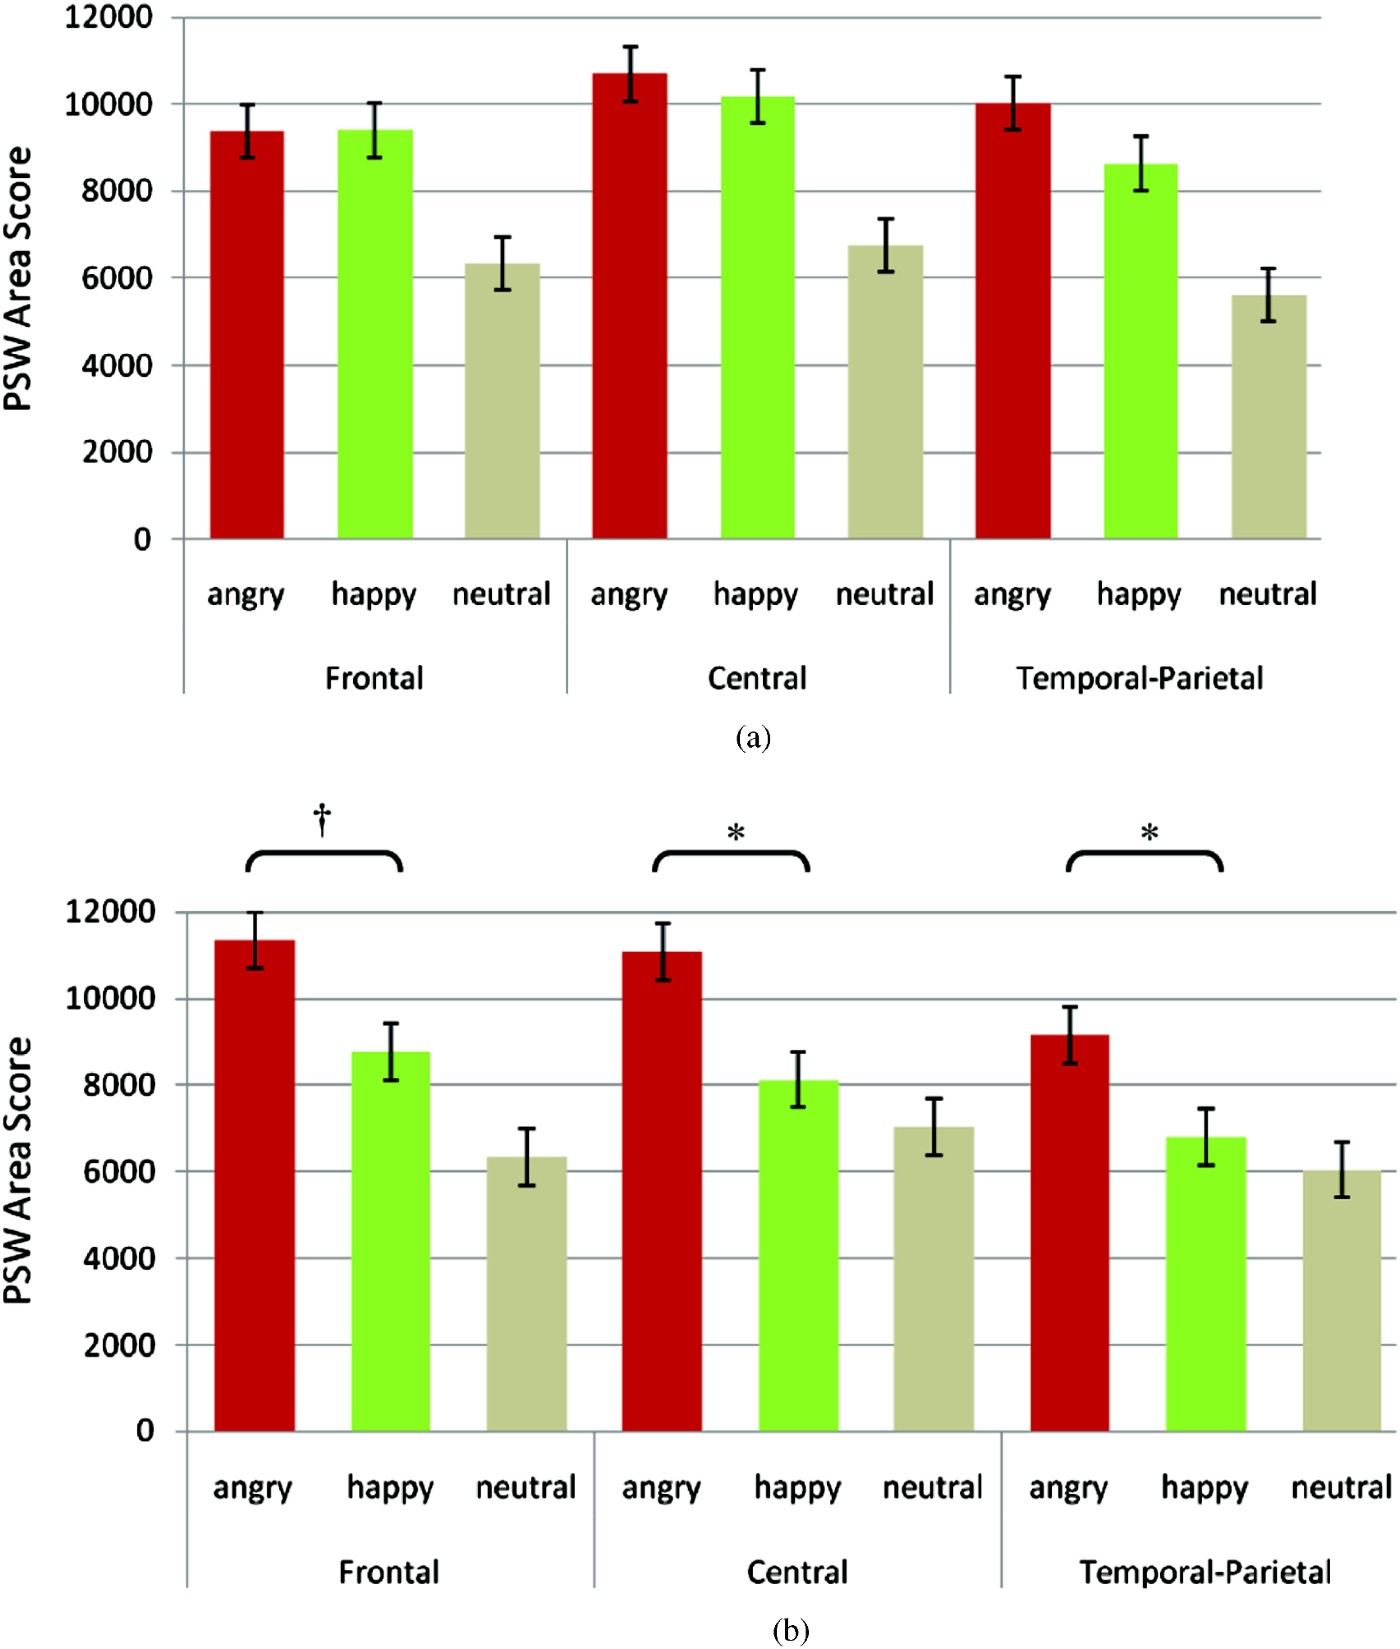
Post hoc paired comparisons within the nonmaltreated group showed greater PSW area scores for angry and happy faces compared to neutral at frontal electrode sites, t (24) = 5.59, p < .001, and t (45) = 2.22, p = .037, for angry versus neutral and happy versus neutral, respectively. Further, the PSW area score was greater in response to angry compared to happy facial expressions, t (24) = 1.80, p = .085. At central sites, the PSW area score was greater in response to angry compared to happy faces, t (24) = 2.42, p = .024, and greater for angry compared to neutral faces, t (24) = 2.79, p = .011. Similarly, at temporal–parietal sites, PSW area score was greater in response to angry compared to happy faces, t (24) = 2.29, p = .032, and greater for angry compared to neutral faces, t (24) = 2.40, p = .025, within the nonmaltreated comparison group.
Selected post hoc between group comparisons indicated that the PSW area score in the angry condition was marginally greater for the nonmaltreated group relative to the maltreated group in the frontal composite region, t (70) = 1.71, p = .092. Further, the PSW area score in the happy condition was marginally greater for the maltreated group in both the central region, t (70) = 1.71, p = .093, and the temporal–parietal region, t (70) = 1.95, p = .055.
Discussion
Over the course of the past two decades, a preponderance of research has clearly demonstrated and delineated the effects of the experience of maltreatment on children's processing of emotion from affective facial expressions. In particular, several ERP studies with school aged maltreated children have demonstrated atypicalities in neural processing of facial expressions of emotion, most notably in response to anger (e.g., Pollak et al., Reference Pollak, Cicchetti, Klorman and Brumaghim1997, Reference Pollak, Klorman, Thatcher and Cicchetti2001; Pollak & Tolley-Schell, Reference Pollak and Tolley-Schell2003). Broadly, this research, both behavioral and brain-based, has demonstrated that the central, underlying aberration in emotion processing in children who have experienced maltreatment appears to be a hyperresponsivity to anger.
Further, our previous work demonstrated that the effects of maltreatment on neural indices of emotion processing occur relatively early in development at 30 months of age (Cicchetti & Curtis, Reference Cicchetti and Curtis2005). The current study extended these findings to children at 42 months of age and investigated additional face-specific ERP components observed across occipital electrode sites, which were previously unexamined in maltreated children. The present investigation yielded several significant findings; as a whole, they point to continued support for the hypothesis that young children who have experienced maltreatment early in life demonstrate a hyperresponsivity to angry facial expressions.
One of the key sets of findings from the current study involved ERP waveforms that are maximal over occipital electrode sites, often considered “face-sensitive” components. In particular, the early positive component, P1, differentiated between maltreated and nonmaltreated children's processing of facial affect, whereby P1 amplitude elicited by angry facial expressions was greater for maltreated compared to nonmaltreated children. The P1 component has been shown to index relatively automatic early visual processing, and is believed to be a result of attentional influences on early face processing (e.g., de Haan, Johnson, & Halit, Reference de Haan, Johnson, Halit and de Haan2007). In particular, it is sensitive to affective facial expressions in typically developing young children (e.g., Batty & Taylor, Reference Batty and Taylor2006; Dennis, Malone, & Chen, Reference Dennis, Malone and Chen2009; Todd, Lewis, Meusel, & Zelazo, Reference Todd, Lewis, Meusel and Zelazo2008). However, these studies have shown that the latency, and not amplitude, of the P1 is sensitive to facial affect, finding that longer latencies follow negative emotions compared to neutral and positive emotions (e.g., Batty & Taylor, Reference Batty and Taylor2006; Dennis et al., Reference Dennis, Malone and Chen2009).
Further, in a sample of institutionalized and noninstitutionalized young children in Romania, there were no amplitude or latency effects found for this component associated with facial emotion (Moulson et al., Reference Moulson, Westerlund, Fox, Zeanah and Nelson2009). However, Dawson et al. (Reference Dawson, Webb, Carver, Panagiotides and McPartland2004), in a study investigating neural processing of facial affect in young children with Autism and typically developing children, examined a relatively early ERP component they labeled as the P200, identified over posterior electrode sites between 150 and 270 ms. The amplitude of this component was greater in response to fearful faces compared to neutral in the typically developing children, and also had an earlier peak latency in response to fear relative to neutral (Dawson et al., Reference Dawson, Webb, Carver, Panagiotides and McPartland2004). Although this waveform had a later peak latency than the component described as the P1 in the current study, the overall morphology suggests that it may be similar.
Although there is not sufficient evidence to allow a definitive conclusion regarding whether increased amplitude of the P1 is normatively associated with negative or positive facial emotion in young children, there is nonetheless evidence from both adults and children strongly suggesting that the P1 does broadly index early discrimination of facial affect. The current study did not find latency effects for the P1. However, the present results showing increased P1 amplitude in response to angry facial expressions in maltreated children are consistent with the general hypothesis that maltreated children are more responsive to angry facial affect. As hypothesized by Pollak (Reference Pollak2008), children likely become more sensitive to aspects of their environments that are more salient through a learning process that may directly impact perceptual mechanisms. For maltreated children, angry facial affect is a more familiar and frequent experience (e.g., Herrenkohl et al., Reference Herrenkohl, Herrenkohl, Egolf, Wu, Starr and Wolfe1991), and is likely also of particular ecological salience, potentially associated with threat. Anger expressed in a caregiver's face may signal the initiation of a negative emotional outburst, or even potentially an episode of abuse. It would therefore be adaptive for increased neural resources to be devoted to the clear and rapid identification of anger in the face of the maltreating caregiver. This is consistent with behavioral evidence showing that maltreated children exhibit enhanced perceptual sensitivity to angry facial cues (Pollak & Kistler, Reference Pollak and Kistler2002).
Another occipital component, the N170, was examined in the current study. Numerous studies in both adults and children have shown the N170 to be a face-sensitive ERP component thought to reflect structural encoding of faces, greater in amplitude and shorter in latency in response to faces compared to other types of stimuli (e.g., Batty & Taylor, Reference Batty and Taylor2003). The N170 has adultlike morphology in children as young as 4 years of age, and reliably discriminates between objects and faces at this age (e.g., Taylor, McCarthy, Saliba, & Degiovanni, Reference Taylor, McCarthy, Saliba and Degiovanni1999). However, there is conflicting evidence concerning whether the N170 indexes discrimination of facial affect in young children. In typically developing children, Batty and Taylor (Reference Batty and Taylor2006) reported that this component discriminated emotion only in adolescents and not young children, and a study of 4- to 6-year-olds found no evidence of N170 amplitude or latency differences between happy and angry faces (Todd et al., Reference Todd, Lewis, Meusel and Zelazo2008). Moulson et al. (Reference Moulson, Westerlund, Fox, Zeanah and Nelson2009), in a study of institutionalized and noninstitutionalized young Romanian children, also did not find emotion-specific N170 effects.
Dawson et al. (Reference Dawson, Webb, Carver, Panagiotides and McPartland2004) did find that their N300 component, which they suggested may correspond to the N170, was greater in amplitude in response to a fear face compared to a neutral face in 32- to 57-month-old typically developing children. The current findings indicated that happy facial expressions elicited a larger N170 than angry faces within the maltreated group. In contrast, N170 amplitude was equivalent across angry, happy, and neutral faces within the nonmaltreated group. The latter finding is consistent with previous evidence showing that the N170 is not sensitive to face emotion. However, without nonface stimuli, it is not possible to conclude that this component is face specific in the current sample. Given this caveat, the current findings suggest that, for the maltreated children, this component does reflect discrimination of facial affect. However, the finding is not consistent with the overall hypothesis of hyperresponsivity to anger in maltreated children.
Rather, it is possible that the N170 indexes the relative novelty of the happy facial expression for the maltreated children. However, with no significant differences across emotion for the nonmaltreated group, this interpretation should be made with caution. Although not statistically significant, perhaps due to the smaller total number of the nonmaltreated group, it is interesting to note that within the nonmaltreated group there was a trend in the data suggesting greater N170 amplitude in response to angry compared to happy facial expressions (see Figure 7). Parallel to the findings from the maltreated group, this could reflect increased N170 amplitude in response to relative affective novelty (i.e., anger) in the nonmaltreated children.
The final occipital component examined in the current study was the P400, which showed greater amplitude in response to angry faces within the maltreated group, and was also greater in response to angry for the maltreated compared to the nonmaltreated children. This finding is further consistent with the hypothesis of hyperresponsivity to anger. The P400 component has been studied primarily in young infants up to age 12 months, and although there is ample evidence that the amplitude and latency of this component is selectively sensitive to faces versus objects in young infants (e.g., de Haan & Nelson, Reference de Haan and Nelson1999), there is little data to indicate whether it is sensitive to facial affect, particularly beyond infancy. One study indicated that the P400 was greater in response to fearful relative to happy and neutral facial expressions in 7-month-old infants (Lepanen, Moulson, Vogel-Farley, & Nelson, 2007), and Kobiella, Grossman, Reid, and Striano (Reference Kobiella, Grossman, Reid and Striano2008) reported that this component was larger in response to fearful compared to angry facial expressions. However, Moulson et al. (Reference Moulson, Westerlund, Fox, Zeanah and Nelson2009) did not find emotion-related differences in the P400 in their sample of 30-month-old Romanian children.
The current findings demonstrate that this component is sensitive to facial affect in maltreated young children, and provides an additional index of their overall hyperresponsivity to angry facial affect. However, one important caveat would be that there were no P400 amplitude differences across emotion within the nonmaltreated group. Thus, the question arises, why does this component differentiate anger from other emotions in maltreated children but not in the comparison children? Exposure to the atypical emotional environment found in maltreating homes, predominantly comprised of negative, angry affect, may set the development of neurofunctional systems associated with this component on a trajectory that facilitates more efficient identification of angry facial affect. Similar to the P1 component, the devotion of greater neural resources to the identification of anger as reflected by the P400 would accrue an adaptive advantage to children living in maltreating environments.
The first of the frontal–central components examined in the current study, the N150, showed a large overall amplitude difference between the maltreated and nonmaltreated groups. The children in the nonmaltreated group, on average, had a peak amplitude over 3.0 µV greater than the children in the maltreated group, representing a fairly large effect size at ηp2 = 0.23.
The functional correlates of this waveform, maximal over frontal and central electrode sites, are unclear. In adults, an early negative component, the N100, indexes early sensory stages of feature detection, encoding and classification, as well as selective attention to stimulus characteristics (Key, Dove, & Maguire, Reference Key, Dove and Maguire2005; Vogel & Luck, Reference Vogel and Luck2000). Beteleva (Reference Beteleva1998), applying a principal components analysis, found negative ERP components in the 140- to 200-ms interval across frontal and parietal sites that were correlated with detection of distinctive features of pictures in a classification task in 7-year-olds. Alternatively, this component has been characterized as the polarity reversal of the P1 (e.g., Batty & Taylor, Reference Batty and Taylor2006), and has been observed over central and frontal sites in adults during a face recognition task (Rossion et al., Reference Rossion, Campanella, Gomez, Delinte, Debatisse and Liard1999). However, regardless of the specific morphology and identity of this waveform, it appears to index early perceptual, preattentive processing of visual stimuli, although it is not clear whether it is uniquely sensitive to faces or facial affect.
Parallel to the current finding, Parker et al. (Reference Parker and Nelson2005) reported fairly substantial between group differences on a similar latency early negative component elicited by viewing facial affect, with institutionalized young children showing lower overall amplitude compared to children who had never been institutionalized. This was interpreted as part of a pattern of results reflecting an overall maturational lag in nervous system development in the institutionalized children (Parker et al., Nelson, Reference Parker and Nelson2005). In our study of 30-month-old maltreated and nonmaltreated toddlers (Cicchetti & Curtis, Reference Cicchetti and Curtis2005), a morphologically similar waveform at virtually the same latency was found. However, there was not a similar large overall between group difference. Thus, it is difficult to draw parallels from our previous findings to the current study. One particularly relevant question concerns why such an effect would be observed in the current sample, who were, on average, only 12 months older than those in our previous study.
It is possible, if not likely, that the deprivation experienced by the institutionalized children in the Parker et al. (Reference Parker and Nelson2005) sample was far greater than that encountered in the maltreated sample from Cicchetti and Curtis (Reference Cicchetti and Curtis2005). It is conceivable that the additional time spent by the current sample under adverse and emotionally atypical environments during this developmentally sensitive period may have further altered perceptual processes associated with recognition of facial affect, thus yielding the effect observed in the present study. However, the observed attenuation of this ERP component is not specific to any particular facial affect. It is interesting to note that the findings concerning the N150 did not parallel those for the P1, where emotion-specific effects were seen. This may reflect functional differences between the two components, with the P1 being more sensitive to facial affect.
Another critical set of findings from the current study concerned the striking group differences that emerged for the amplitude of the P240 component, maximal over frontal and central electrode sites. The first of these findings was the interaction between maltreatment status and emotion, where, for children in the maltreated group, P240 amplitude was greater while viewing angry faces compared to happy faces. In contrast, P240 amplitude was greater in response to happy faces relative to angry faces for children in the nonmaltreated group. In addition, the amplitude of the P240 was greater in response to angry faces for the children in the maltreated group compared to those in the nonmaltreated group. Given this component's apparent sensitivity to facial affect, the P240 may represent a relatively later perceptual process that includes recognition of the affective component of a face.
A similar early positive component, labeled P250, was investigated in ERPs evoked by facial expressions of fear, anger, happiness, and sadness in institutionalized and never institutionalized Romanian infants and young children (Moulson et al., Reference Moulson, Westerlund, Fox, Zeanah and Nelson2009; Parker et al., Reference Parker and Nelson2005). This component appears to have substantial similarity in amplitude, morphology, and latency to the P240 waveform that emerged in the current study. Parker et al. (Reference Parker and Nelson2005) reported that, for frontal midline electrode sites, the never institutionalized children had greater P250 amplitude in response to fearful versus sad facial expressions, whereas the institutionalized group had greater P250 amplitude in response to viewing happy and sad facial expressions relative to the anger expression. However, it was concluded that the emotion-based group differences in the P250 were a residual effect of differences found in the preceding waveform. In a follow-up to Parker et al. (Reference Parker and Nelson2005), Moulson et al. (Reference Moulson, Westerlund, Fox, Zeanah and Nelson2009) examined this component elicited from children viewing facial affect at 30 and 42 months of age. At 30 months, a main effect showed that fearful faces elicited larger P250 amplitude than happy faces, and that it peaked earlier for happy faces compared to angry faces. However, there were no between group (institutionalized versus never institutionalized) differences for the P250 (Moulson et al., Reference Moulson, Westerlund, Fox, Zeanah and Nelson2009).
In our previous ERP study of 30-month-olds (Cicchetti & Curtis, Reference Cicchetti and Curtis2005), maltreated children exhibited greater amplitude of a similar early positive component (P260) at lateral frontal leads in response to viewing angry facial expressions, compared to a group of nonmaltreated comparison children. The current findings are, in large part, consistent with the findings from Cicchetti and Curtis (Reference Cicchetti and Curtis2005), and are more definitive in their support of the hypothesis that maltreated children are relatively more responsive to angry facial affect.
This finding may be further indicative of the impact of maltreatment on neurofunctional processes underlying the identification of anger. For maltreated children, detecting anger in the face of a caregiver would be of particular relevance, as this facial expression may be associated with threat and an impending episode of abuse. In addition, maltreated children may have more experience, and thus a greater familiarity, with angry faces than children in nonmaltreating families, as there is evidence demonstrating increased negative affect in maltreating homes (e.g., Kavanaugh et al., Reference Kavanaugh, Youngblade, Reid and Fagot1988).
The finding of increased P240 amplitude in response to angry stimuli follows a pattern parallel to that obtained by Pollak and colleagues (e.g., 1997, 2001), where school-aged maltreated children had a larger amplitude of a P300-like waveform in response to angry faces compared to happy faces. Although the P240 component found in the current study is not functionally related to the later positive waveform reported by Pollak et al. (Reference Pollak, Cicchetti, Klorman and Brumaghim1997, Reference Pollak, Klorman, Thatcher and Cicchetti2001), it is clear that there is a parallel in the hyperresponsivity to angry facial expressions by maltreated compared to nonmaltreated children.
Much of the work by Pollak and colleagues has utilized samples of children who have predominantly experienced physical abuse (e.g., Pollak & Tolley-Schell, Reference Pollak and Tolley-Schell2003) and may thus not be directly comparable to the current sample. Further, the current findings also suggest, given the predominance of neglect cases in the present maltreated sample, that physical abuse per se may not be the sole mechanism whereby children become hyperresponsive to anger. It appears likely that the affective environment of homes in which neglect is occurring is also primarily negative and is associated with high degrees of family conflict and aggression (e.g., Connell-Carrick & Scannapieco, Reference Connell-Carrick and Scannapieco2006; Gaudin et al., Reference Gaudin, Polansky, Kilpatrick and Shilton1996). Young children living in such environments may also become sensitized to negative, angry affect in much the same way as children who have been direct victims of physical abuse.
In addition to the between group effects found for P240, within the nonmaltreated group the P240 amplitude was larger in response to viewing happy faces compared to both angry and neutral faces. In contrast, within the maltreated group, the P240 amplitude was greater while viewing angry compared to happy faces. These findings suggest that this component may index familiarity and/or relevance/salience of facial emotion. However, there is not sufficient data on typically developing children in this age range to provide support for this hypothesis.
There was also a regional difference in P240 amplitude between the maltreated and nonmaltreated children. This finding, although not including an interaction with emotion, revealed that P240 amplitude was greater across frontal and central sites relative to temporal–parietal sites for the maltreated group, for all three emotions combined. For the nonmaltreated group, P240 amplitude was greater at frontal sites compared to central and temporal–parietal sites, but there was no difference between central and temporal–parietal sites. This finding suggests that the P240 is more focused over frontal sites in the nonmaltreated group but more widely distributed over both frontal and central sites in the maltreated children. This distinction in ERP topography between the maltreated and nonmaltreated children may be due to differences in the underlying neural generator of the P240. However, it is difficult to draw firm conclusions concerning the exact nature of such differences, given the relatively large scalp area (and underlying cortical surface) defined by the electrodes comprising the composite regions in the present analysis. Nevertheless, these results may be suggestive of some meaningful differences between maltreated and nonmaltreated children that could be investigated utilizing higher density electrode arrays.
The current study also examined the Nc component elicited by the emotion face stimuli. Overall, the amplitude of the Nc was lower in the maltreated children relative to the nonmaltreated comparisons, by nearly 4 µV, consistent with the finding of attenuated amplitude of the N150 and N170 components in the maltreated children. As discussed earlier, this finding also parallels that from Parker et al. (Reference Parker and Nelson2005), where institutionalized children had overall significantly lower Nc amplitude compared to children who had never been institutionalized. However, these authors found that the amplitude of all the observed components was significantly lower in the institutionalized group, and they hypothesized that the globally lower amplitudes reflected an overall maturational lag in nervous system development in the institutionalized children (Parker et al., Reference Parker and Nelson2005). For the maltreated sample in the current study, this interpretation may not be appropriate, in particular because there was not an overall amplitude attenuation across all components examined. The only previous examination of this component in maltreated children (Cicchetti & Curtis, Reference Cicchetti and Curtis2005) did not show decreased Nc amplitude; hence, it is more unlikely that it reflects a global maturational lag, given that the previous sample was younger. Thus, the meaning of this finding is somewhat unclear.
The current study also investigated the PSW, thought to reflect memory updating of stimuli that are not completely encoded (e.g., Nelson & Monk, Reference Nelson, Monk, Nelson and Luciana2001). A three-way interaction between region, emotion, and group was found, whereby the PSW was greater across frontal electrodes in response to angry faces for the nonmaltreated children compared to the children in the maltreated group. In contrast, the PSW was greater for the maltreated children relative to the nonmaltreated while viewing happy facial expressions over central and temporal–parietal regions. In addition, within the nonmaltreated group, the PSW was greater in response to angry faces compared to happy. These findings perhaps reflect that maltreated children have less experience with happy facial expressions relative to anger. Thus, increased PSW amplitude may index the use of greater neural resources required to update into memory the less familiar happy facial expression. In contrast, angry facial expressions may be less familiar to nonmaltreated children, and as such, require more resources to be updated in memory. Further, the between group regional differences suggest that the PSW may have a more widely distributed neural generator in the maltreated group, parallel to the regional findings for the P240. This finding should provide an impetus to examine topographic ERP differences utilizing dipole source analysis to more precisely specify the location of underlying neural generators and potential differences across maltreated and nonmaltreated children. It is possible that the influence of the atypical affective environment found in maltreating families on the amplitude of ERP components may also influence the development of topographical patterns of these components.
Taken as a whole, the current findings indicate that, by 42 months of age, children who have experienced maltreatment during their first year of life clearly manifest alterations in neural indices of processing facial affect. Because experience-dependent processes continue to operate during periods of exposure to trauma and aberrant emotional environments, the neurodevelopmental processes of children who encounter atypical emotional experiences, such as those associated with maltreatment, may eventuate in neuropathological instead of functional neuronal connections (Black, Jones, Nelson, & Greenough, Reference Black, Jones, Nelson, Greenough, Alessi, Coyle, Harrison and Eth1998; Courchesne, Chisum, & Townsend, Reference Courchesne, Chisum and Townsend1994). In addition, such early experiential abnormalities may lead to the development of aberrant neural circuitry that may increase risk for the development of relatively enduring forms of psychopathology (Cicchetti & Cannon, Reference Cicchetti and Cannon1999).
There are some limitations that should be considered when interpreting the results of the current study. First, future studies of the consequences of early maltreatment on brain functioning should ideally include a larger number of children who have experienced physical abuse or sexual abuse. Of the maltreated children in the current sample, the majority had experienced neglect, with too few children who had experienced physical or sexual abuse at the individual level to analyze these groups separately. In research with a maltreated population, it is difficult to access infants and toddlers who have experienced these more severe forms of maltreatment because such children are typically placed in foster care. However, it would be important to be able to investigate the hypothesis that different types of maltreatment have differential influences on brain development and functioning. It is likely that the experience of more severe forms of maltreatment have even more serious consequences for brain functioning.
There are also some important caveats that are necessary to consider when comparing the current findings to those of other studies. Most strikingly, there is a decided lack of ERP studies on recognition of facial affect in children between the ages of 12 and 48 months. The bulk of the literature has typically been conducted with infants from ages 4 to 12 months, and relatively little is known about the neural correlates of face processing in toddlers. In addition to the current investigation, Parker et al. (Reference Parker and Nelson2005), Moulson et al. (Reference Moulson, Westerlund, Fox, Zeanah and Nelson2009), and Cicchetti and Curtis (Reference Cicchetti and Curtis2005) are among the few studies to examine children in this age range.
Longitudinal studies are also needed in order to more fully understand typical development of ERP components elicited by facial emotion, beginning in early infancy and continuing through early childhood. Such work was undertaken by one group of investigators with children during the first year of life, yielding important findings on the development of face-sensitive ERPs (Webb, Long, & Nelson, Reference Webb, Long and Nelson2005). A more comprehensive understanding of the normative development of emotion face processing would serve to inform studies of children who experience adversity early in life. It is well established that the brain continues to develop across infancy and childhood, and may exhibit a cascade of effects in response to adverse social experience (Cicchetti & Curtis, Reference Cicchetti, Curtis, Cicchetti and Cohen2006; Cicchetti & Tucker, Reference Cicchetti and Tucker1994; Pollak, Reference Pollak2008).
Implications for translation
It is imperative that investigations of brain functioning in children who have experienced maltreatment inform prevention and intervention efforts (e.g., Cicchetti & Gunnar, Reference Cicchetti and Gunnar2008). Results from the current study suggest that children who have experienced maltreatment during the first year of life, although not severe enough to warrant placement in foster care, still exhibit clear brain-based abnormalities in processing facial affect at 42 months of age. This finding argues for the importance of providing preventive interventions to children who have experienced maltreatment early in life in order to avert the potential negative cascade of effects this experience may have on brain development and functioning and on other domains (e.g., cognition, emotion, social–cognition) and salient developmental issues throughout the life course. The fact that children in this investigation were from largely neglectful homes also highlights the importance of not assuming that children from abusive homes should receive priority with respect to the provision of preventive interventions. Rather, very early in life, children with histories of neglect develop a hypersensitivity to detecting anger. Therefore, in order to prevent adverse outcomes associated with this facial detection bias, preventive interventions should be provided to all maltreated children.
The present results, as well as previous ERP findings with maltreated children (e.g., Cicchetti & Curtis, Reference Cicchetti and Curtis2005; Pollak et al., Reference Pollak, Cicchetti, Klorman and Brumaghim1997, Reference Pollak, Klorman, Thatcher and Cicchetti2001), suggest that such interventions might focus on training in facial affect recognition (Izard, Fine, Mostow, Trentacosta, & Campbell, Reference Izard, Fine, Mostow, Trentacosta and Campbell2002). More intensive intervention efforts also might attempt to change the salience and/or representation of emotion, in particular, that of anger. For example, an attachment intervention (e.g., child–parent psychotherapy; Cicchetti, Rogosch, & Toth, Reference Cicchetti, Rogosch and Toth2006) could focus on changing negative representations of cognitive and emotional processes, such as that demonstrated by Toth, Maughan, Manly, Spagnola, and Cicchetti (Reference Toth, Maughan, Manly, Spagnola and Cicchetti2002).
Likewise, interventions aimed at increasing maternal accuracy in encoding and decoding affect and those geared toward improving maternal sensitivity also hold potential. Finally, it would be extremely interesting to include baseline and postintervention measures of ERPs elicited by facial affect in evaluations of treatment efficacy (see Cicchetti & Gunnar, Reference Cicchetti and Gunnar2008). Given that behavioral and representational changes have been shown to improve in attachment theory-informed interventions (e.g., Cicchetti et al., Reference Cicchetti, Rogosch and Toth2006; Toth et al., Reference Toth, Maughan, Manly, Spagnola and Cicchetti2002), it is important to ascertain if ERPs, a manifestation of brain functioning, could also exhibit postintervention improvement (Cicchetti & Curtis, Reference Cicchetti, Curtis, Cicchetti and Cohen2006; Curtis & Cicchetti, Reference Curtis and Cicchetti2003).
In closing, it is important to emphasize the value that research on basic developmental processes during the early years of life possesses for informing social policy initiatives on behalf of maltreated children. Prevention scientists have cogently advocated for the need to develop, provide, and evaluate research- and theory-informed models of prevention (Toth, Pianta, & Erickson, in press). Rather than waiting until a significant problem emerges and then providing treatment, the current research, in conjunction with that of other investigations in the field, underscores the criticality of harnessing knowledge on basic developmental processes and exporting it more broadly to individuals in positions to develop and provide preventive interventions to vulnerable children and families.