1. Introduction
Negative triangularity has recently become one of the most attractive and investigated solutions for optimizing the plasma confinement in tokamaks, in particular for future reactors including also DEMO. This is because of the experimentally observed energy confinement improvement it induces, initially observed in TCV (Pochelon et al. Reference Pochelon, Goodman, Henderson, Angioni, Behn, Coda, Hofmann, Hogge, Kirneva and Martynov1999) and more recently confirmed in DIII-D (Austin et al. Reference Austin, Marinoni, Walker, Brookman, de Grassie, Hyatt, McKee, Petty, Rhodes and Smith2019). For an overview of the history of negative triangularity tokamaks we also refer to Marinoni, Sauter & Coda (Reference Marinoni, Sauter and Coda2021). The most relevant advantage of negative triangularity L-mode discharges is the possibility of achieving the same global performance as a positive triangularity ELMy H-mode. This is particularly appealing since such a reactor scenario would avoid the well-known edge localized mode (ELM) problem associated with H-mode operation (Kikuchi et al. Reference Kikuchi, Takizuka, Medvedev, Ando, Chen, Li, Austin, Sauter, Villard and Merle2019).
Although there is an increasing amount of experimental evidence from several machines corroborating the beneficial effects of negative triangularity on confinement (Camenen et al. Reference Camenen, Pochelon, Behn, Bottino, Bortolon, Coda, Karpushov, Sauter and Zhuang2007; Fontana et al. Reference Fontana, Porte, Coda and Sauter2017; Huang & Coda Reference Huang and Coda2018; Marinoni et al. Reference Marinoni, Austin, Hyatt, Walker, Candy, Chrystal, Lasnier, McKee, Odstrčil and Petty2019; Coda et al. Reference Coda, Merle, Sauter, Porte, Bagnato, Boedo, Bolzonella, Février, Labit and Marinoni2021), as well a large number of numerical studies based on those plasmas, analysing both the core (Marinoni et al. Reference Marinoni, Brunner, Camenen, Coda, Graves, Lapillonne, Pochelon, Sauter and Villard2009; Merlo et al. Reference Merlo, Brunner, Sauter, Camenen, Görler, Jenko, Marinoni, Told and Villard2015, Reference Merlo, Fontana, Coda, Hatch, Janhunen, Porte and Jenko2019, Reference Merlo, Huang, Marini, Brunner, Coda, Hatch, Jarema, Jenko, Sauter and Villard2021; Duff et al. Reference Duff, Faber, Hegna, Pueschel and Terry2022) and the edge-Scrape Off Layer physics (Riva et al. Reference Riva, Lanti, Jolliet and Ricci2017; Laribi et al. Reference Laribi, Serre, Tamain and Yang2021), an investigation of the interplay of negative triangularity with other plasma parameters is missing, or at least not complete. The goal of this paper is thus to attempt to partly fill this gap via gyrokinetic modelling. While at first glance this might appear as a mere academic exercise, it is in fact relevant because it can help in identifying certain parameter regimes where the beneficial effect of triangularity $\delta$ is amplified. At the same time, as we will show, it also reveals certain parameter interactions that make $\delta <0$
 show no difference or even a poorer performance compared with $\delta >0$
 .
Above all, compared with experimental investigations, a purely numerical approach has the advantage that all plasma parameters can be freely and independently controlled, so that single effects can be isolated and attributed. This can be particularly important for triangularity, which does not enter directly into any term in the gyrokinetic description but, affecting the magnetic geometry, modifies essentially all terms in the gyrokinetic model. Obviously, there are also downsides to using a purely numerical approach. Care must be put into deciding the region of parameter space that one wants to explore, in particular for the choice of the flux-surface shape. While for this specific analysis it might be tempting to maximize shaping and obtain very exotic geometries, one must be very careful not to construct unrealistic or experimentally non-achievable configurations. This is even more serious when carrying out local simulations, as we will do in this work; higher-order shaping factors such as triangularity rapidly vanish moving from the edge to the core, such that large shaping can easily translate to non-realistic last closed flux surface shapes. At the same time, one also needs to make sure that any conclusion drawn holds true in a steady state scenario. It is very common for negative triangularity investigations to perform simulations starting from an experimental positive $\delta$ plasma, flipping the triangularity and then measure the impact on fluxes. Although in almost all cases this leads to a reduction of fluxes, thus it is interpreted as a better confinement, one must also investigate what happens to the system when it reaches a proper steady state, i.e. account for profile stiffness and non-local effects, making sure that the effect of $\delta <0$
 indeed persists in a realistic situation. In this work, we will avoid using too extreme plasma shapes by selecting our geometries based on existing discharges, as discussed below. On the other hand, we will perform only local simulations but look at profile stiffness, without aiming to construct a complete radially flux-matched profile or consider corresponding global geometries. We leave this for future work.
Using a simple Miller model (Miller et al. Reference Miller, Chu, Greene, Lin-Liu and Waltz1998) to describe a flux surface, we linearly investigate the interaction between triangularity $\delta$ and the other plasma parameters related to the magnetic geometry, such as the safety factor, magnetic shear, elongation, aspect ratio and squareness. This reveals that negative triangularity is beneficial, i.e. reduces the growth rates for all the aforementioned parameters, with the exception of magnetic shear $s$
 , which has a non-trivial effect. This motivated a more in-depth investigation of the linear and nonlinear interplay between triangularity and magnetic shear, in both ion temperature gradient (ITG) and trapped electron mode (TEM) dominated scenarios. We will show that negative $\delta$
 can have a beneficial effect also in ITG scenarios, provided that $s$
 is sufficiently large. The same behaviour is observed in TEM dominated plasmas, where a sufficiently low shear can cause a higher transport level when $\delta <0$
 compared with its $\delta >0$
 counterpart. This is understood as a consequence of how the linear instabilities are affected by both $\delta$
 and $s$
 .
The remainder of the paper is organized as follows. We present the numerical model in § 2 and investigate the behaviour in ITG and TEM dominated plasmas, respectively, in §§ 3 and 4. Finally, conclusion are drawn in § 5. Additional results are provided for clarity in Appendices A and B.
2. Numerical model
All simulations shown in this work have been carried out using the flux-tube version of the gyrokinetic GENE code (Jenko et al. Reference Jenko, Dorland, Kotschenreuther and Rogers2000). GENE solves the gyrokinetic equation (Brizard & Hahm Reference Brizard and Hahm2007) using a field aligned coordinate system $(x,y,z)$ to discretize the configuration space, while $(v_{\parallel },\mu )$
 are used as velocity variables. Here, $x$
 stands for the radial, $y$
 for the binormal and $z$
 for the parallel direction. The variable $\mu =mv_{\perp }^2/2B$
 represents the magnetic moment, while $v_{\parallel }$
 and $v_{\perp }$
 are the components of velocity, respectively, parallel and perpendicular to the magnetic field; $m$
 is the mass of the particle and $B$
 the local magnitude of the magnetic equilibrium field $\boldsymbol {B}$
 . To ensure numerical convergence of each simulation, different box sizes $L_x\times L_y$
 have been used. Typical values are $L_x\sim L_y\sim 150\rho _s$
 , considering 256 $k_x \times 64 k_y$
 modes. A total of 48 $n_z$
 points have been used in the parallel direction. The limits for the velocity space grids of each species were set from $-3$
 to 3 for $v_{\parallel }/v_{{\rm th},j}$
 and from 0 to 9 for $\mu B_0/T_j$
 , $v_{{\rm th},j}=\sqrt {2T_j/m_j}$
 being the thermal velocity and $B_0$
 the magnetic field on axis, using unless differently stated $48\times 16$
 points. Spectral pile-up due to unresolved scales is avoided using adaptive hyperdiffusions in both perpendicular directions (Bañón Navarro et al. Reference Bañón Navarro, Teaca, Jenko, Hammett and Happel2014).
Throughout this work we will use a Miller parametrization (Candy Reference Candy2009) to express the relevant geometric quantities of interest. One therefore assumes that the contour of a flux surface in a poloidal plane $\varphi =\mathrm {const.}$ is given in cylindrical coordinates $(R,Z,\varphi )$
 by


where the elongation $\kappa$ , triangularity $\delta$
 and squareness $\zeta$
 have been introduced. Here, $r$
 is the geometric minor radius $r=(R_{max}-R_{min})/2$
 . We remark that such parametrization is not suited for very strong shaping, as can often be seen in the near edge region or tokamaks. In these cases, a Fourier decomposition in the poloidal angle would be more accurate and preferable, but it is not necessary for our analysis. Equations (2.1) and (2.2) already provide a sufficiently complex geometric model that allows us to capture the non-trivial interplay between plasma parameters. Using a richer geometric description can allow us to more effectively optimize the actual shape, but at the cost of a significantly more complex description and computationally expensive analysis, which we therefore leave for the future.
Within such a model, the magnetic geometry is fully specified by choosing the values of $\kappa$ , $\delta$
 , $\zeta$
 , their radial derivatives, the safety factor $q$
 , the magnetic shear $s$
 and the aspect ratio $\epsilon$
 . These parameters, together with the value of temperature and density (as well as their gradients) of each plasma species fully describe a confined plasma. For simplicity, we will not consider collisions and limit ourselves to the electrostatic regime by setting a very small value for the plasma $\beta$
 . Base plasma parameters, that will be used in the runs of §§ 3 and 4 are inspired by an actual TCV (Tokamak à Configuration Variable) discharge, as listed in table 1.


We have neglected for simplicity squareness because it both has a negligible impact on our results (we have verified that linear growth rates are not significantly affected when we use a small TCV-like value of squareness) and we want to focus exclusively on triangularity.
In spite of the relatively simple geometric model, we are able to recover a rich and not necessarily trivial behaviour, as shown in figures 1 and 2. There, we plot the growth rate of the most unstable mode obtained varying at the same time triangularity and another plasma parameter, while keeping the other parameters fixed to the values indicated in table 1. Details of temperature and density gradients will be provided in the following sections. This analysis is carried out for $k_y\rho _s=0.3$ , where we expect nonlinear transport to peak. We observe that the trends are similar for both ITG and TEM regimes, an that negative triangularity is almost always associated with a reduction of the linear growth rate. The only parameter related to magnetic geometry that causes $\delta <0$
 to be more unstable than its $\delta >0$
 counterpart, or at least display a non-monotonic behaviour, is magnetic shear $s$
 . While for large shear (e.g. $s>$
 0.7 in the TEM regime) negative triangularity is stabilizing, for small values ($-0.2< s<0.5$
 ) the effect is the opposite. As we already mentioned, given that magnetic shear and $\delta$
 do not explicitly enter into the gyrokinetic equation, but rather enter via the metric coefficients, this already hints towards the details of the plasma geometry as being crucial. These results also suggest the possibility of $\delta <0$
 not being always advantageous, so that understanding the interaction between $\delta$
 and $s$
 can help identify regimes where the confinement improvement can be optimized. We will therefore investigate the interaction between these two parameters in the next sections.
Growth rate for the mode $k_y\rho _s=0.3$ as a function of triangularity $\delta$
 and other shaping coefficient for ITG base case parameters.

Same as figure 1 but for TEM base case parameters.

3. The ITG dominated regime
We begin by considering an ITG dominated regime. To simplify as much as possible our simulations and avoid the possible presence of (even subdominant) trapped electron modes, we perform most of our simulations with adiabatic electrons. Although this is a strong simplification, and high-fidelity gyrokinetic simulations including kinetic electrons are expected to be necessary to model most of the actual experiments, we want to focus here on a purely ITG dominated scenario. As such, adiabatic electrons are a reasonable approximation and can be effectively used to model turbulent transport. We also remark that the same numerical model was used for the analyses presented in both Duff et al. (Reference Duff, Faber, Hegna, Pueschel and Terry2022) and Highcock et al. (Reference Highcock, Mandell, Barnes and Dorland2018). The latter in particular describe a plasma shape optimization process which finds that strong negative triangularity reduces turbulent transport, a conclusion in agreement with some of our results. Nonetheless, considering adiabatic electrons represents a strong simplification of the true plasma dynamics, regardless of plasma shaping. Therefore, we have performed additional simulations with kinetic electrons (assuming, unless differently stated, no electron temperature gradient) to corroborate adiabatic electron results. As we will discuss, transport reduction is seen in both cases, whereas a modification of the nonlinear onset of turbulence is seen only with adiabatic electrons, a result that we therefore consider not robust.
3.1. Linear results
Figure 3 shows the linear growth rate, as a function of plasma triangularity and magnetic shear, of the most unstable mode associated with $k_y\rho _i=0.01$ (a), 0.3 (b) and 0.5 (c). Besides the non-trivial dependence on shear and $\delta$
 for a given $k_y$
 mode, one also observes a shift of the most unstable mode towards negative triangularity and negative shear as $k_y$
 diminishes. While for large wavenumbers, $k_y\rho _s\simeq 0.5$
 (i.e. the most unstable linear mode), positive triangularity is associated with the largest values of $\gamma$
 (which for a given value of $\delta$
 is stabilized by increasing shear $s$
 ), this is not true anymore for smaller values of $k_y$
 . For instance, at $k_y\rho _s\simeq 0.3$
 the maximum linear growth is found around $s=1$
 and $\delta \simeq 0$
 , while positive (respectively negative) triangularity is stabilized a small (respectively large) magnetic shear. This is even more evident at $k_y\rho _s=0.01$
 , where the maximum of linear growth rate occurs for large negative triangularity. Assuming a simple mixing length estimate, $\gamma /k_{\perp }^2$
 , it already appears evident that the balance between the contribution from all $k_y$
 modes to the nonlinear fluxes will be crucial in setting the actual transport level.
Growth rate $\gamma$ as a function of triangularity $\delta$
 and magnetic shear $s$
 for different values of the binormal wavenumber $k_y\rho _s$
 (indicated in the title of each plot).

From now on, we restrict our attention to four different values of magnetic shear: $s= -0.6$ , 0.6, 0.8 and 1.3, and the two values of triangularity, $\delta =\pm 0.4$
 . The values of $\delta$
 are motivated by experiments; they represent some of the largest values routinely obtained for the Last Closed Flux Surface in TCV. No particular reason forces us to choose those values of shear, we simply take positive values (large and intermediate) and a negative shear value, of potential interest for advanced tokamak regimes. Furthermore, in order to help the reader, unless differently stated, we will plot in red all results pertaining to positive triangularity and use blue for negative.
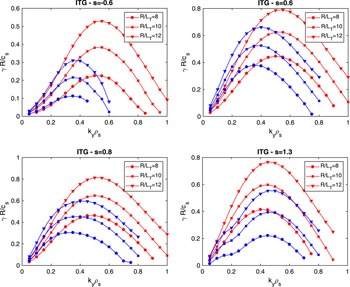
We show in figure 4 the linear growth rates obtained for these values of shear for three different values of ITG, $R/L_{T_i}=8$ , 10 and 12. One observes that, for a given gradient, negative triangularity has always a smaller maximum growth rate, but the spectra of linear modes appear also to be shifted towards lower $k_y$
 as the shear is decreased. This again hints towards the need of accounting for all wave vectors, and the actual nonlinear spectra peaking at different $k_y$
 for the different shapes. Indeed, as it turns out and will be discussed in the next sections, nonlinearly negative triangularity turns out to be beneficial, i.e. results in lower fluxes for all these three cases, with the only exception of $s=0.8$
 where little difference in transport is observed.
Growth rate $\gamma$ as a function of the binormal wavenumber $k_y\rho _s$
 for positive ($\delta =0.4$
 , red symbols) and negative triangularity ($\delta =-0.4$
 , blue symbols). The values of $s$
 is indicated in the title of each plot.

As already observed for elongation in Angelino et al. (Reference Angelino, Garbet, Villard, Bottino, Jolliet, Ghendrih, Grandgirard, McMillan, Sarazin and Dif-Pradalier2009), when considering shaped plasmas the choice of the radial coordinate is not unique. As a consequence, the same profile will result in different values of scale length when changing the definition of the radial coordinate itself. Furthermore, because shaping flux surfaces are compressed and stretched apart as one moves along the parallel direction such that simply using $a/L_{T}$ to characterize the turbulent drive might be not sufficient, accounting for the effective gradient $\langle a/L_{T_i}\boldsymbol {\nabla } x\rangle$
 , where $\langle \cdot \rangle$
 indicates a flux surface average, accounts for the effect of triangularity only partially. For a given gradient, the difference in growth rates between shapes is reduced, but not completely recovered, indicating that some additional mechanism is at play in setting the different behaviour between the two geometries.
To gain further insight, we can consider the linear gyrokinetic equation, which in the GENE field aligned coordinates reads

and selectively remove the terms appearing on the right-hand side. A similar approach has been used in e.g. Dannert et al. (Reference Dannert, Günter, Hauff, Jenko, Lapillonne and Lauber2008) to investigate the impact of fast ions. In (3.1) $K_x=-1/B_0^2\boldsymbol {B}\times \boldsymbol {\nabla } B_0\boldsymbol {\cdot } x$ and $K_y=-1/B^2\boldsymbol {B_0}\times \boldsymbol {\nabla } B_0\boldsymbol {\cdot } y$
 are the normal and binormal curvatures and $C=\boldsymbol {B_0}\boldsymbol {\cdot } \boldsymbol {B_0}$
 , $J^{-1}=\boldsymbol {B_0}\boldsymbol {\cdot }\boldsymbol {\nabla } z/C$
 and $\bar \phi =J_0\phi$
 is the gyroaveraged potential. The various terms appearing in right-hand side terms are therefore the parallel advection, the trapping term, the background drive and the contributions due to radial ($x$
 ) and binormal ($y$
 ) curvature. As expected, linear results are not affected by removing the $K_x$
 and trapping terms, whereas modifications of any of the remaining terms leads to significant changes in the linear growth rate. It might be tempting to replace the crucial terms, i.e. the binormal curvature, the parallel dynamics and the perpendicular wave vector entering in the gyroaveraging, with those of the opposite geometry, so as to measure their impact. Such an analysis is, however, not capable of consistently capturing the effects of changes in the plasma shape. As an example we show in figure 5 the results for the case $s=1.3$
 , i.e. the one with largest differences between positive and negative triangularity. Here, we have replaced the $K_y$
 curvature, the $C/JB_0$
 geometrical factor appearing in the parallel dynamics (change labelled with //) and the metric elements appearing in the calculation of $k_{\perp }$
 with those of the opposite geometry. As one sees, when starting from $\delta >0$
 it appears sufficient to modify the binormal curvature to recover most of the change, whereas for $\delta <0$
 one has to modify all the geometrical coefficients to approach the results obtained from the different shape. We understand this as a consequence of using a non-consistent geometry, such that only if a term is not relevant it can be dropped, but not arbitrarily replaced.
Growth rate obtained by modifying the geometrical factors appearing in the gyrokinetic equation by using those of the opposite triangularity. In (a) and (b) we consider as a reference the positive and negative triangularity shapes.

In order to consistently evaluate the contribution of the different linear terms to the growth rate, we evaluate the growth rate by analysing the time evolution of the system free energy. As discussed in e.g. Manas et al. (Reference Manas, Camenen, Benkadda, Hornsby and Peeters2015), from the energy conservation of the Vlasov equation, one can express the growth rate of a given linear mode from the variation of the potential energy $E_{\phi }$ as

where the sum runs over all $j$ -plasma species with charge $q$
 and density $n_0$
 . Here

and

are the potential energy and its derivative (Bañón Navarro et al. Reference Bañón Navarro, Morel, Albrecht-Marc, Carati, Merz, Görler and Jenko2011), $\phi$ is the electrostatic potential and $f_j$
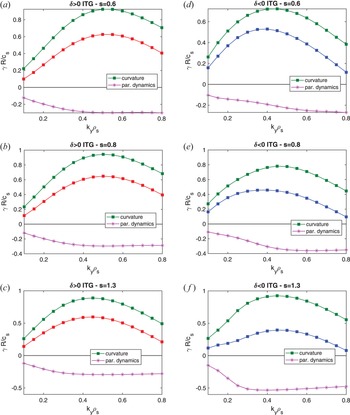
 is the distribution function. This definition allows us to separate the contribution of the different linear terms to the overall growth rate, which is a result of the destabilizing curvature terms and stabilizing parallel dynamics (the latter including both the parallel streaming and the trapping terms). We can also use (3.2) to identify the contribution from every species, as well do in § 4.1. The results of such an analysis are shown in figure 6.
Growth rate contributions versus the binormal wave vector $k_y$ for (a–c) positive and (d–f) negative triangularity and different values of magnetic shear. The contribution from curvature is shown with green squares and that from the parallel dynamics with pink stars. The growth rate is shown as a reference in red and blue lines.

As expected, we see that the linear instability result has a non-trivial dependence on shear and triangularity. At large shear, the reduction of growth rates associated with negative triangularity is due to a large stabilizing effect from the parallel dynamics, almost twice as large when $\delta <0$ with respect to $\delta >0$
 , while the curvature induces essentially the same destabilization. This behaviour changes for other values of magnetic shear. We observe a less strong destabilization from curvature when shear is lowered for negative triangularity, but at the same time also a smaller stabilization from the parallel dynamics, such that, for the case at $s$
 =0.6 at low $k_y$
 , the growth rate ends up being larger for $<0$
 than for $\delta >0$
 . This analysis confirms that the behaviour of the linear instabilities results from a complex interaction between curvature and the parallel dynamics, which depends on triangularity, magnetic shear and wave vector. No obvious differences are observed when comparing the eigenfunctions of the most unstable mode, as show in figure 7, where we plot the mode structure of the mode $k_y\rho _s=0.3$
 for different values of magnetic shear. We also plot the values of the perpendicular wave vector $k_{\perp }$
 as well as the binormal curvature $K_y$
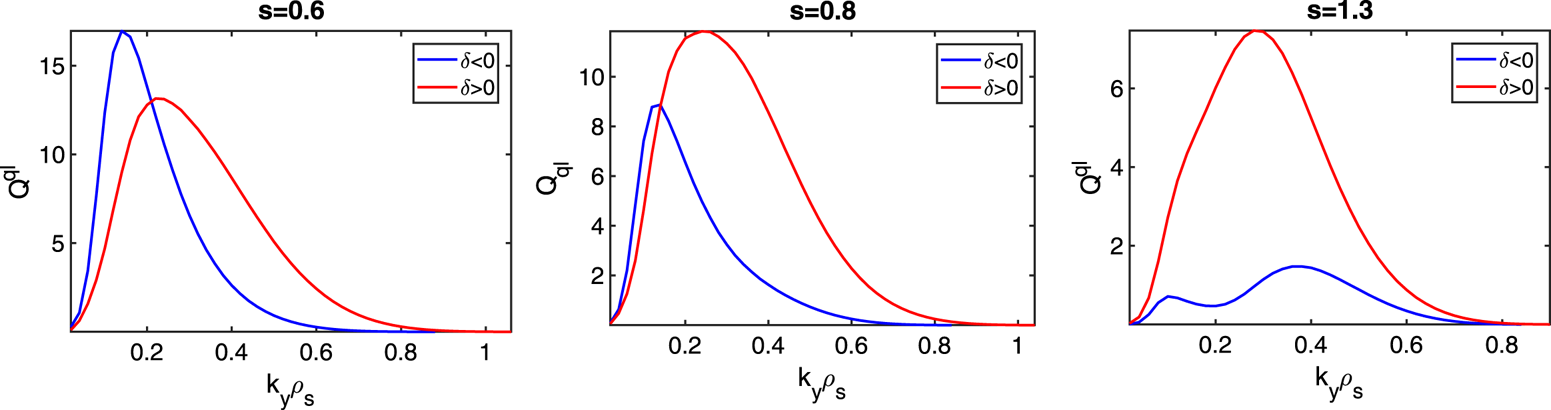
 . We observe clearly different values of both the binormal curvature (negative here means in the bad direction) and the perpendicular wave vector, i.e. different finite Larmor radius effects, but only minor difference in the eigenfunction. Nonetheless, by using simple quasilinear estimates one expects a different linear stability to translate into different spectral contributions, indicating that details in the mode structure are relevant. Figure 8 plots the results of the quasilinear model discussed in Mariani et al. (Reference Mariani, Brunner, Dominski, Merle, Merlo, Sauter, Görler, Jenko and Told2018), which computes fluxes according to

where $A_0$ is a scaling factor associated with the absolute fluctuation amplitude, $w^{\rm ql}_{k_y}$
 is the quasilinear weight modelling the saturation levels of the nonlinear electrostatic potential and $Q^{l}_{k_y}$
 is the linear spectral component to the flux associated with the $k_y$
 mode, i.e. the flux evaluated with the fields from the corresponding linear eigenmode. We refer to Mariani et al. (Reference Mariani, Brunner, Dominski, Merle, Merlo, Sauter, Görler, Jenko and Told2018) and the references therein for the exact definition of $Q^{l}$
 . We use a simple mixing length estimate (Casati et al. Reference Casati, Bourdelle, Garbet, Imbeaux, Candy, Clairet, Dif-Pradalier, Falchetto, Gerbaud and Grandgirard2009) for the weights

where $\langle k_{\perp }^2\rangle$ is the flux-surface average of the squared perpendicular wavenumber weighted by the mode amplitude. As figure 8 shows, the increase of shear shifts the largest contributing mode to higher $k_y$
 , much more significantly for $\delta <0$
 than for $\delta >0$
 . We remark that, so far, we have set $A_0=1$
 for all shapes and not yet tuned the amplitude estimate, which in principle can be shape and triangularity dependent. We leave such study for the future and simply show in figure 9 the integrated heat fluxes as a function of shear. As can clearly be seen, the quasilinear estimates correctly capture the reduction of fluxes for both shapes as shear increases, see e.g. figure 11, as well as the lower fluxes for $\delta <0$
 . The value of $s$
 at which the transport is maximum appears instead to be underestimated with respect to actual nonlinear results.
Eigenfunctions (solid lines) for the mode $k_y\rho _s=0.3$ together with the perpendicular wave vector $k_{\perp }$
 (dashed) and the binormal curvature $K_y$
 (dot-dash). Red (blue) curves refer to positive (negative) triangularity.


Heat fluxes as a function of magnetic shear obtained from quasilinear estimates. Red (blue) curves refer to positive (negative) triangularity.

Finally, in figure 10 we partially address the question of (linear) critical gradients. For all values of shear we scan both triangularity and ITG until the mode is stabilized. As already noted in Merlo et al. (Reference Merlo, Brunner, Sauter, Camenen, Görler, Jenko, Marinoni, Told and Villard2015), triangularity can affect the linear critical gradient and result in higher $R/L_{T_{crit}}$ for $\delta <0$
 . However, we find here that the situation is more complex and once again affected by the value of magnetic shear. Consistently with the results presented in figure 4, at large positive shear, the linear critical gradient is higher for $\delta <0$
 while the situation is reversed at small or negative shear, indicating that the increase of critical gradient might not be a universal feature of negative triangularity.
Growth rate of the mode $k_y\rho _s=0.3$ as a function of triangularity and ITG for (a) $s=-0.6$
 , (b) $s=0.6$
 , (c) $s=0.8$
 and (d) $s=1.3$
 .

3.2. Nonlinear results
We now move to nonlinear results, starting from the ones obtained for nominal parameters, $R/L_{T_i}=10$ , $R/L_n=3$
 . This allows us to be sufficiently far from the nonlinear onset of turbulence and focus exclusively on the transport level. The dependence of critical gradient on $\delta$
 will be addressed later on. In figure 11 we plot the nonlinear fluxes obtained for different values of magnetic shear. For both $s$
 =-0.6 and $s>1$
 , negative triangularity reduces the transport level. For $s=0.8$
 the flux is instead roughly the same, regardless of the sign of triangularity. We remark that we are plotting only the heat flux and neglecting the fact that the two shapes have different surface areas $S$
 . In this case, $S_{\delta <0}$
 , the negative triangularity surface, is approximately $6\,\%$
 higher than its $\delta >0$
 counterpart, a minor effect with respect to variations of the fluxes themselves that we will discuss.
Heat flux obtained from GENE simulation varying the magnetic shear $s$ . Blue bars correspond to $\delta <0$
 while red $\delta >0$
 . Simulations consider adiabatic electrons.

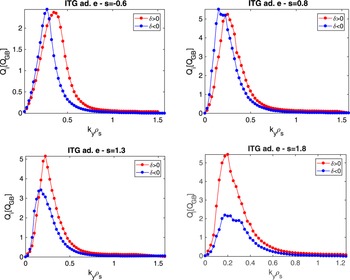
Flux spectra are plotted in figure 12. Consistently with linear simulation, low $k_y$ modes are more unstable when $\delta <0$
 but this is counterbalanced by the high $k_y$
 modes. This is particularly evident for the $s$
 =0.8 case, where the same transport level is obtained from a downshifted flux spectrum in $k_y$
 .
Ion heat flux spectra for the cases shown in figure 11.

The dependency of the heat flux on the temperature gradient is shown in figure 13. No difference in stiffness is observed between the two different values of triangularity. We observe an apparent increased Dimits shift for $\delta >0$ , in particular for the positive shear cases where positive triangularity shows a significant increase of the nonlinear critical gradient (see also figure 10), not seen for negative triangularity. This, however, appears to be limited to the adiabatic electron cases. We have performed the same set of runs (only for the case $s=1.3$
 for simplicity) also including kinetic electrons, obtaining the results shown in figure 14. Simulations consider here electrons with deuterium mass ratio and no electron temperature gradient and a small value of $\beta =10^{-3}$
 for numerical reasons. A systematic higher flux for $\delta >0$
 and no indication of a stronger Dimits shift is now found, indicating that a triangularity dependence of the nonlinear upshift is not a robust feature and it should not be investigated based on adiabatic electron simulations, which might lead to incorrect results. Clearly, a definitive conclusion of the impact of triangularity on the Dimits shift cannot be solely drawn from the results of figure 14 and requires a dedicated investigation, which is left for future work.
Sensitivity of ion heat flux with respect to variation of ITG for $s=-0.6$ , 0.8 and 1.3.

Sensitivity of heat fluxes with respect to variation of ITG for $s=1.3$ . Red symbols indicate results for $\delta >0$
 and blue $\delta <0$
 ; ion fluxes are shown with circles and electron fluxes with triangles.

4. The case of TEM dominated plasmas
We now move to investigate the behaviour of TEM dominated regimes, the condition in which negative triangularity is expected to yield the best performance compared with $\delta >0$ as TEMs may be suppressed, as already observed in some of the earliest modelling of shaping effects on transport (Rewoldt, Tang & Chance Reference Rewoldt, Tang and Chance1982). We simplify the analysis by consider the electrostatic limit (we set $\beta =10^{-3}$
 for numerical reasons) and neglect collisions. The same Miller parametrization as in the previous section is used and we define our base plasma parameter set based on Merz & Jenko (Reference Merz and Jenko2008). Thus, for the nominal TEM case we use $R/L_n=4$
 , $R/L_{T_e}=10$
 and $R/L_{T_i}=0$
 , with $T_e/T_i=3$
 . Although for reactor relevant conditions one might want to consider a smaller temperature ratio, the results are not significantly affected by the temperature ratio. Therefore, we perform all our runs using the aforementioned value to avoid destabilizing electron temperature gradient modes, allowing for a cheaper numerical set-up. We have nonetheless performed few runs with equal ion and electron temperatures, drawing the same conclusions.
4.1. Linear results
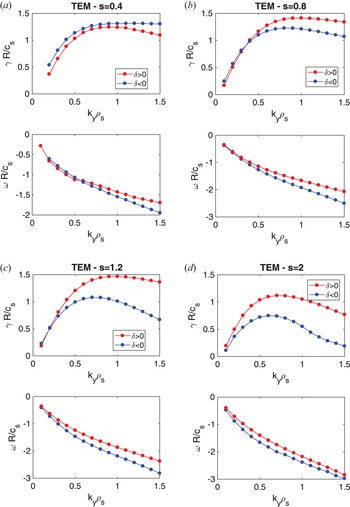
We directly show the results obtained for four different values of magnetic shear: $s=0.4$ , 0.8, 1.2 and 2. For all of them we plot in figure 15 growth rates and frequencies of the most unstable mode. Similar to the ITG dominated plasmas discussed in § 3, we observe that flipping the sign of triangularity affects the behaviour at all values of $k_y$
 , but more significantly at large wavenumbers ($k_y\rho _s>0.6$
 in our case) which are strongly stabilized by $\delta <0$
 . The low $k_y$
 behaviour is again shear dependent with similar, or even larger, growth rates for $\delta <0$
 (see e.g. figure 15(a) where $\gamma$
 is slightly larger for all $k_y<0.4$
 ), when shear is small.
Linear growth rates $\gamma$ and frequencies $\omega$
 as a function of the wavenumber $k_y$
 in red (respectively blue) for negative (respectively positive) triangularity. The value of magnetic shear is indicated in the title of each panel.

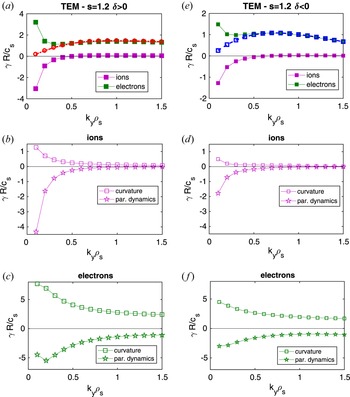
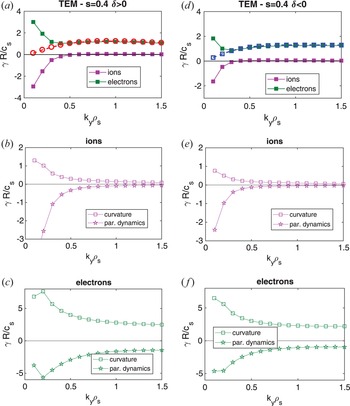
The decomposition of the linear instability drive between curvature and the parallel dynamics is shown in figures 16 and 17 for the two cases of $s=1.2$ and $s=0.4$
 . For all cases, including the other values of magnetic shear not shown here for simplicity, the linear instability is driven by the electrons, with the ions playing a stabilizing role for modes at $k_y\leq 0.4$
 and otherwise being negligible. In all cases, the instability results from the combined destabilizing effect of curvature and stabilizing effect of the parallel dynamics. The interaction between these contributions varies with $k_y$
 , making the analysis complicated. In addition, because the absolute magnitude changes it is difficult to compare absolute contributions between shapes because they all change in amplitude, such that one can only carefully compare ratios.
Decomposition of the linear growth rates $\gamma$ among ion and electron contributions for (a) positive and (d) negative triangularity shapes with $s=1.2$
 . The total growth rate is shown as reference with dashed lines. For both values of triangularity we then show in (b,c) and (e,f) the contributions of curvature (squares) and the parallel dynamics (stars) to each species.

Same as figure 16 but showing results obtained with $s=0.4$ .

Considering first the $s=1.2$ case, when going from $\delta >0$
 to $\delta <0$
 , for all $k_y$
 modes the positive electron contribution to the growth rate is reduced as well as the negative contribution from ions. The reduction is essentially the same for both species for $k_y<0.3$
 , such that the growth rate ends up being unaffected. For modes at $k_y>0.3$
 instead the reduction is more pronounced for the electrons (the ions are negligible), resulting in lower growth rates. Considering in more detail the effect of changing triangularity on the electrons, the destabilization from curvature for negative triangularity is reduced by approximately 60 %–70 % of the positive $\delta$
 value for all $k_y$
 modes, whereas the stabilization from the parallel dynamics is less affected by the change of $\delta$
 as $k_y$
 increases (the exact ratios are shown in figure 21). Therefore, the modification of the electron parallel dynamics appears to be responsible for the reduction of the linear growth. The opposite situation can be observed for the cases with $s=0.4$
 : inverting the triangularity reduces less the destabilizing electron contribution from curvature with respect to the parallel dynamics, such that the growth rate increases, as one sees from figure 15.
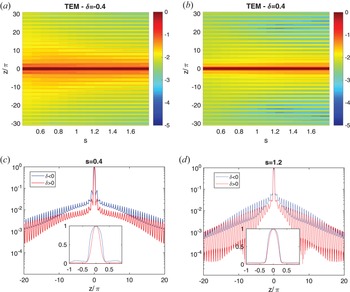
The eigenfunctions of the mode $k_y=0.3$ are compared in figure 18, where one observes again a minor difference in the central peak region $|z/{\rm \pi} |<1$
 but a less steep decay of the tails for $\delta <0$
 and low values of shear, which can potentially indicate a different role played by passing electrons (Hallatschek & Dorland Reference Hallatschek and Dorland2005). The quasilinear model discussed in § 3.1 can be applied to the TEM scenario as well, capturing certain features of the actual nonlinear spectra, in particular the shift of the largest contributing mode. The results are, however, much more sensitive to the choice of the model, in particular the number of connected $k_x$
 modes and the weights. We therefore leave developing accurate quasilinear models for future work.
Ballooning structure of the electrostatic potential as a function of the extended ballooning variable $z$ and magnetic shear $s$
 for (a) negative and (b) positive triangularity. Panels (c,d) compare the eigenfunctions for shear 0.4 and 1.2 with insets zooming over the region $|z/{\rm \pi} |<1$
 .

4.2. Nonlinear results
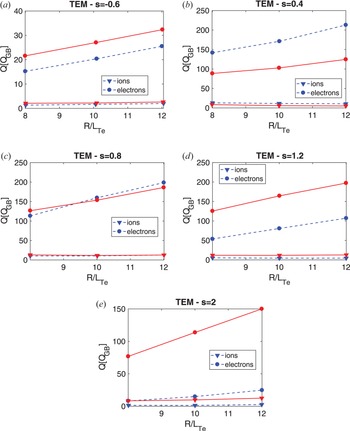
We performed corresponding nonlinear simulation for all four values of magnetic shear varying the electron temperature gradient $\pm 20\,\%$ . The simulated heat fluxes are shown in figure 19 (see Appendix B for the particle fluxes). We show the total heat flux, sum of electrostatic and electromagnetic components, although the latter is negligible. We observe, in agreement with the linear results and similarly to what is observed in ITG dominated plasmas, that the effect of negative triangularity is large and beneficial for large values of magnetic shear. For $s=2$
 , figure 19(d), there is almost a factor of eight reduction in the electron heat flux, from $Q\simeq$
 110 $Q_{GB}$
 for $\delta >0$
 to $Q\simeq 15$
 $Q_{GB}$
 for $\delta <0$
 and a nearly complete stabilization of the ion heat flux. The situation is reversed at low magnetic shear, see for example figure 19(a) for $s=0.4$
 , where the transport seen with negative triangularity is roughly 50 % larger than the one observed for its positive triangularity counterpart. At sufficiently large negative shear, figure 19(a), negative triangularity again becomes advantageous, similarly to what happened in the ITG dominated scenario, with a roughly 20 % lower flux. Once again, we do not find clear indications of a shape-dependent stiffness. Flipping triangularity simply results in an up-shift of the flux levels, thus indicating an increase in the critical gradients, regardless from the value of shear and thus the total transport level. An essentially identical conclusion can be reached considering the particle fluxes (see Appendix B).
Simulated heat flux as a function of the electron temperature gradient for different values of magnetic shear. Red solid (respectively blue dashed) lines indicate results for positive (respectively negative) triangularity. Electron fluxes are indicated with circles and ion fluxes with triangles.

The electron heat flux spectra for the two cases with s = 0.4 and 1.2 are shown in figure 20. They reveal similar features to the ITG results, with the peak contribution slightly shifted towards lower $k_y$ when $\delta <0$
 , and contributions at the different wavenumbers following the same trends as the linear growth rates. At low shear the difference between shapes is determined by the behaviour of low $k_y$
 modes, which are linearly more unstable and driving much more flux for $\delta <0$
 . At larger shear instead the difference is more significant due to the behaviour of high $k_y$
 modes ($k_y>0.3)$
 , linearly stabilized by negative triangularity, and which make almost half the contribution to nonlinear fluxes.
Ratio of contributions to linear growth rates from the parallel dynamics and curvature between negative and positive triangularity. Panel (a) shows ion contributions and (b) electron contributions. Linear results are the same as in figure 16.

5. Summary and discussion
Performing local linear and nonlinear gyrokinetic simulations, we have investigated the interaction between negative triangularity and magnetic shear, the latter parameter affecting the overall transport levels in a complex manner.
Using a Miller parametrization to describe a given flux surface, linear simulations show that negative triangularity is beneficial in conjunction with almost all the standard plasma shaping parameters, that is, the linear growth rates decrease when triangularity is large and negative. This behaviour is seen for both ITG and TEM dominated scenarios. The only exception is represented by magnetic shear, which plays a non-trivial role. Also, $\delta <0$ is found to be always advantageous for large magnetic shear, but this does not remain true for lower values of $s$
 , where the behaviour can reverse, obtaining larger fluxes for negative triangularity. The linear instabilities are in all cases we have considered driven by curvature (and the trapping term for TEM) and stabilized by the parallel dynamics but, for a given set of gradients and $k_y$
 mode, the exact balance depends on both the values of $\delta$
 and $s$
 .
We find that negative triangularity can be beneficial already in ITG dominated plasmas (even when modelled with adiabatic electrons), with a large reduction of the ion fluxes for $s>1$ . At lower shear, we often observe a reduction (increase) of high (low) $k_y$
 modes when triangularity is reversed, such that the spectra are shifted towards lower $k_y$
 for $\delta <0$
 but can result in equivalent fluxes regardless of the sign of triangularity. No indication of a different stiffness depending on shape is found. For this latter investigation, it is crucial to use a fully kinetic electron response. Only in that case we do not observe the strong increase of nonlinear critical gradients associated with $\delta >0$
 that was otherwise seen when using adiabatic electrons.
A similar behaviour is observed in TEM dominated regimes, where $\delta <0$ is associated with a strong reduction of fluxes for sufficiently large $s$
 . The situation is, however, completely inverted when shear is reduced, with e.g. roughly $50\,\%$
 larger fluxes for $s=0.4$
 and $\delta <0$
 .
From the perspective of the impact of negative triangularity on turbulent transport and $\delta <0$ being a solution for future reactor operation, this work has at least two major consequences. First, the role of triangularity is not always beneficial and it can interplay with other plasma shaping parameters in non-trivial ways. This can potentially lead to an increase of fluxes rather than to a reduction of them, as commonly expected. This should not be understood as a limitation to $\delta <0$
 , but rather an option to further exploit when designing discharges where the entire magnetic geometry is optimized for turbulence reduction. Secondarily, the interplay with shear that we observe should already be taken into account when analysing current experiments, which show different safety factor profiles (Austin et al. Reference Austin, Marinoni, Walker, Brookman, de Grassie, Hyatt, McKee, Petty, Rhodes and Smith2019) for reversed edge triangularities. Clearly, this is even more relevant for the near edge region, where not only $\delta$
 is large, but also shear can vary rapidly.
Finally, we point out that the major limitation of our current analysis is that we have used a local model, i.e. analysed only a given flux surface. The magnetic geometry is intrinsically a global property of a confined plasma and often with rapid radial variations of shaping coefficients, in particular high-order shaping terms such as triangularity. As such, it is desirable to extend the analysis we have performed to fully consistent global equilibria, which ultimately have also to be used for any realistic optimization effort. We will address this aspect in a future publication.
Acknowledgements
The authors acknowledge T. Göerler for useful discussions about details of the Miller geometry. The authors acknowledge the Texas Advanced Computing Center (TACC) at The University of Texas at Austin for providing HPC resources that have contributed to the research results reported within this paper. some of the simulations have been performed on the Marconi supercomputer at CINECA.
Editor Paolo Ricci thanks the referees for their advice in evaluating this article.
Declaration of interests
The authors report no conflict of interest.
Appendix A. Ratios between linear driving terms
The ratio of contributions to linear growth rates from the parallel dynamics and curvature between negative and positive triangularity are shown in figures 21 and 22.
Ratio of contributions to linear growth rates from the parallel dynamics and curvature between negative and positive triangularity. Panel (a) shows ion contributions and (b) electrons. Linear results same as in figure 16.

Ratio of contributions to linear growth rates from the parallel dynamics and curvature between negative and positive triangularity. Panel (a) shows ion contributions and (b) electrons. Linear results same as in figure 17.

Appendix B. Particle fluxes in TEM dominated scenario
We show in figure 23 the particle fluxes obtained for the simulations described in figure 19.
Particle flux as a function of the electron temperature gradient for different values of magnetic shear. Red (respectively blue) curves indicate results for positive (respectibely negative) triangularity.