


Introduction
The flow speed of a temperate glacier fluctuates under the influence of basal conditions. Because subglacial water plays an important role in basal flow processes, short-term flow variations are often induced by changes in water input caused by an intensive melt event (e.g. Reference Iken, Röthlisberger, Flotron and HaeberliIken and others, 1983; Reference Naruse, Fukami and AniyaNaruse and others, 1992; Reference Mair, Nienow, Willis and SharpMair and others, 2001), diurnal meltwater production (e.g. Reference Iken and BindschadlerIken and Bindschadler, 1986; Reference Sugiyama and GudmundssonSugiyama and Gudmundsson, 2003), heavy rainfall (e.g. Reference Jansson, LeB and HookeJansson and Hooke, 1989; Reference Gudmundsson, Bassi, Vonmoos, Bauder, Fischer and FunkGudmundsson and others, 2000) and drainage of a glacial lake (e.g. Reference Nolan and EchelmeyerNolan and Echelmeyer, 1999).
To study the response of a glacier to short-term variations in water input, high-frequency ice-flow measurements are required. Automatic operation of a distance meter (Reference Hanson, LeB, Hooke and GraceHanson and others, 1998), theodolite (Reference Gudmundsson, Bassi, Vonmoos, Bauder, Fischer and FunkGudmundsson and others, 2000) and global positioning system (Reference GudmundssonGudmundsson, 2002) have been used for surface flow speed measurements with intervals of hours or less. Alternatively, surface strain has been measured on several glaciers with specially prepared strainmeters (Reference Raymond and MaloneRaymond and Malone, 1986; Reference Jansson, LeB and HookeJansson and Hooke, 1989). Reference Raymond and MaloneRaymond and Malone (1986) installed several strainmeters on Variegated Glacier, Alaska, USA, and observed propagation of strain anomalies during fast-flow events.
We operated a wire strainmeter on a temperate valley glacier in Kamchatka, Russia, and used the same apparatus to measure marginal sliding speed. This paper reports the observations of surface strain anomalies and sliding-speed variations induced by water stored in the glacier. Results reveal the influence of non-uniformly distributed subglacial water pressures on the flow regime of the glacier.
Measurement Apparatus
The wire strainmeter constructed for this study was similar to that used on Variegated Glacier (Reference Raymond and MaloneRaymond and Malone, 1986). Changes in the distance between two metal poles (36mm diameter, 1m long) installed on the glacier were measured using a Super Invar wire (0.25mm diameter). One end of the wire was fixed to one of the poles, while the other end was connected to a metal block balanced with a pivot on the second pole (Fig. 1a). The metal block tilts when the glacier surface strains, and the tilt was sensed by a displacement transducer (Keyence AT3-001) placed in contact with the block. Direct-current output from the transducer was recorded every minute with a datalogger (Hioki 3635-05) with a resolution of 10–3 mm, corresponding to a strain of 10–6 when the poles were installed 1 m apart.
(a, b) Schematic diagrams showing the installation of the wire strainmeter for (a) surface strain and (b) marginal sliding measurements. (c) The key component of the strainmeter which measures the tilt of the metal block with the displacement transducer.

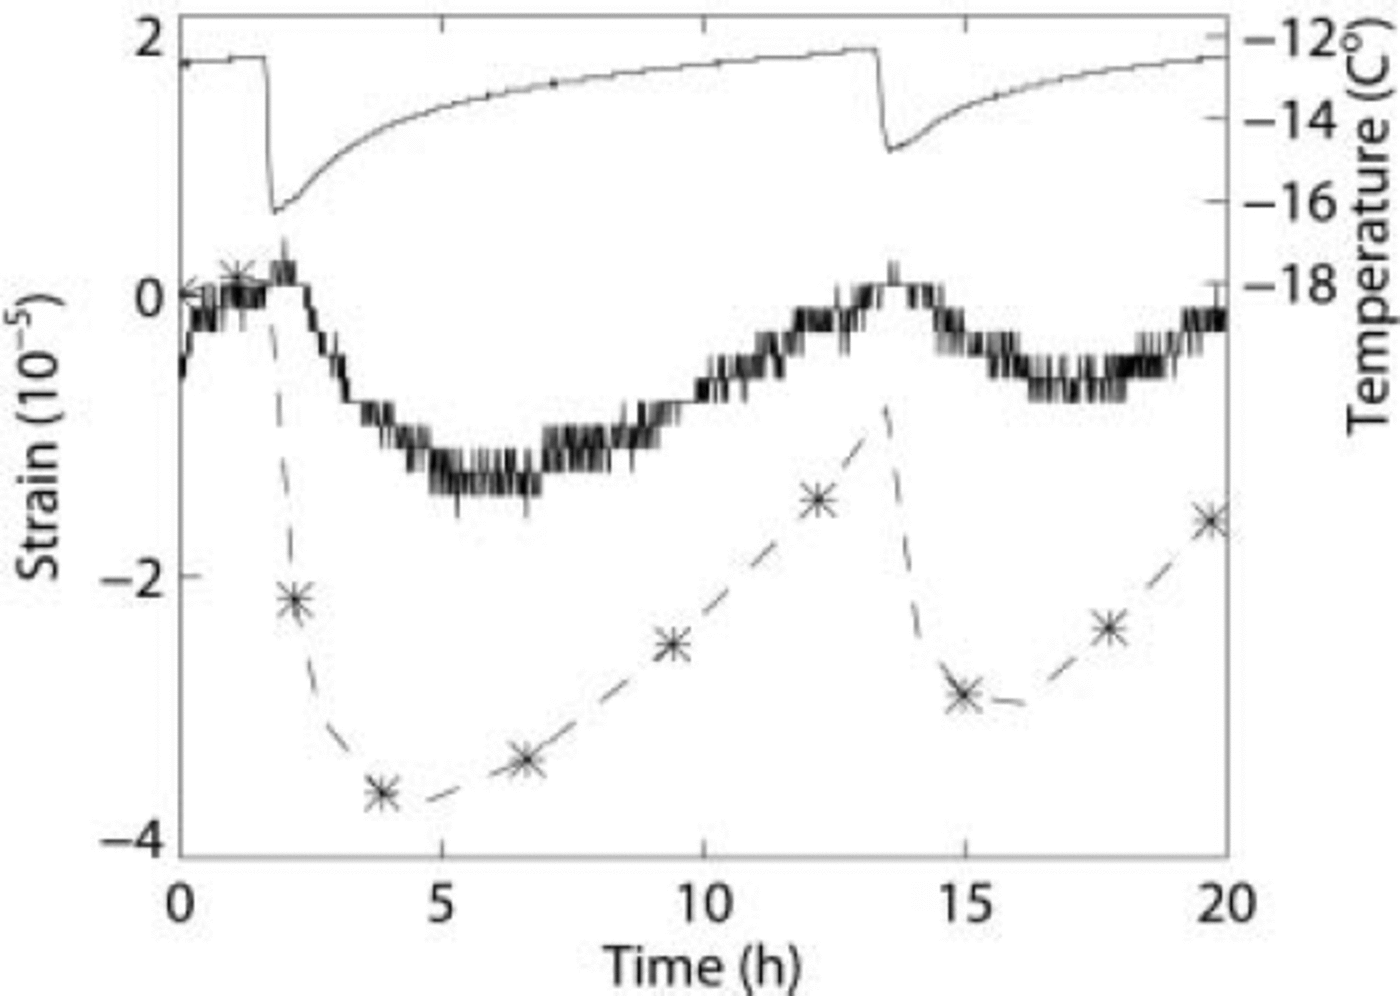
The apparatus was tested in a cold room by measuring the thermal strain of an ice block (1000×500×250 mm) between two poles installed 600mm apart. Because the thermal expansion coefficient of Super Invar (10-6 K-1) is about 2% of that for ice, the influence of thermal stretching of the wire was neglected. To evaluate the measurement result, the thermal strain caused by temperature changes in the cold room was computed with finite-element commercial software ANSYS. The model solves a transient thermomechanical problem in a vertical cross-section along the measurement axis. Figure 2 shows air temperature and the measured and computed strain, taking tensile strain as positive. Although the magnitude of the measured strain is smaller than the model result, the timing of the compression due to the drop in temperature and the subsequent transition from compressive to tensile strain rate were consistent between measured and modelled results. Considering the simplification introduced in the finite-element modelling, arising for example from the model’s two-dimensional nature and simplified boundary conditions, the accuracy of the strainmeter was difficult to assess. It is possible that the instrument did not fully respond to the strain because of its mechanical play. Nevertheless, the test result confirmed the potential of the apparatus to measure changes in strain with a magnitude of 10–5, and we focus more on the timing and the sign of the strain measured in the field rather than its magnitude.
Air temperature in the cold room (top line), and measured (middle line) and computed (bottom line) strain of the ice block. The computational results are indicated by the asterisks, and the dashed line is drawn arbitrarily.
Field Measurements
Study site
Koryto glacier is a temperate valley glacier located on the east coast of Kamchatka peninsula, ranging in altitude between 320 and 1200m (Fig. 3). It is a maritime glacier characterized by large winter accumulation (>7mw.e. near the top) and summer ablation (>7mw.e. near the terminus) (Reference Shiraiwa, Murav’yev, Yamaguchi, Glazirin, Kodama and MatsumotoShiraiwa and others, 1997). During the ablation season, the surface flow speed varies under the influence of meltwater and precipitation, suggesting that basal motion plays an important role in the dynamics of this glacier (Reference Yamaguchi, Naruse, Sugiyama, Matsumoto and Murav’yevYamaguchi and others, 2003).
Map of Koryto glacier showing the locations of the surface strain (KK4) and marginal sliding (BS1) measurements. Contour lines indicate the surface elevation in ma.s.l.

Surface strain measurement
From early August to mid-September 2000, surface strain was measured with wire strainmeters at several locations in the ablation area. For most of the measurement period, it was necessary to reinstall the strainmeters every 2–3 days due to large melting rates reaching 100 mmw.e. d-1. The data presented here were obtained at site KK4 (Fig. 3) from 27 to 30 August with poles installed 1.5 m apart along the flowline. During this period, the measurement was continuous without reinstallation owing to a relatively low
melt rate of 33 mmw.e. d-1, and a lack of precipitation.
Basal sliding measurement
The wire strainmeter was also utilized for the measurement of basal sliding at the glacier margin. Instead of using two poles, one end of the wire was anchored on the side of the glacier in basal ice with an ice screw, and the metal block was balanced with a pivot which was fixed on bedrock (Fig. 1b).
Sliding was measured from late August to mid-September at site BS1 (Fig. 3). We were able to reach a point along the glacier margin where 10–20m thick ice was sliding over bedrock with no underlying sediment. Data from the wire meter were obtained intermittently, as they were interrupted by both melting out of the ice screw and failures of the battery. Although the exact direction of the glacier sliding was not known, the wire was likely not parallel to the ice motion. Displacement measured by the apparatus therefore represents an unknown but likely steady fraction of the three-dimensional movement of the basal ice. However, here we call the rate of the measured displacement simply ‘sliding speed’.
Observation of a moulin at KK4
About 30 m up-glacier from the surface strain measurement site, one of the largest moulins of the glacier collected meltwater produced in the region. Several shafts in a healed crevasse were enlarged by water flow and had developed to a 1–2m wide, 20m long water inlet in summer 2000. A series of inactive moulins were found down-glacier along the flowline with intervals of about 50 m, suggesting that the moulins were formed annually at the same location.
On 28 August at 1930 h, we observed the moulin completely filled with water and overflowing onto the glacier surface for the first time (Fig. 4a). By the next day at 1400 h, water stored in the moulin had already drained (Fig. 4b), but similar events, called ‘overflow’ hereafter, were observed several times in September.
The moulin at KK4 filled with water at 1930 h on 28 August (a), and under normal conditions at 1400 h on 29 August (b). Photographs are taken looking south.

Results
Longitudinal surface strain measured at KK4 is shown in Figure 5. From 27 to 28 August, before the first observation of moulin overflow, the mean tensile strain rate was 1.4 × 10⁻⁵ d–1 which is in good agreement with the value of 2.1 × 10⁻⁵ d–1 determined by repeated theodolite surveys of stakes installed 100 m apart from each other for the period 26 August–10 September. On the afternoon of 28 August, a sudden (compressive) strain reaching –5 × 10⁻⁴ followed by a similar amount of extension was recorded. This incident coincided with the overflow of the moulin. Another strain event took place at noon on 29 August. Although we did not observe that the moulin was filled with water on 29 August, this does not mean an overflow did not occur. Inspections were only made once or twice a day, as we passed by the location.
Surface strain at KK4 obtained with a wire strainmeter. Times of drastic changes in the strain are indicated, and observed conditions of the moulin are described at the top.

On 29 August when the large strain was observed, down-glacier basal sliding showed fluctuations (Fig. 6). Displacement of the basal ice relative to the bedrock at BS1 and its rate (sliding speed) are shown in Figure 6 together with the surface strain and strain rate at KK4. Sliding speed and strain rate were calculated after smoothing the raw displacement and strain data with the kernel regression method (Reference Brockmann, Gasser and HerrmannBrockmann and others, 1993). The sliding speed at BS1 and the strain rate at KK4 are well correlated: lower and higher sliding speeds correspond to compressive and tensile strain rate, respectively. The amplitude of the sliding-speed variations is about 50% of the mean value.
Comparison of sliding at BS1 and strain at KK4 from 1100 to 1800 h on 29 August. (a) Displacement of the basal ice relative to bedrock (dashed line) and sliding speed (solid line). (b) Surface strain (dashed line) and strain rate (solid line).

Discussion
The coincidence of the strain event with the overflow of the moulin on 28 August suggests that extraordinary subglacial hydraulic conditions caused the changes in the ice-flow regime. We propose the following interpretation of the anomalous longitudinal strain variations. When a subglacial conduit constricted, meltwater started to fill the moulin, resulting in a reduction in basal water transport to the lower reaches of the glacier. Due to the changes in water pressure, ice-flow speed increased up-glacier and decreased in the lower glacier, inducing a compressive longitudinal strain rate at KK4 (Fig. 7b). When the conduit regrew, the large amount of water that was stored in the moulin and nearby subglacial drainage system drained down-glacier. Flow speed then increased in the lower reaches and the strain became tensile (Fig. 7c). The above interpretation explains why the strain events started with longitudinal compression and then turned to extension. It also agrees with the observation that lower and higher sliding speeds at BS1 corresponded to compressive and tensile surface strain rates at KK4. For the event on 29 August, it is plausible that the conduit constricted again at 1640 h, and then opened at 2130 h (Fig. 5).
Schematic diagrams of a longitudinal cross-section of the glacier showing subglacial water conditions and ice-flow regimes. (a) Normal conditions. (b) Moulin overflow. (c) Moulin drainage.

It is likely that some of the subglacial drainage conduits closed because of insufficient conduit water pressure in the late ablation season. The timing of the events, which started around noon and ended in the evening, implies that the constriction and regrowth of the conduits were controlled by meltwater supply to the bed. Subglacial conduits became narrower during the night, when water pressure was low. Then the strain events occurred as meltwater supply increased and exceeded the subglacial drainage capacity. The conduits were enlarged toward the evening due to high water flow and subglacial water pressure until the stored water was drained. Hourly discharge measured at the outlet stream (Reference Matsumoto, Naruse, Konya, Yamaguchi, Yamada and Murav’yevMatsumoto and others, 2004) was examined to find a trace of the drainage events, but significant peaks were not observed. Because the drainage of the moulin occurred in the late afternoon, it was presumably obscured by the daily discharge maximum.
The significant response of surface strain suggested that water was stored over an area broad enough to set up a gradient in the sliding field. The length scale over which water is expected to be stored is more than a few times the ice thickness (Reference Kamb and EchelmeyerKamb and Echelmeyer, 1986), which is about 200 m at KK4 (personal communication from Yu. Macheret, 2001). If the same quantity of water were stored for longer periods of time, until the following summer, for example, it would not only affect seasonal flow-speed variations but also would impact the water budget of the glacier. That substantial water was stored within and under Koryto glacier before the ablation season is suggested by other studies. Run-off and ablation measurements in Koryto glacier showed a 9 × 10⁶m3 water deficit from August to September 2000 (Reference Matsumoto, Naruse, Konya, Yamaguchi, Yamada and Murav’yevMatsumoto and others, 2004). Vertical surface movement during the same period was downward over most of the glacier, implying that a large amount of water was stored in basal cavities in the early summer (Reference Yamaguchi, Naruse, Sugiyama, Matsumoto and Murav’yevYamaguchi and others, 2003).
The observed strain events reported here indicated a significant impact of changing subglacial conditions on glacier dynamics. Basal water pressure locally exceeded the ice overburden pressure when the moulin was filled with water, so the ice was considered to be decoupled from the bed. Presumably, discharge of the stored water enhanced basal motion in the lower reach of the glacier by increasing water pressure there. Such processes can be compared to the formation and rapid drainage of a glacier-dammed lake. On Black Rapids Glacier, Alaska, USA, drainage of marginal and supraglacial lakes increased the surface flow speed by up to 400% (Reference Nolan and EchelmeyerNolan and Echelmeyer, 1999) and also caused vertical straining in the ice near the surface (Reference Raymond, Benedict, Harrison, Echelmeyer and SturmRaymond and others, 1995).
Sliding-speed variations at glacier margins may not directly represent the changes in basal motion in the central area. Nevertheless, the correlation found between the sliding speed at BS1 and the strain rate at KK4 implies that the marginal sliding was enhanced when the glacier bed was pressurized by the drainage of water stored up-glacier. A possible effect of such subglacial conditions on sliding at the margin is basal shear stress transfer from the center to the margins. Reduction in the basal traction in the center of the glacier causes increases in the shear stress near the sidewalls, resulting in enhanced sliding at the margins. Reference Glen and LewisGlen and Lewis (1961) measured the movement of ice at the side of Austerdalsbreen, Norway, and found greater sliding speeds during periods of heavy rainfall or high temperature. Although regional conditions such as bedrock irregularities, boulders in basal ice, or melting at the bed should also be considered, the increase in marginal sliding can be understood as a consequence of shear stress transfer to the margins.
Conclusion
The cold-room test of the wire strainmeter and the operation in the field demonstrated its ability to measure short-term flow variations with a time-scale of <1 hour. It is a unique tool for investigation of both glacier dynamics and laboratory ice mechanics with a high temporal resolution.
The strainmeters were used to measure surface strain and marginal sliding of a temperate glacier with a temporal resolution of 1 min. The measurements captured the response of the glacier to the overflow and subsequent draining of a large moulin during the late ablation season. We suggest that subglacial water pressure was non-uniformly distributed during the overflow and the subsequent drainage of the stored water. The observation revealed the influence of short-term local changes in water input on the glacier flow regime, providing insight into the likely effects of glacier outburst floods on glacier dynamics.
Acknowledgements
The authors wish to thank T. Yamada and T. Aoki for leading the campaign on Koryto glacier. Thanks also go to S. Yamaguchi, T. Matsumoto and K. Konya for their help with the field measurements. The wire strainmeters were designed and constructed by K. Shinbori at the workshop of the Institute of Low Temperature Science, Hokkaido University. C.F. Raymond kindly provided information about the design and operation of a wire strainmeter. The manuscript was improved by comments from R.S. Anderson, P. Jansson, G.E. Flowers and U.H. Fischer. This study was funded by the Ministry of Education, Science, Sports and Culture, Japan (No. 11691166).



