

Introduction
Structurally complex forests are extremely rich in biodiversity due to the complex variety of habitats they provide (Khanaposhtani et al. Reference Khanaposhtani, Kaboli, Karami and Etemad2012). The diversity of different taxa in the forests is often associated with the structural and compositional diversity they offer (Komlós et al. Reference Komlós, Botta-Dukát, Bölöni, Aszalós, Veres and Winkler2024). However, human-induced disturbances such as firewood extraction, grazing, logging, expansion of agricultural lands, and other management practices alter the structure of these forested habitats (Chettri et al. Reference Chettri, Deb, Sharma and Jackson2005). Birds, among other animals, are extremely sensitive to small variations in the environment (Chettri et al. Reference Chettri, Deb, Sharma and Jackson2005; Jayapal et al. Reference Jayapal, Qureshi and Chellam2009; Xu et al. Reference Xu, Xie, Qi, Luo and Wang2018) and have thus been used by conservationists as efficient indicators of overall biodiversity, ecosystem health, and sustainable forest management (Rurangwa et al. Reference Rurangwa, Matthews, Niyigaba, Tobias and Whittaker2021; Venier and Pearce Reference Venier and Pearce2005). Thus, studying the response of birds to different habitat structures could indicate the suitability of those areas as good habitats for biodiversity. Further, the ease of detecting and identifying birds, coupled with the comparatively low cost of monitoring them, provides strong support for utilising birds as an indicator taxon (Pereira and Cooper Reference Pereira and Cooper2006).
Stand structure is an important habitat determinant for diverse avian communities (Komlós et al. Reference Komlós, Botta-Dukát, Bölöni, Aszalós, Veres and Winkler2024), and more so in the case of forest birds like woodpeckers with specialised nesting and foraging requirements (Drever et al. Reference Drever, Aitken, Norris and Martin2008; Menon et al. Reference Menon, Sridhar and Shahabuddin2019). Woodpeckers are closely associated with forests and are considered keystone taxa of the forest ecosystem (Drever et al. Reference Drever and Martin2010; Menon and Shahabuddin Reference Menon and Shahabuddin2021). The high affinity of woodpeckers to forests makes them very sensitive to the quality of their habitat, including fine-scale structural variations, making them respond immediately to changes or loss of habitat, as well as the amount of deadwood in the forest (Vergara‐Tabares et al. Reference Vergara-Tabares, Lammertink, Verga, Schaaf and Nori2018). Thus, the presence of highly specialised forest taxa like woodpeckers indicates healthy forest ecosystems and dynamic forested landscapes (Roberge et al. Reference Roberge, Angelstam and Villard2008).
Studies on woodpeckers have found that most large woodpeckers prefer large, tall, and/or dead/decaying trees which are associated with old-growth and unmanaged forests (Kumar et al. Reference Kumar, Shahabuddin and Kumar2014; Lammertink et al. Reference Lammertink, Prawiradilaga, Setiorini, Naing, Duckworth and Menken2009; Roberge et al. Reference Roberge, Angelstam and Villard2008). Thus, a wide range of forest management regimes and forestry operations, as well as subsistence extraction that alter the horizontal structure complexity are bound to have an impact on woodpecker diversity (Bevis and Martin Reference Bevis and Martin2002; Drever and Martin Reference Drever and Martin2010; Garcia-del-Rey et al. Reference Garcia-del-Rey, Fernández-Palacios and Muñoz2009; Kumar et al. Reference Kumar, Shahabuddin and Kumar2011; Lammertink Reference Lammertink2004; Menon et al. Reference Menon, Sridhar and Shahabuddin2019; Mikusiński et al. Reference Mikusiński, Gromadzki and Chylarecki2001; Nikolov Reference Nikolov2009; Styring and Hussin Reference Styring and bin Hussin2004; Styring and Ickes Reference Styring and Ickes2001; Walsh et al. Reference Walsh, Vierling, Strand, Bartowitz and Hudiburg2019). Barring a few studies in Asia (Kumar et al. Reference Kumar, Shahabuddin and Kumar2011; Menon and Shahabuddin Reference Menon and Shahabuddin2021), most studies on woodpecker responses to stand-level characteristics of forests have been carried out in the boreal and hemiboreal regions of North America and Europe (Angelstam and Mikusinski Reference Angelstam and Mikusiński1994; Gunn and Hagan Reference Gunn and Hagan2000; Hammond and Theimer Reference Hammond and Theimer2020; Roberge et al. Reference Roberge, Angelstam and Villard2008; Stachura-Skierczyńska et al. Reference Stachura-Skierczyńska, Tumiel and Skierczyński2009). Further, such studies covering the altitudinal variations in forest types and seasonality are still scarce, with a few exceptions (e.g. Askins Reference Askins1983). This limits the wider applicability of findings. In particular, there is a lack of studies on the habitat requirements of woodpeckers in forested landscapes outside protected areas, which contribute to a large portion of woodpecker distribution range globally (Vergara‐Tabares et al. Reference Vergara-Tabares, Lammertink, Verga, Schaaf and Nori2018).
Woodpecker research in Asia has grown in recent decades but remains limited compared with North America and Europe, despite the region hosting significant species diversity. Mikusiński (Reference Mikusiński2006) indicated that 90% of woodpecker studies from 1985 to 2004 focused on regions with only 17% of global Picidae species, underscoring the research gap in Asia, a global hotspot for woodpecker diversity. A study in Heilongjiang, China, explored the ecological linkage between woodpeckers and fungal communities, analysing four species, i.e. Lesser Spotted Dendrocopos minor, Great Spotted D. major, White-backed D. leucotos, and Grey-headed Picus canus, and found that Ascomycota fungi (91.96% of samples) influenced nest cavity selection, revealing intricate ecological dependencies (Shi et al. Reference Shi, Maqsood, Liu, Yu, Si and Rong2024). In South-East Asia, Lammertink (Reference Lammertink2004) documented an 83% density decline of the Great Slaty Woodpecker Mulleripicus pulverulentus in logged forests of Indonesian Borneo, attributing it to their reliance on large-diameter trees for foraging and nesting in old-growth forests. In South Asia, research is sparse but growing, with studies focusing on ecological roles and habitat preferences. In India, which hosts 32 woodpecker species, with 11 in the Western Ghats and 25 in the Indian Himalayan Region (Grimmett et al. Reference Grimmett, Inskipp and Inskipp2016; Praveen et al. Reference Praveen, Jayapal and Pittie2016), research is concentrated in specific regions. A 1995 study on the ecology of sympatric woodpecker species (Santharam Reference Santharam1995) laid the groundwork for woodpecker research in South Asia. Later, Kumar and Singh (Reference Kumar and Singh2010) developed a playback-based monitoring protocol for woodpeckers in sub-Himalayan forests, later used to assess woodpecker assemblages in natural and managed forests of north-western India (Kumar et al. Reference Kumar, Shahabuddin and Kumar2011, Reference Kumar, Shahabuddin and Kumar2014, Reference Kumar, Shahabuddin and Kumar2020). Menon and Shahabuddin (Reference Menon and Shahabuddin2021) explored woodpeckers as indicators of bird diversity in banj oak Quercus leucotrichophora forests of the Western Himalaya for the first time in India. Currently, detailed ecological studies in South Asia are limited to three species: White-bellied Woodpecker Dryocopus javensis (Santharam Reference Santharam2003), Great Slaty Woodpecker (Kumar and Shahabuddin Reference Kumar and Shahabuddin2012), and Rufous-bellied Woodpecker D. hyperythrus (Baral Reference Baral2023; Shahabuddin et al. Reference Shahabuddin, Menon, Chanda and Goswami2018). However, no significant research exists from north-east India or the Eastern Himalaya, despite these areas harbouring 75% of India’s woodpecker species. Globally, studies like Dorresteijn et al. (Reference Dorresteijn, Hartel, Hanspach, von Wehrden and Fischer2013), suggest that conserving traditional pasturelands with large, scattered trees is vital for woodpeckers, but Asian research remains focused on protected forests, neglecting non-protected landscapes. This regional and thematic research gap underscores the urgent need for comprehensive studies across Asia, particularly in the understudied Eastern Himalaya, to inform conservation strategies for woodpecker assemblages facing habitat loss and fragmentation.
With this outlook, the main objective of the study was to understand the influence of specific stand-level forest characteristics on woodpecker diversity in the non-protected forests of Eastern Himalaya, India. The research questions guiding the study were: (1) What forest characteristics determine woodpecker abundance and species richness in non-protected forests? (2) What effects do seasons have on woodpecker abundance and species richness? (3) How do forest stand variables impact different species in Eastern Himalaya?
Methods
Study area
The study was conducted in Darjeeling, Eastern Himalaya. Darjeeling constitutes an integral part of the Himalaya Biodiversity Hotspot and Eastern Himalaya Endemic Bird Area (Mittermeier et al. Reference Mittermeier, Turner, Larsen, Brooks, Gascon, Zachos and Habel2011). It is an important transboundary landscape, sharing borders with Nepal, and the Indian state of Sikkim. The altitude ranges from 200 m to 3,636 m and is traversed by three major river systems, i.e. Teesta, Rangeet, and Balasun (Figure 1). As the landscape is contiguous with the higher Himalaya in Sikkim, including the prominent Mt Khangchendzonga, it is often referred to as part of the Khangchendzonga landscape (Sharma et al. Reference Sharma, Chettri, Gurung and Shakya2007).
The study area along an elevation gradient showing locations of all transects sampled for woodpeckers and habitat characteristics during the current study in the non-protected forests of Darjeeling, Eastern Himalaya.

Most forests in the Darjeeling Himalaya fall outside the protected area network. These are actively managed by local communities, private companies, and government agencies. The current study covered 12 sites, three sites covering each of the following management regimes: (1) agroforests, which are actively managed and modified by the local communities with whom the ownership of the land lies; (2) tea garden forests, which are managed by private companies who are responsible for the management and harvest in respective tea gardens; (3) managed reserve forests, which are managed and modified by respective government agencies; (4) unmanaged forest stands within reserve forests, which are characterised by native and comparatively mature stands of trees. Further, due to variations in altitude across the study area, these non-protected forests of Darjeeling Himalaya represented different forest types. Therefore, four sites, one covering each management regime, covered each of the three forest types under three elevation bands (Figure 1): (1) tropical forests (200–900 m), where the vegetation is dominated by trees like Shorea robusta, Tectona grandis, Terminalia sp., Schima wallichii, Litsea sp., and Castanopsis indica; (2) subtropical forests (900–1,800 m), where the vegetation is dominated by trees like Exbucklandia populnea, Alnus nepalensis, Castanopsis tribuloides, and Cryptomeria japonica; (3) temperate forests (1,800–2,400 m) where the vegetation is dominated by trees like Quercus pachyphylla, Q. lineata, Rhododendron arboreum, and Q. lamellosa.
At each site, fixed transects that represented different management regimes were established along existing trails. These transects were 2 km long and spaced at least 1 km apart. However, due to the mountainous terrain and human modifications in the landscape, continuous 2-km long transects were not possible in all study sites. Therefore, two 1-km long transects were established, either continuous or separated by 250–500 m. Further to ensure independent results, all transects were roughly linear with no acute-angle turns and were at least 500 m away from the stand edge.
Sampling of woodpeckers
Sampling of woodpeckers was conducted over two years, between December 2021 and December 2023. Transects were sampled on clear days between 06h00 and 11h00 following the fixed-radius point count method (Acharya et al. Reference Acharya, Sanders, Vijayan and Chettri2011; Bibby et al. Reference Bibby, Burgess, Hill and Mustoe2000) to quantify variation in the richness and abundance of picid and non-picid birds. Along each transect, 12 permanent points (separated by 200 m along a 2-km transect) were established. At each point, all birds seen or heard within a 50-m radius for 10 minutes were recorded. A 50-m radius was used to reduce the likelihood of overlooking individuals. Birds detected by vocalisations were included only if the observer judged them to be within a 50-m radius.
To minimise distance estimation errors, observers underwent field calibration exercises before field sampling, using laser rangefinders to practise both visual and auditory distance estimation under similar habitat conditions. During formal data collection, observers used a laser rangefinder to establish the 50-m boundary and identified natural landmarks (e.g. trees, shrubs) to visually approximate this distance in the field, ensuring consistency across all sampling points. During each survey, two observers walked through the selected transects, reached a permanent observation point, and recorded the number of individuals and species identities of all woodpeckers seen or heard within a 50-m radius, using binoculars and a camera where necessary. At least one surveyor remained the same throughout the entirety of the study to avoid surveyor-related biases.
Sampling across sites representing different forest types was carried out on consecutive days during each sampling repeat to minimise the confounding effects of weather variability. As woodpecker detectability can vary seasonally due to changes in vocal activity, breeding behaviour, and foliage density, season was included as a variable in the analyses to account for seasonal variation in detectability.
Sampling was carried out in all four seasons, i.e. winter (December–February), pre-monsoon (March–May), monsoon (June–August) and post-monsoon (September–November). To get a more representative estimate of the composition of the community, each transect was sampled six times per season, each transect was sampled 24 times during the study period, thus reducing the risk of bias due to differential sampling.
Enumeration of habitat characteristics
Habitat assessments were carried out at each of the point count locations along selected transects. Quadrats measuring 20 × 20 m were established using a metre tape and ribbons, at 200-m intervals, within 50 m of the permanent observation point, depending on availability and accessibility. Habitat characteristics were assessed on a predesigned data collection Open Data Kit form using an android device. In each quadrat, data on the species identity of trees, number of trees (live and snags), diameter at breast height (DBH) of each tree (DBH >10 cm), tree height, and canopy cover were collected. The canopy cover was estimated using a concave spherical densiometer. The collected data were used to calculate total basal area, tree density per unit area, mean tree diameter, mean tree height, and tree diameter diversity. The stand basal area for trees was calculated as (DBH)2π/4. Tree diameter diversity (CVdbh) was quantified as the coefficient of variation (CV) (Mensah et al. Reference Mensah, Noulèkoun, Salako, Lokossou, Akouété and Seifert2023), which was calculated as

where CV= coefficient of variation, σ = standard deviation of DBH or height, and

= mean DBH.
Woodpecker densities
Woodpecker abundance was inferred from the number of encounters per point along selected transects. Further, the abundance records were converted into woodpecker densities at each point for different seasons. Density was calculated as the number of woodpeckers recorded per unit area irrespective of the species richness, following Reynolds et al. (Reference Reynolds, Scott and Nussbaum1980). Density was estimated as
 $$ D=n\times 1000000/\pi {r}^2C $$
where, D = woodpecker density (numbers per km2), n = total number of woodpeckers observed in all counts within the specific radius, r (specific radius is the radial distance in metres from the observer, within which the observer recorded woodpeckers), and C = total number of counts conducted. Further, the densities of each species at each point were also determined using the same formula.
Model development
A generalised linear mixed-effect model (GLMM) was used to understand the influence of habitat characteristics on woodpecker abundance and species richness. GLMM was selected over other models as the current study had a multi-level design that involved surveying each site multiple times (Kumar et al. Reference Kumar, Shahabuddin and Kumar2014). GLMMs help in accounting for temporal and spatial replication as random effects thereby addressing the concerns of pseudoreplication (Bolker et al. Reference Bolker, Brooks, Clark, Geange, Poulsen and Stevens2009). Since the study involved sampling the same transects multiple times across different seasons, the GLMM was constructed with transect ID, management regime, and elevation as random effects. Raw counts were used as the response variable in the abundance models, while number of species per transect was used in the species richness model. For each bird species, the maximum count across the six visits per season was used as the raw count (Elsen et al. Reference Elsen, Ramesh and Wilcove2018). Using the maximum count reduces the influence of temporary absences, variable detectability, and non-detections during individual sampling repeats, and helps provide a more robust and conservative estimate of a species’ seasonal presence and relative abundance at a site. It also mitigates the risk of underestimating a species’ site occupancy by focusing on the highest observed presence, especially for species that are intermittently active, cryptic or influenced by weather conditions or fluctuations in activity levels across repeats.
The predictor variables (habitat measurements) selected for the model included 11 variables representing forest characteristics expected to influence woodpecker diversity (see Supplementary material Table S1). The season was added as a categorical variable. Pearson’s correlation test was used to determine the correlation among predictor variables. If a strong correlation was found between two variables (R 2 ≥0.6), one of the variables with a lesser or no influence on the model was removed from further analysis (Sagarese et al. Reference Sagarese, Frisk, Cerrato, Sosebee, Musick and Rago2014; Wintle et al. Reference Wintle, Elith and Potts2005). Following this, six stand-level variables, namely the mean species richness of trees per quadrat sampled, mean tree height, mean canopy cover, stand basal area per unit area, tree density per unit area, snag density per unit area, and tree diameter diversity per transect, were finalised as predictor variables (Table S1). The predictor variables were centred and scaled to have zero means and unit standard deviations to make the variables mutually comparable. To perform GLMM, the “glmer” function of the package lme4 in R Studio was used with Poisson distribution with log-link function, which is preferred for count data (Elsen et al. Reference Elsen, Ramesh and Wilcove2018; Pinheiro et al. Reference Pinheiro, Bates, DebRoy and Sarkar2012).
Subsequently, a model assigned with evidence of the lowest information loss (Kullback–Leibler information loss index) was selected from a set of different competing models (Burnham and Anderson Reference Burnham and Anderson2002). Model selection was based on Akaike’s information criterion corrected for small sample size (AICc), used to identify models with minimum K-L information loss (Burnham and Anderson Reference Burnham and Anderson2002). This was done with the help of function “dredge” in the R package MuMIN (Barton Reference Barton2016). This allows more potential predictors to be explored and automatically removes variables based on the user-defined criterion for exclusion. Here, delta AIC >2 was considered ideal for excluding irrelevant models (Taylor and Knight Reference Taylor and Knight2003). The statistical significance of a variable in the top model was tested by noting the change in the deviance explained. Delta AIC (ΔAICc) was used to evaluate each model relative to the top model, and those with ΔAICc <2 units were considered equally important (Burnham and Anderson Reference Burnham and Anderson2002). Therefore, the best model was chosen from the combination of variables included in the top models with ΔAICc <2.
Results
Woodpecker community composition
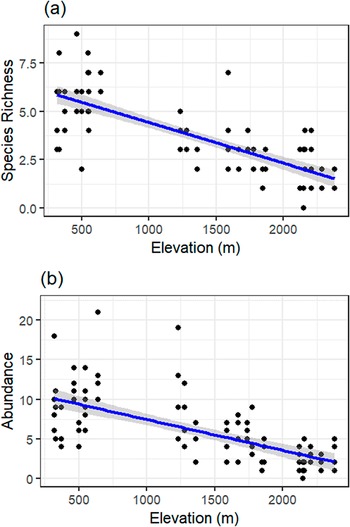
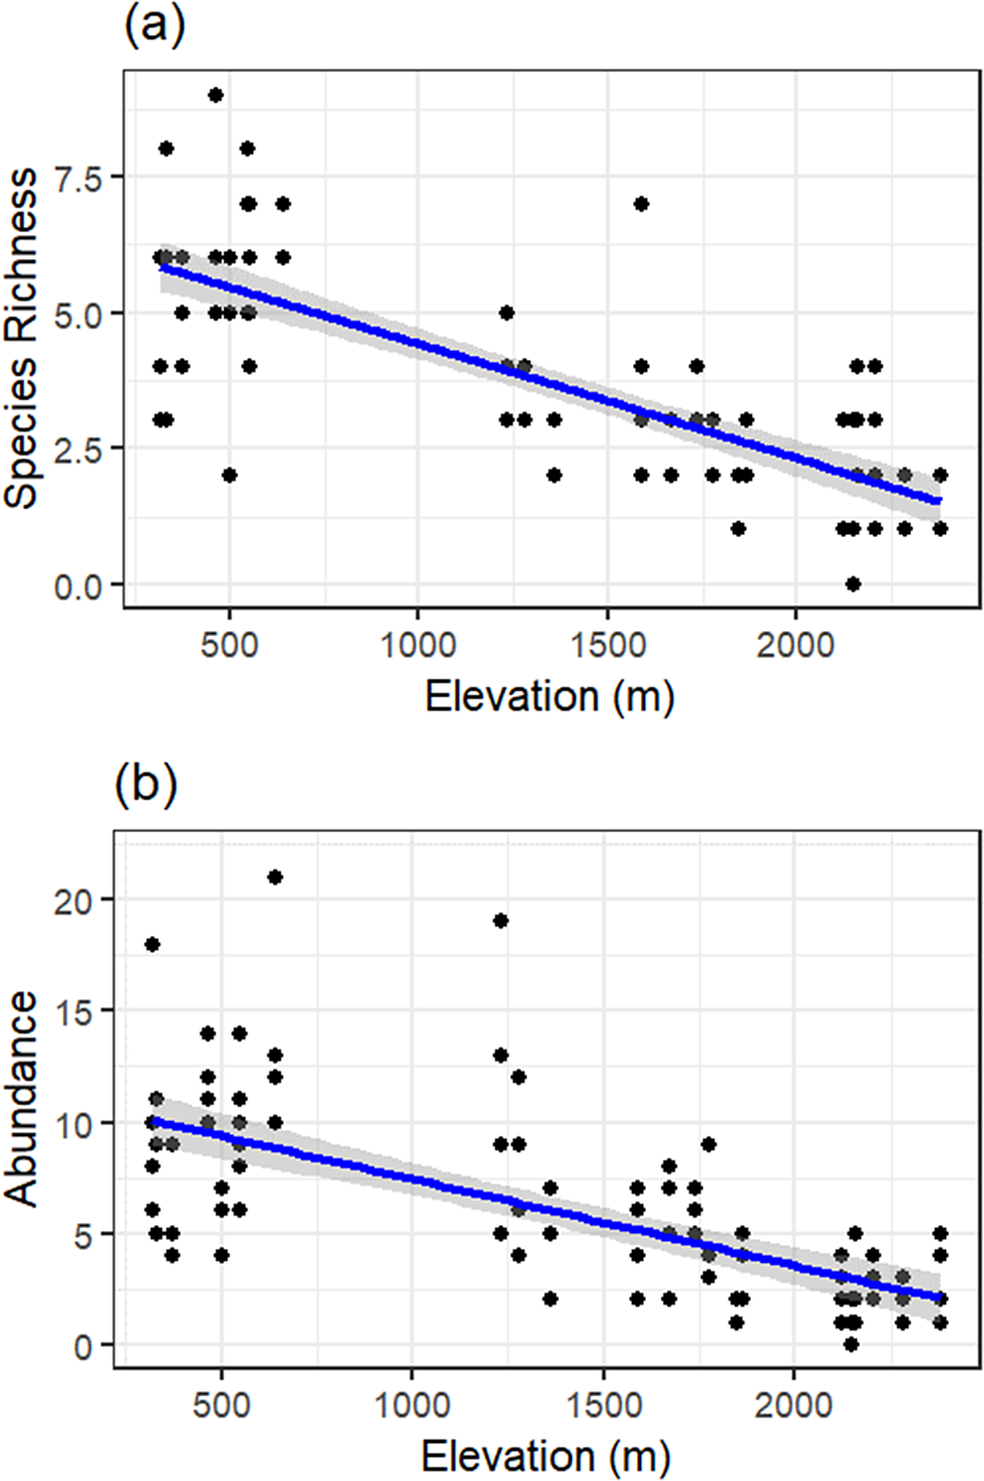
A total of 1,721 individuals of 13 species of woodpeckers were detected in 1,025 of the 3,456 point counts over 24 transects (1-km long transects) distributed across three forest types. Both species richness and abundance of woodpeckers showed strong negative and linear trends with increasing elevations (Figure 2).
Relationship between elevation and (a) species richness and (b) total abundance of birds across sampling sites. Linear regression analyses show a significant negative association in both cases. For species richness (a), the regression equation is Y = 6.53–0.0021X with R² = 0.59, P <0.0001. For abundance (b), the regression equation is Y = 11.34–0.0039X with R² = 0.43, P <0.0001. Shaded bands indicate 95% confidence intervals around the fitted lines.
Six species constituted approximately 93% of the total woodpecker community in the study area and included Greater Yellownape Chrysophlegma flavinucha (39.16%), Grey-headed Woodpecker (18.83%), Grey-capped Pygmy Woodpecker Yungipicus canicapillus (12.14%), Bay Woodpecker Blythipicus pyrrhotis (11.10%), Greater Flameback Chrysocolaptes guttacristatus (6.16%), and Rufous Woodpecker Micropternus brachyurus (5.58%). Of these, three species, Greater Yellownape, Bay Woodpecker, and Grey-headed Woodpecker, were common in all four forest types, while Greater Flamebacks were restricted to tropical forests. Greater Yellownape was the most abundant species across all forest management regimes and forest types, followed by the Grey-headed Woodpecker (Table S2).
Woodpecker densities across individual transects varied from 8 km-2 to 157.5 km-2, while densities of individual species in the study area ranged from 0.1 km-2 for White-browed Piculet Sasia ochracea to 24.6 km-2 for Greater Yellownape. The mean woodpecker density per transect was 62.4 ± 4.8 (± SE) km-2 (Table S3).
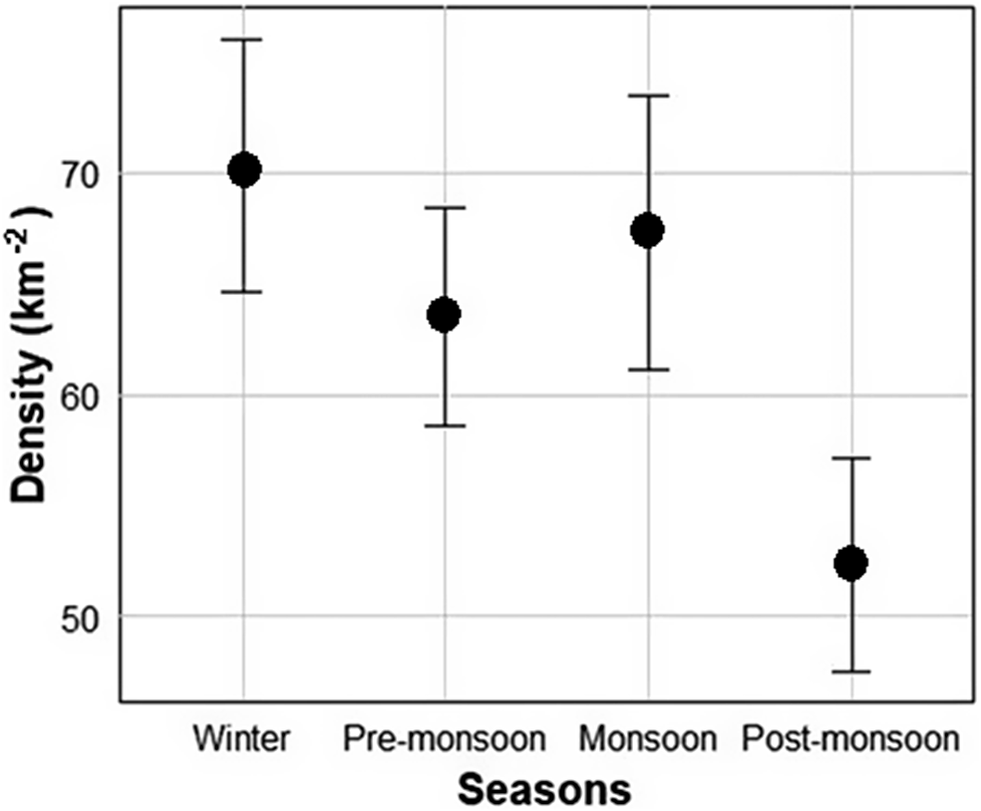
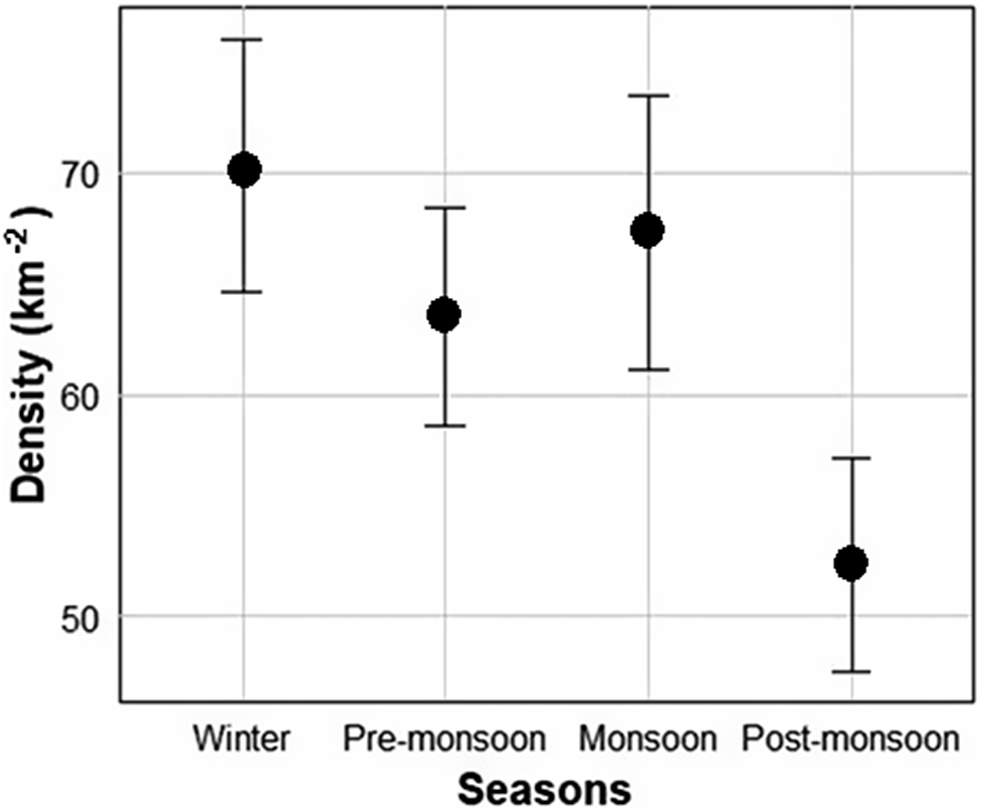
Significant differences in densities were observed across individual transects, which also exhibited marked inter-seasonal differences. Although the study area appeared to have a stable woodpecker abundance across seasons, it did vary significantly across seasons, with winter having the highest woodpecker density, followed by monsoon, pre-monsoon, and post-monsoon seasons (Figure 3).
Woodpecker densities (km-2) across seasons in the non-protected forests of Darjeeling, Eastern Himalaya. Dots represent the mean density (km-2) and bars represent corresponding standard errors.
Forest characteristics
Forest characteristics differed across individual transects (Table S4). Significant differences in most forest characteristics were observed across forest management regimes, however, these differences were not significant across forest types (Table S5). Among the 12 variables tested, mean tree diameter, stand basal area, and density of tall trees were significantly lower in agroforests than in other management regimes. Similarly, tea garden forests had the lowest canopy cover, while the density of intermediate-sized trees was significantly higher. Temperate forests in the study area had significantly higher mean species richness (per transect) and tree diameter diversity, compared with other forest types (Tables S4 and S5).
Forest characteristics and seasonal effects influencing overall woodpecker abundance and species richness
Candidate GLMMs were compared for overall woodpecker abundance as a function of habitat variables and season, and as a result, one top model was selected based on ΔAICc values (ΔAICc <2). All the selected predictor variables, except the species richness of trees, contributed to the model. The GLMM reveals that basal area, snag density, tree density, seasons, and basal area–season interaction influence woodpecker abundance (Table 1). Specifically, among forest characteristics, higher snag density was positively associated with higher abundance, while higher basal area, tree density, and diameter diversity were negatively associated (Figure 4 and Table S6). Seasonal effects show that abundance increases during the winter season. The GLMM further shows that woodpecker abundance increases in sites with the greater basal area during the post-monsoon season, but this was not significant (at a 5% level of significance). Random effects indicate variability primarily across different transects, with negligible variation due to elevation and management. However, random effects contributed little to the overall model variance and were thus negligible compared with the main effects.
Parsimonious generalised linear mixed-effects models (GLMMs) for total abundance and species richness of woodpeckers in the non-protected forests of Darjeeling, Eastern Himalaya, representing the most influencing predictor variables based on ΔAICc <2. AIC = Akaike’s information criterion; AICc = Akaike’s information criterion corrected for small sample size; BIC = Bayesian Information Criterion

Effects of forest structural attributes and their seasonal interactions on woodpecker (a) abundance and (b) species richness in human-modified, non-protected forests of the Eastern Himalaya. Only predictors with significant (P <0.05) or marginally significant (0.05≤ P <0.1) effects in the generalised linear mixed models (GLMMs) are shown. Bars represent model estimates and error bars indicate ± SE. Asterisks denote the level of statistical significance (P <0.05, ** P <0.01, *** P <0.001, P <0.1). Negative estimates indicate a negative association with the response variable, while positive estimates indicate a positive association. Seasonal interaction effects are shown relative to the reference level (monsoon).
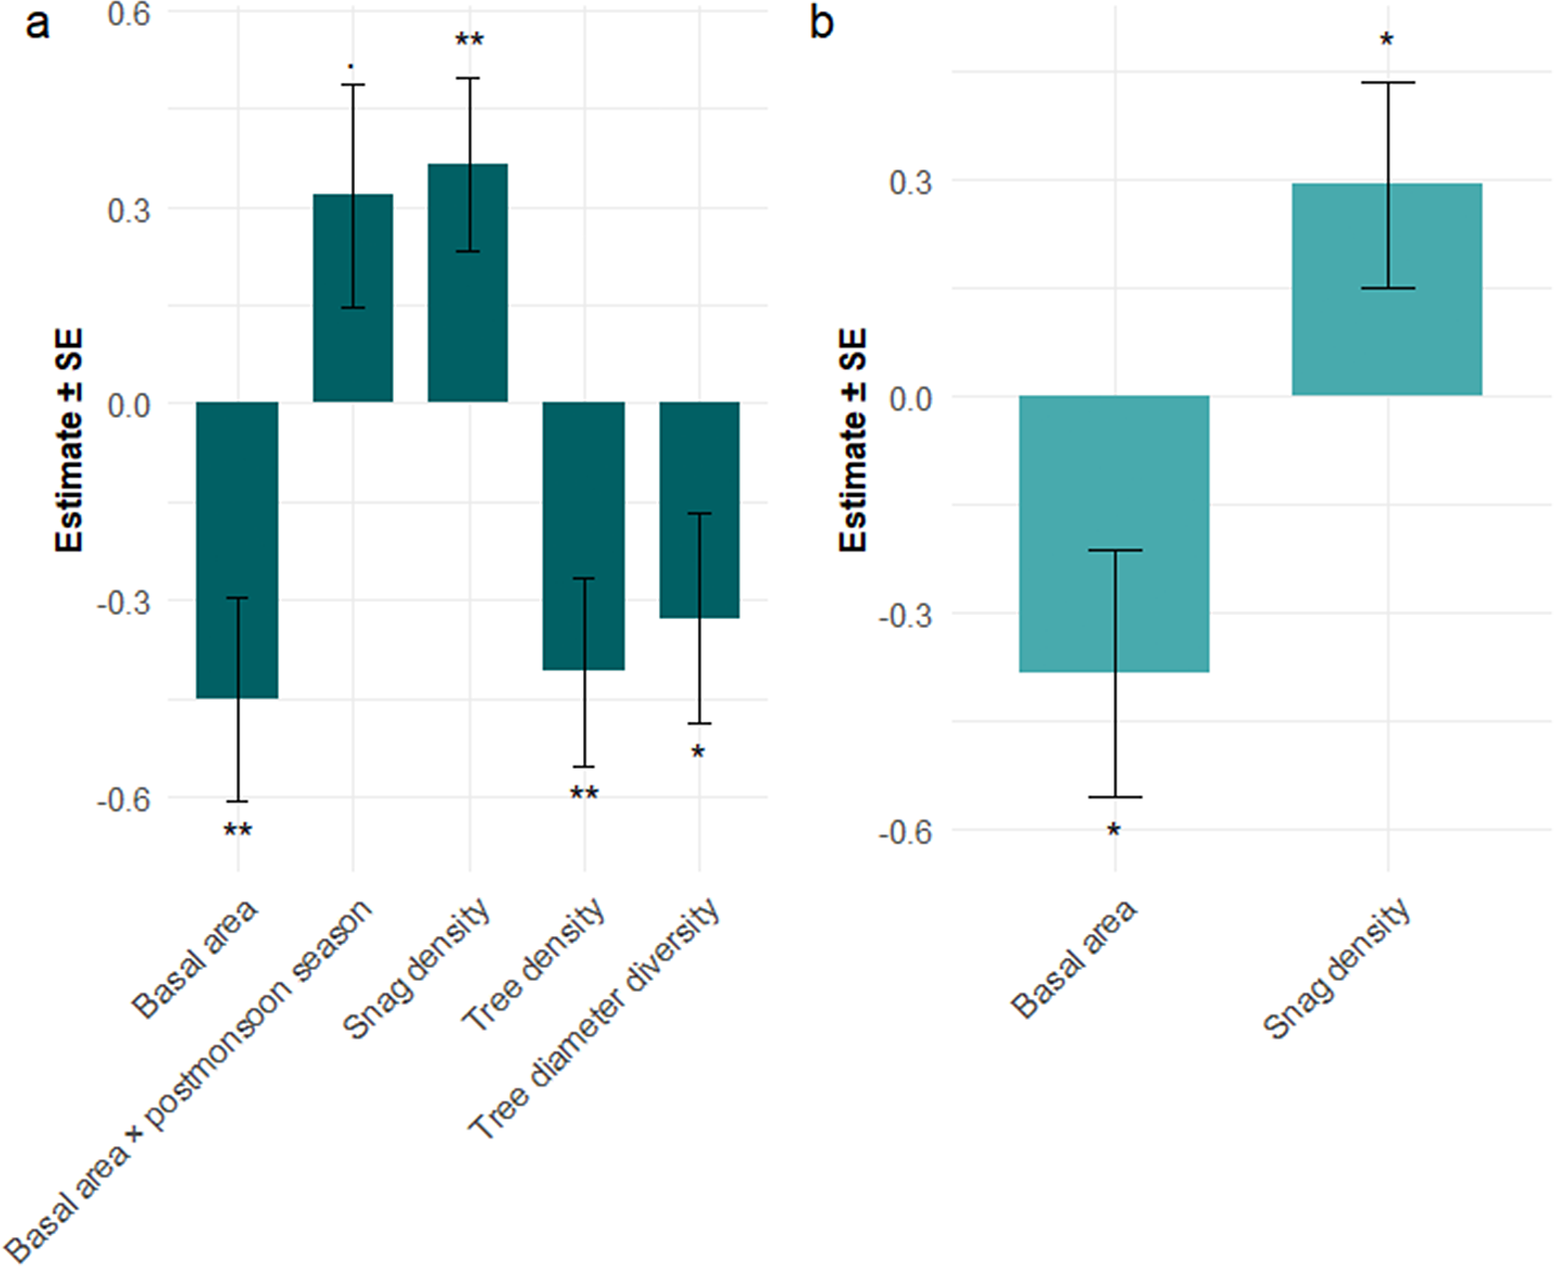
Similarly, out of all candidate models for woodpecker species richness, one was found to be the most parsimonious model, based on ΔAICc values (ΔAICc <2). Two variables, basal area and snag density, were included in the top models. The GLMM indicated that both basal area and snag density were significant predictors of woodpecker species richness. Snag density was positively associated with species richness, while basal area had a significant negative association (P <0.05). Among other predictors, higher tree diameter diversity showed a marginal increase in species richness during the winter (P <0.1). The random effects showed some variability across different transects but were found to be unimportant compared with the main effects.
Forest characteristics and seasonal effects influencing individual woodpecker species
The GLMM analysis on the abundance of six woodpecker species revealed that most predictor variables (except species richness of trees and season) significantly influenced at least one species (Table S7). However, no two species were influenced by the same set of variables. The abundance of Greater Yellownape was positively influenced by snag density and showed a significant negative association with basal area, tree density, and diameter density. Grey-headed Woodpeckers and Rufous Woodpeckers also significantly avoided higher stand basal area. In the same way, Grey-capped Pygmy Woodpeckers appeared to avoid sites with higher basal area marginally (P <0.1), yet their abundance significantly increased in sites with higher snag density during the winter months. Bay Woodpeckers were significantly and positively influenced by canopy cover; further, during the post-monsoon season, diameter diversity also significantly affected (positively) their abundance. The numbers of Greater Flamebacks in the study area were not significantly impacted by any of the predictor variables used in the GLMM; however, their numbers did appear to increase marginally during the post-monsoon season (P < 0.1).
Detections of other species such as Darjeeling Woodpecker Dendrocopos darjellensis, Pale-headed Woodpecker Gecinulus grantia, Crimson-breasted Woodpecker Dryobates cathpharius, Fulvous-breasted Woodpecker Dendrocopos macei, Lesser Yellownape Picus chlorolophus, White-browed Piculet, and Speckled Piculet Picumnus innominatus were insufficient to conduct any modelling analysis.
Discussion
This work represents the first study that addresses the influence of forest characteristics and seasonality on woodpecker species richness and diversity in the human-modified non-protected forests of the Eastern Himalaya. Studying and conserving woodpecker assemblages in the Himalaya is critical because these birds serve as keystone species, significantly shaping forest ecosystems by creating tree cavities that provide nesting and roosting sites for numerous secondary cavity-nesting species, such as barbets, nuthatches, flycatchers, and small mammals, thereby enhancing biodiversity (Cockle et al. Reference Cockle, Martin and Wesołowski2011). Their foraging activities involve excavating dead wood and controlling insect populations, such as wood-boring beetles, contributing to forest health and nutrient cycling, and maintaining ecological balance (Drever et al. Reference Drever, Aitken, Norris and Martin2008). In the Himalayan context, where forests face threats from logging and habitat fragmentation, woodpeckers act as indicators of forest quality, with their presence and diversity reflecting the availability of large trees and snags essential for a healthy ecosystem (Kumar et al. Reference Kumar, Shahabuddin and Kumar2014; Menon and Shahabuddin Reference Menon and Shahabuddin2021; Pradhan et al. Reference Pradhan, Khaling and Saha2025). Conserving woodpecker populations ensures the persistence of these ecological functions, supporting broader avian and forest biodiversity in this globally significant region.
The study was conducted across diverse habitats, forest management regimes, and elevation-based forest types in the landscape, covering all seasons, with an assumption that forest characteristics are the primary habitat determinants of woodpeckers, a keystone taxon of the forest ecosystem (Drever et al. Reference Drever, Aitken, Norris and Martin2008; Hammond and Theimer Reference Hammond and Theimer2020; Kumar et al. Reference Kumar, Shahabuddin and Kumar2014; Menon and Shahabuddin Reference Menon and Shahabuddin2021). Results indicated that seasonal effects play a minimal role in influencing woodpecker abundance and species richness in the study area, thus, different stand-level characteristics are primary drivers of woodpecker diversity in the non-protected forests of the Eastern Himalaya.
Factors affecting overall woodpecker diversity and abundance
Although inter-seasonal differences were not evident in species richness during the study, differences in overall woodpecker abundance were observed. This suggests that woodpeckers in the non-protected forests may disperse into adjoining protected areas in search of resources for foraging and breeding, depending on the specific seasonal needs. While post-breeding juvenile recruitment may contribute to increased abundance during certain periods, the observed patterns are more likely linked to resource availability, as seasonal movements across forest types in woodpeckers have been reported to be driven by resource constraints in north-western India (Kumar et al. Reference Kumar, Shahabuddin and Kumar2011). During the post-monsoon season, there was a significant decrease in the overall woodpecker population, with a drop of over 20% compared with the previous season. This might be due to breeding woodpeckers moving away from their breeding territories during the post-monsoon season, causing a redistribution of woodpeckers across the landscape. This also suggests that the non-protected managed forested habitats in the landscape host breeding populations of woodpeckers, thus highlighting their importance.
Inter-seasonal fluctuations in woodpecker abundance were also observed across individual sites (transects) studied, suggesting the role of individual sites in supporting foraging or nesting woodpeckers as per their needs in the particular season. Although inter-seasonal differences were observed, the GLMM suggested that these were not significant determinants of woodpecker abundance and species richness. Thus, seasonality has little to no influence over overall woodpecker diversity in the study area. Similar findings have been reported from elsewhere (e.g. Askins Reference Askins1983; Travis et al. Reference Travis1977; Wiktander et al. Reference Wiktander, Olsson and Nilsson2001).
This study explicitly accounted for seasonal variation in woodpecker detectability, which may fluctuate due to changes in vocal activity, breeding behaviour, and vegetation structure, such as increased foliage during the monsoon, reducing visibility. Season was incorporated as a categorical variable in the GLMMs to statistically control for these seasonal shifts in detectability. Additionally, using maximum seasonal counts per species per transect helped to minimise the impact of temporary absences or lower detectability during individual visits, offering a more stable estimate of species presence and relative abundance. This approach was particularly relevant given the observed seasonal differences in overall abundance, with notably higher woodpecker densities recorded during winter. These patterns likely reflect both true seasonal use of habitat and heightened detectability. However, if seasonal effects on detectability were dominant, one would expect consistently higher detection rates during the breeding season (pre-monsoon) when they are more vocal and active, which was not observed (Kumar et al. Reference Kumar, Shahabuddin and Kumar2011). Moreover, as multiple cues were used for detection, including direct sightings, calls, and tapping sounds, the likelihood of seasonal variation in detectability being a strong confounding factor is reduced (Kumar et al. Reference Kumar, Shahabuddin and Kumar2011). Although there might still be some bias in detection, particularly for less vocal and cryptic species, the methods and data analysis used improved the reliability of seasonal and habitat-related patterns in woodpecker diversity reported here.
Individual sites that hosted high densities of woodpeckers during the breeding (pre-monsoon) seasons were characterised by higher snag density, and vice versa. This highlights the role of snags in maintaining stable woodpecker populations in the landscapes. Their role in influencing woodpecker abundance was further confirmed in the results of the GLMM, which showed a significant positive relationship between woodpecker abundance with snag density in the study area. Snags are an important source of fuelwood for the local communities residing in the landscape, hence their density was much lower than that reported from the forests of Western Himalaya (Kumar et al. Reference Kumar, Shahabuddin and Kumar2014). This highlights the importance of engaging with local communities and forest managers to raise awareness of the ecological role of snags in maintaining biodiversity, while also co-developing practical alternatives that support both conservation and local livelihoods. For example, promoting rural bird tourism – especially in a region like Darjeeling, Eastern Himalaya, which is already an important tourist destination – can provide an incentive to preserve forest features such as snags that are critical for woodpeckers and other cavity-nesting birds. Such community-based approaches can align conservation goals with economic benefits, increasing the likelihood of long-term success. Similar approaches were initiated in parallel during the study period, though their outcomes remain to be evaluated (Pradhan Reference Pradhan2024; Pradhan and Khaling Reference Pradhan and Khaling2024). The role of snags as a determinant of woodpecker diversity has been well documented across the globe (e.g. Fröhlich and Ciach Reference Fröhlich and Ciach2020; Kumar et al. Reference Kumar, Shahabuddin and Kumar2014; Matsuoka and Takada Reference Matsuoka and Takada1999; Styring and bin Hussin Reference Styring and bin Hussin2004).
The basal area and snag density were the key forest characteristics determining the species richness of woodpeckers in the study area. While in addition to snag density and basal area, tree density and tree diameter diversity also influenced woodpecker abundance in the study area. However, basal area, tree density, and tree diameter diversity negatively influenced woodpecker abundance in the study area. Thus, woodpeckers preferred scattered, smaller, and more uniformly sized trees in the human-modified forested habitats of the Eastern Himalaya. This result is contrary to other studies conducted elsewhere in protected areas, where woodpeckers have been found to prefer large trees, denser forest patches, and diverse tree sizes (Basile et al. Reference Basile, Asbeck, Pacioni, Mikusiński and Storch2020; Bergner et al. Reference Bergner, Sunnergren, Yeşilbudak, Erdem and Jansson2016; Gunn et al. Reference Gunn and Hagan2000; Kumar et al. Reference Kumar, Shahabuddin and Kumar2014; Menon and Shahabuddin Reference Menon and Shahabuddin2021).
In the study area, the basal area was highly correlated with the density of large trees (DBH ≥60 cm), tree diameter, and tree height, suggesting that forest patches with high basal area, were dominated by large and tall trees. Although, woodpeckers are often associated with large tree diameters, a meta-analysis on habitat utilisation of cavity-nesting birds suggested that relatively larger trees would be selected for nesting only if the mean diameter in the forest is low (Gutzat and Dormann Reference Gutzat and Dormann2018). Further, the importance of DBH of selected cavity trees decreases with the increasing diameter of available trees (Seavy et al. Reference Seavy, Burnett and Taille2012). Similarly, in terms of foraging needs, woodpeckers in the study area have been found to forage on trees of particular sizes, with the most abundant woodpeckers preferring forage tree sizes ranging from approximately 40 cm to 50 cm (Pradhan et al. Reference Pradhan, Khaling and Saha2025). This may have also driven the woodpeckers to avoid sites with greater tree diameters and thus, higher basal area. Further, smaller trees are often more susceptible to environmental stressors such as disease, pests, competition, and physical damage from wind or frost (Chao et al. Reference Chao, Phillips, Monteagudo, Torres‐Lezama and Vásquez Martínez2009; Das et al. Reference Das, Stephenson and Davis2016; Waring Reference Waring1987). This susceptibility can lead to higher mortality rates and consequently, a higher turnover rate, eventually leading to more dead, decaying or sick trees, thus providing for the foraging and nesting resources that support higher woodpecker densities. This was particularly observed in the tea garden forests of the study area, where numerous small to mid-sized shade trees of Albizia were dead or sick.
Importantly, sites with lower tree density and more uniform tree sizes often create edge habitats (transition zones between different ecosystems), which can support higher species richness due to the increased availability of resources and habitat types (Götmark and Thorell Reference Götmark and Thorell2003). Further, sites with smaller, more uniformly sized trees and lower density might be indicative of anthropogenic disturbances like selective logging (Lobo et al. Reference Lobo, Barrantes, Castillo, Quesada, Maldonado and Fuchs2007), which create a mosaic of different habitat patches with diverse stages of tree growth that support a diverse insect population (Woodcock et al. Reference Woodcock, Edwards, Newton, Vun Khen, Bottrell and Hamer2013), thus, in turn, supporting greater woodpecker diversity, although there is some published evidence to the contrary (Lammertink Reference Lammertink2004; Styring and Ickes Reference Styring and Ickes2001).
Thus, the current study highlights that smaller, scattered, and evenly sized trees are important in determining woodpecker abundance and species richness in the context of non-protected managed forests of Eastern Himalaya with low snag density. However, these forest characteristics may only support high woodpecker diversity if the forest patches are contiguous with mature forest stands with large and tall trees and a high density of snags, as have been reported from the Western Himalaya (Kumar et al. Reference Kumar, Shahabuddin and Kumar2011). This calls for the need to investigate habitat determinants of woodpeckers in other sites with diverse habitat types at a landscape scale.
Factors affecting the abundance of individual species
Factors affecting abundance differed across individual species. The Greater Yellownape, Grey-headed Woodpecker, and Rufous Woodpecker, along with the Grey-capped Woodpecker to some extent, showed a clear preference for foraging in stands with lower basal areas or lower densities of large trees (DBH ≥60 cm). The Greater Yellownape and Rufous Woodpeckers were identified as generalists in the study area, whereas the Grey-headed Woodpecker and Grey-capped Pygmy Woodpecker were significantly associated with managed forests, and avoided undisturbed forest stands (in unmanaged reserve forests) (Pradhan et al. Reference Pradhan, Khaling and Saha2025). This may be due to their particular foraging or nesting needs, which are better met in slightly disturbed or secondary forests where mid-sized trees are more abundant. Their preferred foraging tree sizes range between 40 cm and 50 cm (Pradhan et al. Reference Pradhan, Khaling and Saha2025), suggesting that their foraging habits influence their avoidance of stands dominated by larger trees. These species-specific preferences can be contrasted with general trends observed in other regions, where large trees are often crucial for the overall abundance of woodpeckers (Menon and Shahabuddin Reference Menon and Shahabuddin2021), especially for larger species (Kumar and Shahabuddin Reference Kumar and Shahabuddin2012; Lammertink et al. Reference Lammertink, Prawiradilaga, Setiorini, Naing, Duckworth and Menken2009). However, the current study highlights that the local context and specific ecological requirements of woodpecker species in a given area can lead to different habitat preferences. Thus, there is a need to assess the nuanced preferences of specific woodpecker species in multiple sites before generalising their habitat preferences.
The density of snags affected the abundance of Greater Yellownape, one of the larger species, as well as the Grey-capped Pygmy Woodpecker, the smallest, although for the latter, snags appeared more important during the winter season. This suggests that these woodpeckers depended on snags for foraging purposes in the non-protected forests of Darjeeling (Pradhan et al. Reference Pradhan, Khaling and Saha2025). Similar findings have also been reported from the Western Himalaya (Kumar et al. Reference Kumar, Shahabuddin and Kumar2014); however, contrary to the current study, Grey-capped Pygmy Woodpeckers have been reported to prefer high snag density during the pre-monsoon season (breeding season). This difference may partly be due to the substantially higher snag densities reported in the Western Himalaya, which offered a wider range of availability for selection; the generally lower snag densities in the current study landscape may have masked the selection patterns that would be evident under higher availability. Further dependence of two of the most abundant woodpeckers on snags adds to the evidence of deadwood removal as an important threat to woodpecker conservation across the globe (Basile et al. Reference Basile, Krištín, Mikusiński, Thorn, Żmihorski and Pasinelli2023).
The Greater Yellownape was also negatively associated with tree density, suggesting that the species avoided dense forest stands and preferred open spaces. This may be explained by the fact that it is a generalist preferring edge habitats that offer a variety of forest conditions to exploit. On the other hand, the Bay Woodpecker had a strong positive relationship with high tree density during the post-monsoon season, while also having a strong association with stands with high canopy cover. This suggests that they have highly specialised habitat requirements, thus the preservation of denser forest stands is crucial for their conservation in human-modified landscapes.
Conclusions
The study demonstrated the community-level responses to managed forest stands that are driven by the differential responses of individual species to various forest characteristics. Further, the study assessed the impact of seasons and seasonal interactions with individual forest characteristics on woodpecker diversity. Results showed total basal area and snag density to be the most important habitat determinants of woodpecker diversity in the non-protected managed forests of Darjeeling, Eastern Himalaya. The negative influence of basal area on overall woodpecker diversity and the abundance of some abundant species contradicts the findings of earlier studies. The study does not conform with the general trend of large woodpeckers preferring large and tall trees and greater basal area, even though four large-sized species made up 75% of the total woodpecker assemblage in the region. Thus, these findings emphasise the importance of considering species-specific, region-specific, and management-specific habitat requirements when formulating conservation strategies. Furthermore, the negative influence of tree density and diameter diversity on overall woodpecker abundance suggests that the presence of sites with scattered mid-sized trees interspersed within a continuum of protected and non-protected forests contributes to the conservation of woodpeckers in human-modified forested habitats. Lastly, this study adds to the growing evidence that snags play a critical role in woodpecker conservation and in maintaining broader avian biodiversity. Collaborative initiatives with local forest managers and communities to explore ways of retaining higher snag densities in non-protected forests may help initiate a participatory approach to conservation. Such initiatives, including community-led bird tourism efforts tested during this study, may offer viable incentives for retaining key forest structures like snags. However, it is important to acknowledge the practical challenges of such recommendations, particularly in landscapes where people depend heavily on forest resources for fuelwood and timber. Understanding the socio-economic drivers behind low snag densities, such as safety concerns, fuel demand or management practices, can help to identify context-specific, realistic strategies. These might include leaving selected non-hazardous snags standing, identifying alternative fuel sources or integrating biodiversity goals into local forest-use plans. Participatory approaches that recognise both conservation needs and local livelihoods are more likely to be sustainable in the long term.
Supplementary material
The supplementary material for this article can be found at http://doi.org/10.1017/S0959270925100166.
Acknowledgements
We express our sincere appreciation for the invaluable contributions of Amir Ansari, Mingma Tamang, Benoy Thapa, Aahan Lepcha, Daman Pradhan, and Yumlam Banjamin Bida during fieldwork. We also deeply thank Prof. Bhoj Kumar Acharya and Prof. Joydeep Bhattacharjee for graciously providing the reference letters essential for funding acquisition. Their unwavering support has played a pivotal role in advancing our research. We are grateful to the Directorate of Forests, Government of West Bengal, for granting us the necessary permit (Memo No.: 1559/WL/4R-23(Pt-II)/2022) to conduct our work in the forests of Darjeeling. Lastly, we extend our heartfelt thanks to the local communities across all field sites in Darjeeling for the cooperation and assistance received. This paper is an outcome of projects funded by the Oriental Bird Club under the Conservation Fund Small Grant (Grant No. P1437) and the Rufford Foundation under Rufford Small Grants (Application ID: 38843-1) awarded to AP. Author contributions: AP: funding acquisition, project administration, conceptualisation, research design, methodology, data collection, data curation, formal analysis, investigation, writing – original draft; SK: supervision, project administration, conceptualisation, research design, methodology, writing – review and editing; GKS: supervision, writing – review and editing. The data sets used and/or analysed during the current study will be made available from the corresponding author upon reasonable request.