




No CrossRef data available.
Article contents
Transmission, infectivity and survival of Diplostomum spathaceum cercariae
Published online by Cambridge University Press: 09 October 2003
Abstract
The transmission dynamics of the cercariae of Diplostomum spathaceum were investigated under laboratory conditions using cercariae collected from naturally infected Lymnaea stagnalis. Cercariae were kept in a constant temperature of 20 °C and the survival and infectivity to naïve young rainbow trout recorded at 3-h intervals until few cercariae were alive. Mortality initially remained constant but increased rapidly after 20 h. While a model of constant mortality fitted the survival data, an age-dependent model provided a better fit and implied that cercariae tended to carry similar quantities of resources and once these were exhausted the cercariae died. Cercarial infectivity also showed an age-dependent pattern although infectivity tended (P=0·09) to increase with age over the first 6 h of life and then fall. The per capita transmission rate of cercariae was investigated by experimentally infecting rainbow trout under standardized conditions, first with an increasing cercarial density and second, by keeping density constant but increasing numbers of cercariae. The per capita transmission rate was frequency dependent and averaged 0·341/h (±0·036).
Keywords
Information
- Type
- Research Article
- Information
- Copyright
- © 2003 Cambridge University Press
INTRODUCTION
Fitness is a function of the recruitment rate of offspring into the breeding population (Williams, 1966) and is often estimated indirectly by measuring important vital rates such as life-time reproductive success (Clutton-Brock, 1988). Most parasitic helminths inhabit a nutrient-rich environment; they are not limited by available resources and have a reproductive rate several orders of magnitude greater than their free-living counterparts although this is invariably counter-balanced by extremely high mortality of the infective stages (Dobson, Hudson & Lyles, 1992). As such, parasite fitness is better estimated from a term like the basic reproductive ratio (R0) that considers both production and transmission of infective stages and the loss of parasites through mortality and parasite-induced mortality of the host (Anderson & May, 1991; Hudson et al. 2002). In parasites with complex life-cycles, the estimation of R0 involves the multiplication and transmission of parasites through a series of intermediate hosts, and to understand the transmission dynamics between each stage we need to estimate both the survival of free-living stages, and the rate of transmission. In this paper we focus on the digenean eye fluke, Diplostomum spathaceum, and the transmission process between the 2 intermediate hosts, the freshwater snail (Lymnaea stagnalis) and the rainbow trout (Oncorhynchus mykiss). We examined patterns of mortality and infectivity in relation to age of the free-living stages and how the transmission rate varies with the density of the infective stages.
In a recent paper, Fenton & Hudson (2002) pointed out that since the contact rate between infective stages and susceptible hosts is variable in time and space then parasites should not necessarily allocate resources between their infective stages in an equal way but in a manner that allows at least a proportion to be actively host seeking when a potential host is in the vicinity. This is a form of ‘bet hedging’ that seeks to increase the total period that infective stages are active by having some infective stages active while others are quiescent. By desynchronizing activity among individuals, the parasite may in this manner maximize R0. Digenean parasites produce large numbers of non-feeding and motile cercariae that disperse within the water column and seek out the fish host. Cercariae are dependent on non-renewable energy resources, usually in the form of glycogen that they use to for maintenance and subsequently infect the fish (Erasmus, 1958; Smyth & Halton, 1983; Tielens, 1997). When these reserves are depleted the cercariae die so the parasite should allocate resources between cercariae in a manner that will maximize the probability of infection. In this respect there is a trade-off between survival and infectivity; individuals that use energy for movement will not survive for long and will have insufficient resources to subsequently infect a host whereas a sessile individual will survive longer but fail to contact a host. The parasites could use one of several alternative strategies. Firstly they could allocate resources at random between the infective stages so the infective stages live for variable periods of time, in which case mortality of cercariae will be constant and numbers and infectivity will decline exponentially. The second strategy would be to allocate resources equally between cercariae, in which case mortality will be highly age dependent and numbers and infectivity will remain high and then fall dramatically at a specific age. Finally, there may be a skewed allocation of resources with many individuals dying at a young age, and some living for extremely long periods but remaining infective. The first aim of this study was to explore mortality and infectivity of cercariae in relation to age and determine the strategy employed by D. spathaceum.
To obtain an understanding of the dynamics of a host–parasite system, probably the most critical parameter that needs to be estimated is the transmission coefficient, β (Anderson & May, 1978; McCallum, Barlow & Hone, 2001). For most macroparasite systems it is reasonable to suppose that the transmission rate is a simple positive function of density of the infective stages. We assume that hosts move around at random with respect to the infective stages and can be modelled in terms of density dependent or pseudo-mass action (McCallum et al. 2001). An alternative view is that hosts do not move around at random but remain within a set home range such that infection rate is dependent not on density alone but on the frequency that the host encounters infective stages within their home range, and this can be modelled as frequency dependent or true mass action. However, there is also an increasing recognition that hosts may actively avoid infective stages of macroparasites, either because they are associated with faeces or the hosts are aware of the infection process and take avoidance behaviour (Folstad et al. 1991; Hart, 1994, 1997; Hutchings et al. 1998; Altizer, Oberhauser & Brower, 2000; Wilson et al. 2002). In this case transmission rate could fall with the total number of infective stages. Hence, the pattern of transmission can be evaluated by simply examining the relationship between transmission rate and density and, when density is constant, number of infective stages. In this study we estimated the transmission rate and the per capita transmission rate of D. spathaceum to test between these hypotheses by undertaking replicated infection trials at a range of parasite densities and then maintaining density constant while we manipulated total number.
MATERIALS AND METHODS
Diplostomum spathaceum
The digenean eye fluke Diplostomum spathaceum is a prevalent parasite in many fresh and brackish water fish species in Finland (Valtonen & Gibson, 1997). The life-cycle includes several host species starting with the definitive avian host, where sexual reproduction takes place. Parasite eggs pass into water with the bird faeces, develop into free-living miracidia that infect the first intermediate host, Lymnaea stagnalis. Asexual reproduction occurs within the snail leading to the production of free-living cercariae that penetrate the gills and skin of the fish and migrate to the eye where they develop into metacercariae (Stables & Chappell, 1986; Whyte, Secombes & Chappell, 1991; Buchmann & Bresciani, 1997; McKeown & Irwin, 1997). The metacercariae induce cataracts, and are generally assumed to increase the vulnerability of the fish to the definitive avian hosts.
Cercarial survival
Lymnaea stagnalis snails were collected from earth ponds of a commercial fish farm in Central Finland in June 2000 and infected snails kept at 7 °C to prevent cercariae production until the experiment started. Each of 33 Lymnaea stagnalis were placed in a glass jar containing 2 dl of water at 20 °C and allowed to produce cercariae for 1·5 h. The combined density of cercariae in the suspension was estimated by counting twenty, 1 ml samples under a microscope. The suspension was then divided into 4 containers containing equal amounts (1·5 l) of suspension and approximately 1·32×105 cercariae (87·85±4·42 (S.E.) cercariae/ml of suspension). The division was made to ensure that individual containers had no effect on the results. Containers were maintained in constant light at 20 °C. Survival of cercariae was estimated by counting the number alive in 10×1 ml subsamples from each container every 3 h.
Age-dependent mortality of the cercariae was estimated as the log difference in the total number of larvae between time-intervals (Nt)

and described empirically by the following model

The constants a and b were estimated from a non-linear least squares technique in the statistical package STATISTICA using the Quasi-Newton method and the process modelled by

Cercarial infectivity
After each counting, 20 randomly chosen, similarly aged (5 months), naïve rainbow trout (mean length±S.E.=82·8 mm±0·7, mean weight±S.E.=5·0 g±0·1) were exposed to infective cercariae by placing each one for 30 min in 0·5 l of water and 250 cercariae. Containers were provided with continuous aeration and water temperature maintained at 20 °C. Fish were infected randomly using suspension from all 4 containers. Since 1·5 h was required to produce a sufficient amount of cercariae from the snails, the initial level of infectivity could not be recorded. However, change in the infectivity during this time was considered insignificant and the first exposure was thus made using cercariae of maximum 3 h old. Exposure was then repeated every 3 h using new fish each time until insufficient cercariae were alive. After infection, the fish were kept in larger aquaria for 24 h, sufficient time for the parasites to migrate to the lens. Fish were then euthanased with an overdose of MS-222 and both eyes dissected and the parasites counted.
Infectivity was modelled according to Anderson & Whitfield (1975) where the number of cercariae infecting, at any specific age of cercariae (It), was a function of γ, the rate of infectivity per unit of time per unit of activity and α the rate of activity per unit of time per unit of stored glycogen:

where A0 is the relative activity when cercariae emerge and set at 100%. G0 and g are arbitrary units of initial glycogen amount and rate of use per unit of time respectively. However, glycogen was not estimated directly in this work. The parameter values of I0, γ, αG0 and g were estimated from the data using a non-linear least squares technique as described previously.
Transmission pattern
To examine if the per capita transmission rate, β, was constant or varied with the number of infective stages, cercariae less than 3 h old were obtained from infected snails and introduced into one of 5 equal sized tanks containing 2·415 l of water and a single rainbow trout (mean length±S.E.=144·5 mm±1·6, mean weight±S.E.=33·0 g±1·0). The numbers of cercariae introduced into each tank were 50, 100, 200, 350 or 500 and these corresponded to densities of 21/l, 41/l, 83/l, 145/l and 207/l, respectively. Each density treatment was replicated 5 times and the use of tanks was randomized. The infection time was 30 min, after which the fish were removed and then maintained in larger holding tanks for a minimum of 24 h so that cercariae could reach the eye. A period of 30 min was selected as being long enough for infection of all fish to occur but short enough so cercarial mortality was minimal and fish did not acquire immunity from this infection. Fish were euthanased and metacercariae counted as described previously.
To examine if transmission rate varied with the number of infective stages, a constant density of 83 cercariae/l was selected correspondingly to the previous experiment, but the volume was manipulated such that the total number increased. Six different tank sizes with 5 replicates of each and an equal water depth of 7 cm were set up. Volumes of the tanks ranged from 0·64 to 244 l. Individual fish were introduced and the same infection process applied. Water temperature was maintained at 20 °C in both experiments.
Assuming that cercarial mortality was insignificant (as verified in the first experiments) and there was no immediate development of resistance we estimated the value of beta (β) as:

where P0 is the initial number of cercariae in the water, Pt is the number of cercariae remaining (taken as the number of metacercariae recovered subtracted from P0) and t is the infection time 0·5 h. Note that this calculation assumes no mortality in cercariae migrating through the host, which is probably not correct but discussed in more detail later.
RESULTS
Cercarial survival
The number of living cercariae decreased to almost zero in all four containers by 36 h of age and the pattern did not vary between containers (GLM, F=2·087, D.F.=3, P>0·1). In general, the numbers remained relatively constant for the first 20 h and then decreased sharply (Fig. 1). Larval mortality was not constant during the cercarial life-span (Fig. 2A, r2=0·943). While an exponential model, that assumed larval mortality was constant, fitted the data (r2=0·828), an age-dependent model provided a better fit (r2=0·973) and captured the shape of the relationship (Fig. 2B).

Fig. 1. Observed number of Diplostomum spathaceum cercariae alive in 10×1 ml samples counted every 3 h from each of the 4 containers held under standardized conditions. The size of each dot represents the number of observations.

Fig. 2. Observed mortality (A) and survival (B) of Diplostomum spathaceum cercariae held in 4 containers under standardized conditions. Mortality of cercariae was modelled according to an empirical age-dependent model μt=aexp(bt), where a=0·033 and b=0·118. Survival was modelled according to Nt=N0exp[a/b−a/bexp(bt)], where a=0·007 and b=0·132.
Cercarial infectivity
Exposure and infection of fish continued at 3 h intervals until the cercariae were 27 h old, after which time there were insufficient cercariae alive to maintain a density of 250 cercariae/fish. A total of 11 fish out of 180, died between infection and dissection and were excluded from the analysis. Infectivity tended to increase between 3 and 6 h of age although this was not statistically significant at the 5% level (t-test; t=−1·72, D.F.=1, P=0·09). After 12 h, the infectivity declined in an age-dependent manner (Fig. 3). Overall, the equation (4) provided a relatively good fit to these data (Fig. 3, r2=0·666).

Fig. 3. Infectivity of Diplostomum spathaceum cercariae estimated as the number of metacercariae reaching the eye of a rainbow trout exposed to 250 cercariae for 30 min under standardized conditions every 3 h. The infectivity was modelled according to Anderson & Whitfield (1975): It=I0+γt[A0−(αG0)/g] – (γαG0)/g2[1−exp(gt)], where I0=1·670, γ=0·005, αG0=−0·135 and g=0·127.
Transmission process
One fish died in these experiments between the infection and dissection and was removed from the analysis. A General linear model with negative binomial errors was used to evaluate the effect of density and number of infective stages on the patterns of transmission. Number of metacercariae/fish increased with cercarial density (Fig. 4A, F4,20=85·8, P<0·001) and with the total number of infective stages (Fig. 4B, F5,23=52·9, P<0·001). Transmission rate per cercaria did not vary with density of infective stages (Fig. 4C), but decreased significantly with the increasing number of infective stages in the tank (Fig. 4D, F5,23=47·91, P<0·001). The data in Fig. 4C and 4D on the per capita transmission provide evidence that the transmission is essentially frequency dependent with a mean rate of 0·341/h (±0·036).

Fig. 4. Total number of Diplostomum spathaceum metacercariae per fish with (A) density of cercariae and (B) total number of cercariae, and the per capita transmission rate of the parasite with (C) density of cercariae and (D) total number of cercariae. The fitted lines are: (A) y=ax+b, where a=0·127 and b=3·790, (B) y=alog(x)+b, where a=27·111 and b=36·351, (D) y=axb, where a=13·306 and b=−0·744.
DISCUSSION
There are two fundamental components to the estimate of basic reproductive ratio R0, these are the survival and the infectivity of the infective stages. In parasite–host systems, such as the trematode–fish system studied here, these two features are frequently linked through a trade-off between the allocation of the glycogen resources to these two activities. This paper examined the infection dynamics of D. spathaceum by considering whether the survival and infectivity of the cercariae were age-dependent or constant and then how the transmission rate varied in relation to density and number of cercariae. Survival was age-dependent showing constant mortality until the cercariae were about 20 h old (at 20 °C) after which the death rate rapidly increased. Infectivity did fall at higher ages although there was also a tendency (P=0·09) for infectivity to increase over the initial time-periods. The infection model by Anderson & Whitfield (1975) provided a relatively good fit to these data and indicated an age-dependent pattern of infection. The loss of infectivity after 12 h, and before the reduction in survival, implied that cercariae that penetrated after 12 h had depleted their resources to a level where there were insufficient resources for subsequent migration through the host tissues and establishment in the eye. We did not estimate these resources directly and assumed these were glycogen following the earlier work by Anderson & Whitfield (1975).
Previous studies on other digenean parasites have found that the mortality of cercariae is age-dependent rather than constant (Anderson & Whitfield, 1975; McCarthy, 1999). In D. spathaceum there have been studies that have examined the percentage mortality but such studies did not consider if this mortality was constant or age-dependent (Lyholt & Buchmann, 1996). However, when we extracted these data from this paper we found that at the lower temperature levels of 4 °C and 10 °C the mortality was age-dependent and showed a similar pattern to that observed in this study, but since our studies were undertaken at a higher temperature of 20 °C the age at which mortality increased was younger than recorded at the lower temperatures. A decrease in cercarial life-expectancy with temperature has been recorded in other digenean species (Evans, 1985; Pechenik & Fried, 1995; McCarthy, 1999). The general finding that cercariae mortality is age dependent indicates that glycogen allocation between cercariae is relatively constant and implies that if there is ‘bet hedging’ in this species it probably does not occur through the allocation of glycogen. In some respects this may be surprising since the contact between fish and infective stages is likely to be highly aggregated in both time and space as a consequence of fish shoaling behaviour (Fenton & Hudson, 2002). However, the ‘bet hedging’ may not operate at the scale of the glycogen allocation to the cercariae but at the larger scale of patterns of diurnal and seasonal shedding and this will form the basis of a future paper.
While estimating the transmission parameter β, we made the assumption that there was no cercarial mortality. The previous section provides evidence to suppose this was fair for the free-living stages but we have no evidence that there was no cercarial mortality between penetration and establishment in the eye. We clearly recognize that this is an over-simplification of the process since the parasite is known to evoke an immune response in fish, which provides protection against further infections by killing the infective stages before establishment (see Chappell, Hardie & Secombes (1994) for review). The fish we used in the experiment carried a low but natural level of infection for fish of this age and may have exhibited some partial immunity. As such, the estimate of the transmission coefficient provided here should be considered a minimum although this partial immunity would not have altered the relationships between transmission and either density or number of cercariae.
The data from the treatment trials showed that transmission rate to the fish increased with both density and total population size, when density was held constant, such that the transmission rate per cercariae remained constant with density but fell with number. This is consistent with the assumption that transmission can be modelled as ‘true mass action’ otherwise known as frequency-dependent transmission and may reflect the passive nature of host finding of D. spathaceum cercariae (Höglund, 1995; Haas et al. 2002). There have been a series of studies that have examined how the transmission coefficient varied with both density and number of infective individuals but most of these have focused on microparasite systems (Knell, Begon & Thompson, 1996, 1998; Dwyer, Elkinton & Buonaccorsi, 1997). In addition to this paper, a rare exception is the study by J. Fairbairn et al. (unpublished data) who examined the transmission coefficient of the entomopathogenic nematode Steinernema feltiae and found that β varied with the scale of the study and tended to be frequency dependent at the small scale of individuals interactions but could be considered as density dependent at the higher scale. This may well be true for the fish parasites examined here but to demonstrate this would require further experiments that would consider a wider variation in scale and host density.
In summary, transmission was effectively frequency dependent and can be modelled with simple mass-action terms (Anderson & May, 1978, 1991; Dobson & Hudson, 1992; McCallum, 2000). There is some evidence to suppose that fish may become more exposed in larger volumes of water and the scale at which this operates requires further work.
We are very grateful to Otto Seppälä for assistance Hanna Kokko for statistical advice, and Andy Fenton, Jonathan Fairbairn, Hamish McCallum and Rachel Norman for their stimulating and very helpful comments on frequency and density dependent transmission. Two anonymous referees also gave valuable comments on the manuscript. The study was conducted at Konnevesi Research Station, and was financed by Biological Interactions graduate school for A. K. and SUNARE research programme of The Academy of Finland.
References
REFERENCES
ALTIZER, S. M.,
OBERHAUSER, K. S. &
BROWER, L. P. (2000).
Associations between host migration and the prevalence of a protozoan parasite in natural populations of adult monarch butterflies. Ecological Entomology
25, 125–139.CrossRefGoogle Scholar
ANDERSON, R. M. &
MAY, R. M. (1978).
Regulation and stability of host–parasite population interactions. I Regulatory processes. Journal of Animal Ecology
47, 219–249.Google Scholar
ANDERSON, R. M. &
MAY, R. M. (1991). Infectious Diseases of Humans: Dynamics and Control. Oxford University Press, Oxford.
ANDERSON, R. M. &
WHITFIELD, P. J.
(1975).
Survival characteristics of the free-living cercarial population of the ectoparasitic digenean Transversotrema patialensis (Soparker, 1924).
Parasitology
70, 295–310.CrossRefGoogle Scholar
BUCHMANN, K. &
BRESCIANI, J.
(1997).
Parasitic infections in pond-reared rainbow trout Oncorhynchus mykiss in Denmark.
Diseases of Aquatic Organisms
28, 125–138.CrossRefGoogle Scholar
CHAPPELL, L. H.,
HARDIE, L. J. &
SECOMBES, C. J.
(1994).
Diplostomiasis: the disease and host–parasite interactions. In
Parasitic Diseases of Fish
(ed. Pike, A. W. &
Lewis, J. W.),
pp. 59–86.
Samara Publishing Limited, Dyfed.
CLUTTON-BROCK, T. H.
(1988).
Reproductive Success. Studies of Individual Variation in Contrasting Breeding Systems. The University of Chicago Press, Chicago.
DOBSON, A. P. &
HUDSON, P. J.
(1992).
Regulation and stability of a free-living host-parasite system: Trichostrongylus tenuis in red grouse. II. Population models. Journal of Animal Ecology
61, 487–498.Google Scholar
DOBSON, A. P.,
HUDSON, P. J. &
LYLES, A. M. (1992). Macroparasites: worms and others. In
Natural Enemies. The Population Biology of Predators, Parasites and Diseases
(ed. Crawley, M. J.).
Blackwell Scientific Publications, Oxford.CrossRef
DWYER, G.,
ELKINTON, J. S. &
BUONACCORSI, J. P.
(1997).
Host heterogeneity in susceptibility and disease dynamics: tests of a mathematical model.
American Naturalist
150, 685–707.CrossRefGoogle Scholar
ERASMUS, D. A.
(1958).
Studies on the morphology, biology and development of a strigeid cercaria (Cercaria X Baylis 1930).
Parasitology
48, 312–335.CrossRefGoogle Scholar
EVANS, N. A.
(1985).
The influence of environmental temperature upon transmission of the cercariae of Echinostoma liei (Digenea: Echinostomatidae).
Parasitology
90, 269–275.CrossRefGoogle Scholar
FENTON, A. &
HUDSON, P. J.
(2002).
Optimal infection strategies: should macroparasites hedge their bets?
Oikos
96, 92–101.Google Scholar
FOLSTAD, I.,
NILSSEN, A. C.,
HALVORSEN, O. &
ANDERSEN, J. (1991).
Parasite avoidance – the cause of post-calving migrations in reindeer. Canadian Journal of Zoology
69, 2423–2429.CrossRefGoogle Scholar
HAAS, W.,
STIEGELER, P.,
KEATING, A.,
KULLMANN, B.,
RABENAU, H.,
SCHÖNAMSGRUBER, E. &
HABERL, B. (2002).
Diplostomum spathaceum cercariae respond to a unique profile of cues during recognition of their fish host. International Journal for Parasitology
32, 1145–1154.CrossRefGoogle Scholar
HART, B. L. (1994).
Behavioral defence against parasites – interaction with parasite invasiveness. Parasitology
109 (Suppl.),
S139–S151.Google Scholar
HART, B. L.
(1997).
Behavioural defence. In
Host-Parasite Evolution: General Principles and Avian Models
(
ed. Clayton, D. H. &
Moore, J.),
pp. 59–77. Oxford University Press,
Oxford.
HÖGLUND, J.
(1995).
Experiments on second intermediate fish host related cercarial transmission of the eyefluke (Diplostomum spathaceum) into rainbow trout (Oncorhynchus mykiss).
Folia Parasitologica
42, 49–53.Google Scholar
HUDSON, P. J.,
RIZZOLI, A.,
GRENFELL, B. T.,
HEESTERBEEK, H. &
DOBSON, A. P.
(2002).
The Ecology of Wildlife Diseases. Oxford University Press,
Oxford.
HUTCHINGS, M. R.,
KYRIAZAKIS, I.,
ANDERSON, D. H.,
GORDON, I. J. &
COOP, R. L.
(1998).
Behavioural strategies used by parasitized and non-parasitized sheep to avoid ingestion of gastro-intestinal nematodes associated with faeces.
Animal Science
67, 97–106.CrossRefGoogle Scholar
KNELL, R. J.,
BEGON, M. &
THOMPSON, D. J.
(1996).
Transmission dynamics of Bacillus thuringiensis infecting Plodia interpunctella: a test of the mass action assumption with an insect pathogen. Proceedings of the Royal Society of London, B
263, 75–81.CrossRefGoogle Scholar
KNELL, R. J.,
BEGON, M. &
THOMPSON, D. J. (1998).
Transmission of Plodia interpunctella granulosis virus does not conform to the mass action model. Journal of Animal Ecology
67, 592–599.CrossRefGoogle Scholar
LYHOLT, H. C. K. &
BUCHMANN, K.
(1996).
Diplostomum spathaceum: effects of temperature and light on cercarial shedding and infection of rainbow trout. Diseases of Aquatic Organisms
25, 169–173.CrossRefGoogle Scholar
McCALLUM, H.
(2000).
Population Parameters: Estimation for Ecological Models.
Blackwell Science, Oxford.
McCALLUM, H.,
BARLOW, N. &
HONE, J.
(2001).
How should pathogen transmission be modelled?
Trends in Ecology and Evolution
16, 295–300.Google Scholar
McCARTHY, A. M.
(1999).
The influence of temperature on the survival and infectivity of the cercariae of Echinoparyphium recurvatum (Digenea: Echinostomatidae).
Parasitology
118, 383–388.CrossRefGoogle Scholar
McKEOWN, C. A. &
IRWIN, S. W. B.
(1997).
Accumulation of Diplostomum spp. (Digenea: Diplostomatidae) metacercariae in the eyes of 0+ and 1+ roach (Rutilus rutilus).
International Journal for Parasitology
27, 377–380.Google Scholar
PECHENIK, J. A. &
FRIED, B.
(1995).
Effect of temperature on survival and infectivity of Echinostoma trivolis cercariae: a test of the energy limitation hypothesis.
Parasitology
111, 373–378.CrossRefGoogle Scholar
SMYTH, J. D. &
HALTON, D. W.
(1983).
The Physiology of Trematodes. Cambridge University Press, Cambridge.
STABLES, J. N. &
CHAPPELL, L. H.
(1986).
The epidemiology of diplostomiasis in farmed rainbow trout from Northeast Scotland.
Parasitology
92, 699–710.CrossRefGoogle Scholar
TIELENS, A. G. M.
(1997).
Biochemistry of Trematodes. In
Advances in Trematode Biology
(ed. Fried, B. &
Graczyk, T. K.),
pp. 309–343.
CRC Press,
New York.
VALTONEN, E. T. &
GIBSON, D. I.
(1997).
Aspects of the biology of diplostomid metacercarial (Digenea) populations occurring in fishes in different localities of northern Finland. Annales Zoologici Fennici
34, 47–59.Google Scholar
WHYTE, S. K.,
SECOMBES, C. J. &
CHAPPELL, L. H.
(1991).
Studies on the infectivity of Diplostomum spathaceum in rainbow trout (Oncorhynchus mykiss).
Journal of Helminthology
65, 169–178.CrossRefGoogle Scholar
WILLIAMS, G. C.
(1966).
Adaptation and Natural Selection. A Critique of Some Current Evolutionary Thought. Princeton University Press, Princeton.
WILSON, K.,
BJØRNSTAD, O. N.,
DOBSON, A. P.,
MERLER, S.,
POGLAYEN, G.,
RANDOLPH, S. E.,
READ, A. F. &
SKORPING, A.
(2002).
Heterogeneities in Macroparasite Infections: Patterns and Processes. In
Ecology of Wildlife Diseases
(ed. Hudson, P. J.,
Rizzoli, A.,
Grenfell, B. T.,
Heesterbeek, H. &
Dobson, A. P.),
pp. 6–44.
Oxford University Press, Oxford.

Fig. 1. Observed number of Diplostomum spathaceum cercariae alive in 10×1 ml samples counted every 3 h from each of the 4 containers held under standardized conditions. The size of each dot represents the number of observations.
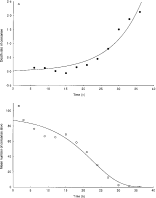
Fig. 2. Observed mortality (A) and survival (B) of Diplostomum spathaceum cercariae held in 4 containers under standardized conditions. Mortality of cercariae was modelled according to an empirical age-dependent model μt=aexp(bt), where a=0·033 and b=0·118. Survival was modelled according to Nt=N0exp[a/b−a/bexp(bt)], where a=0·007 and b=0·132.
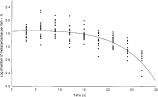
Fig. 3. Infectivity of Diplostomum spathaceum cercariae estimated as the number of metacercariae reaching the eye of a rainbow trout exposed to 250 cercariae for 30 min under standardized conditions every 3 h. The infectivity was modelled according to Anderson & Whitfield (1975): It=I0+γt[A0−(αG0)/g] – (γαG0)/g2[1−exp(gt)], where I0=1·670, γ=0·005, αG0=−0·135 and g=0·127.
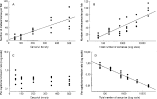
Fig. 4. Total number of Diplostomum spathaceum metacercariae per fish with (A) density of cercariae and (B) total number of cercariae, and the per capita transmission rate of the parasite with (C) density of cercariae and (D) total number of cercariae. The fitted lines are: (A) y=ax+b, where a=0·127 and b=3·790, (B) y=alog(x)+b, where a=27·111 and b=36·351, (D) y=axb, where a=13·306 and b=−0·744.
 You have
Access
- 83
- Cited by