I. INTRODUCTION
Although carbon-based materials are still the dominant anodes in commercial Li-ion batteries, great interest has been focused on the noncarbonaceous materials with high specific capacity since Fujiphoto Film Celltec first reported that amorphous Sn-based oxides exhibited a high specific capacity and a long cycle life.Reference Idota, Kobota, Matsufuji, Maekawa and Miyasaka1 It seems that metallic Sn is more suitable to be used as anode since the introduction of oxygen will decrease the specific capacity and bring the irreversible capacity. However, Sn anode undergoes large volume changes during Li-insertion/extraction processes, causing a rapid capacity fading. In recent years, great effort has been made to alleviate the large volume changes. One of the effective methods is to use Sn-based intermetallic compounds, MxSny, instead of metallic Sn, where M is a Li-inert element.Reference Kepler, Vaughey and Thackeray2–Reference Nwokeke, Alcántara, Tirado, Stoyanova, Yoncheva and Zhecheva11 The introduction of the Li-inert element, however, decreases the overall capacity. The long-term cycling stability of the intermetallic compounds is not satisfactory yet due to the limited buffering effect of the Li-inert element.
An alternative strategy is to mix metallic Sn with a matrix. Among various potential matrices, carbon-based materials are considered to be best choices because they not only buffer the volume changes owing to their ductibility but also contribute to the overall capacity. Besides, the high electronic conductivity offers the conducting channels. An improvement in electrochemical performance was realized in some Sn-based anodes by using carbon-based materials, such as amorphous carbon,Reference Noh, Kwon, Lee, Cho, Kim and Kim12–Reference Jung, Lee, Ryu, Im and Oh14 carbon fibers,Reference Egashira, Takatsuji, Okada and Yamaki15, Reference Yu, Yang, Teng, Yang and Ryu16 graphite,Reference Veeraraghavan, Durairajan, Haran, Popov and Guidotti17, Reference Balan, Ghanbaja, Willmann and Billaud18 and carbon nanotube (CNT).Reference Lee, Kong, Yang and Jung19, Reference Guo, Zhao, Liu and Dou20 Nevertheless, it is difficult to realize a uniform dispersion of Sn particles in the carbon matrix. Furthermore, the buffering capability of the carbon matrix becomes progressively weakened because both the carbon matrix and the Sn particles will aggregate after repeated cycling.
A useful method to overcome this problem is to incorporate Sn particles into one-dimensional (1D) carbon material because the particles aggregation can be effectively restrained for the 1D material due to the small contact area. Previous reportReference Yu, Gu, Zhu, van Aken and Maier21 showed that the tin nanoparticles showed remarkably improved cycling stability compared to commercial Sn when encapsulated in carbon microtubes. An improved electrochemical performance was also observed for Sn nanoparticles when incorporated into CNT using a templated chemical vapor deposition (CVD) route.Reference Wang, Wu, Jiao and Lee22 In this work, we will use a facile, template-free one-pot CVD route to synthesize 1D core–shell structured Sn/CNT using nanosized SnO2 particles as the starting material. The formation mechanism of the material and its electrochemical Li-storage properties will be discussed.
II. EXPERIMENTAL
The 1D core–shell structured Sn/CNT composites were prepared by a facile one-pot CVD route using nanosized SnO2 (Alfa Aesar, 22–43 nm) as the starting material. The SnO2 powder was put into an alumina crucible and located at the center of a horizontal tube furnace. The CVD reaction was carried out at 500–700 °C for 0.5–4 h in flowing N2/C2H2 (10% C2H2) followed by cooling to room temperature naturally. The N2/C2H2 was flowing through the reactor in the whole process from the beginning of the heating to the end of the cooling.
The crystalline structure of the products was characterized by x-ray diffraction (XRD) on a Rigaku D/Max-2550pc powder diffractometer (Rigaku Industrial Corporation, Osaka, Japan) equipped with Cu Kα radiation (λ = 0.1541 nm) in the range of 10–80° (2θ). The morphologies of the products were observed by field-emission scanning electron microscopy on a FEI-sirion microscope (Hitachi High Technologies America, Inc., Pleasanton, CA) and transmission electron microscopy (TEM) on a JEM 2100F microscope (JEOL Ltd., Tokyo, Japan). Raman spectra were recorded on a Jobin-Yvon Labor Raman HR-800 Raman microscope system (HORIBA Jobin Yvon Ltd., Paris, France) using a 514.5 nm Ar+ laser at 10 mW.
The electrode slurry was made by mixing Sn/CNT (or bare Sn), acetylene black, and polyvinylidene fluoride binder in a weight ratio of 75:15:10 in N-methyl pyrrolidone. After stirring for 2 h, the slurry was spread on Ni foam and dried at 100 °C for 8 h under vacuum to make working electrodes. The coin cells were assembled in an Ar-filled glove box using metallic lithium as the anode, 1 M LiPF6 in ethylene carbonate/dimethyl carbonate (1:1 in volume) as the electrolyte, and Celgard 2300 porous polypropylene film (Celgard LLC Corporate, Charlotte, NC) as the separator. Galvanostatic cycling was performed at 50 mA/g between 0.05 and 2.0 V versus Li/Li+ on a LHS-B-5V5mA8D battery tester. Cyclic voltammetry (CV) measurement was performed on a CHI 660C electrochemistry workstation over the voltage range of 0.05–2 V at 0.1 mV/s. All the electrochemical measurements were performed at room temperature.
III. RESULTS AND DISCUSSION
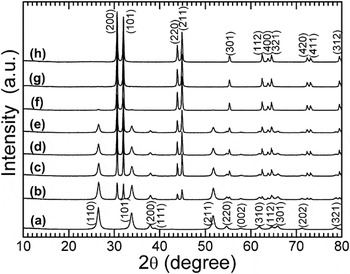
Figure 1 shows the XRD patterns of the CVD products under different conditions. As seen in Fig. 1(b), only part of the original SnO2 is reduced to metallic Sn when it was heated at 500 °C for 2 h in C2H2. On increasing reaction temperature and time, the reduction of SnO2 proceeds as shown in Figs. 1(c)–1(f). Note that the SnO2 has been completely reduced to metallic Sn (JCPDS 04-0673) when the CVD reaction was performed at 650 °C for 2 h [Fig. 1(g)]. The pyrolyzed carbon from C2H2 acts as the reductant for the reduction of SnO2 to Sn. The diffraction peaks related to carbon are absent for all the CVD products, implying the disordered feature of the pyrolyzed carbon.
X-ray diffraction patterns of the chemical vapor deposition (CVD) products prepared under different conditions: (a) original SnO2, (b) 500 °C-2 h, (c) 550 °C-2 h, (d) 600 °C-0.5 h, (e) 600 °C-1 h, (f) 600 °C-2 h, (g) 650 °C-2 h, and (h) 700 °C-4 h.

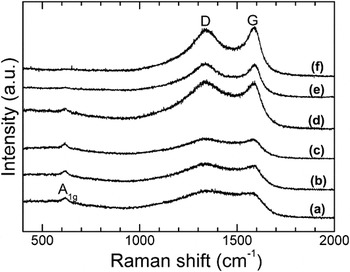
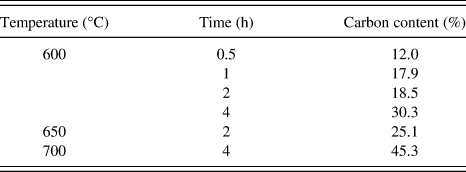
Figure 2 shows the Raman spectra of the CVD products under different conditions. The band at around 610 cm−1 corresponds to A1g vibration mode of SnO2.Reference Ningthoujam and Kulshreshtha23, Reference Yang, Du, Guo, Yu, Chen, Zhang, Chen and Liu24 The intensity of the band is generally on the decrease with increasing the reaction temperature and time [Figs. 2(a)–2(d)]. As shown in Fig. 2(e), this band almost disappears for the 650 °C-2 h sample, which indicates that SnO2 has reduced to Sn sufficiently, in good agreement with the XRD results. The two bands at around 1350 and 1590 cm−1 are related to the disordered (D) band and graphitic (G) band of carbon materials.Reference Moon, Kim, Hwang and Park25 The intensity of the G band increases with time and temperature, indicating the gradually enhanced graphitization. Carbon content analyses (Table I) show that more carbon is deposited at a higher temperature or for a longer time.
Raman spectra of the CVD products prepared under different conditions: (a) 600 °C-0.5 h, (b) 600 °C-1 h, (c) 600 °C-2 h, (d) 600 °C-4 h, (e) 650 °C-2 h, and (f) 700 °C-4 h.

Carbon content results of the chemical vapor deposition products.

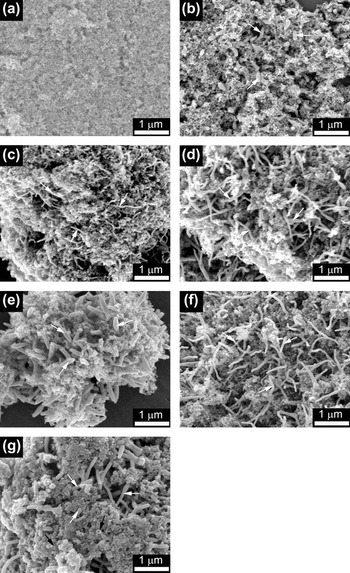
Figure 3 shows the scanning electron microscopy (SEM) images of the CVD products under different conditions. For comparison, the SEM image of the original SnO2 powder is also given [Fig. 3(a)]. After reaction in N2/C2H2 at 600 °C for 0.5 h, some short rods with a diameter of about 100 nm appear among the SnO2 nanoparticles as indicated by the white arrows in Fig. 3(b). According to the XRD results and the low melting point of Sn (232 °C), the nanorods are considered to be Sn. The length of the nanorods is on the increase with the reaction time as indicated in Figs. 3(c) and 3(d). When the reaction time was increased to 4 h, the diameter of the rods increases obviously as shown in Fig. 3(e). Compared with the 600 °C-4 h sample, the 650 °C-2 h sample exhibits a reduced diameter [Fig. 3(f)], even though at a higher temperature. Thus, it seems that the reaction time plays a more important role in the diameter of the nanorods. Further increasing the temperature leads to the appearance of some large bulks [Fig. 3(g)]. The large bulks are suggested to be the aggregated Sn particles leaked out from the broken CNT as indicated by the black arrows in Fig. 3(g).
Scanning electron microscopy images of the CVD products prepared under different conditions: (a) original SnO2, (b) 600 °C-0.5 h, (c) 600 °C-1 h, (d) 600 °C-2 h, (e) 600 °C-4 h, (f) 650 °C-2 h, and (g) 700 °C-4 h.

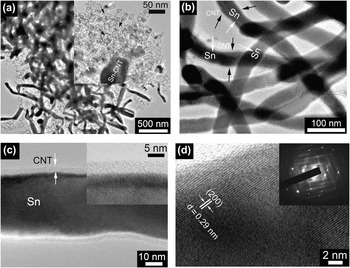
To further investigate the microstructure and the growth mechanism of the nanorods, TEM observations were performed. Figure 4 shows typical TEM images of the 650 °C-2 h sample at different magnifications. Rod-like morphology is evident as shown in Fig. 4(a). The inset in Fig. 4(a) shows a typical image of an individual nanorod with its one end embedded in the hollow spheres as indicated by the black arrows. It seems that the material of the nanorod comes from these spheres. Some residual partly filled spheres (denoted by the white arrows) can support this assumption. It should be mentioned that more than 90% of the Sn nanoparticles have been transformed into Sn nanorods coated by a carbon layer. High-magnification TEM images show that the nanorods exhibit a coaxial nanocable structure with a dark core and a light outer shell [Fig. 4(b)]. High-resolution TEM (HRTEM) images show that the diameter of the dark core is about 40–50 nm, while the thickness of the outer shell is around 4–5 nm [Fig. 4(c)]. Note that the carbon shell is homogeneous with a smooth surface. Figure 4(d) displays the lattice-resolved HRTEM images of the core–shell structure. The lattice fringes of the dark region can be clearly seen, indicative of a good crystallization of the core. The fringe spacing is measured to be 0.29 nm, corresponding to the interplanar spacing of the (200) plane of metallic Sn, which confirms that the core of the core–shell structure is Sn. The inset in Fig. 4(d) shows the selected area electron diffraction (SAED) patterns recorded in the core region. The SAED reveals the single-crystalline nature of an individual Sn nanorod. For the outer shell, however, no well-resolved lattice fringes can be observed, indicative of the disordered feature of the pyrolyzed carbon. As a result, a core–shell structured Sn/CNT has formed during the facile CVD process.
Transmission electron microscopy (TEM) images of the CVD product prepared at 650 °C for 2 h: (a) low-magnification, (b) high-magnification, (c) high-resolution, and (d) lattice-resolved high-resolution views.

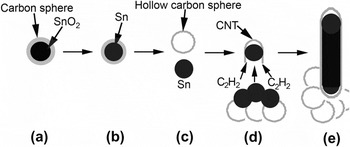
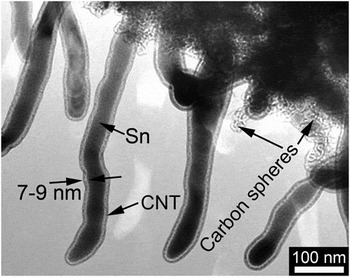
Based on the XRD, SEM, and TEM analyses, a growth mechanism for 1D core–shell structured Sn/CNT is proposed as schematically illustrated in Fig. 5. At the early stage of the CVD reaction, the SnO2 nanoparticles are covered with a layer of disordered carbon from C2H2 to form a SnO2/C core–shell structure [Fig. 5(a)]. When heated at a given temperature (typically 600 °C) for a period of time, part of the SnO2 nanoparticles is reduced to Sn by the pyrolyzed carbon [Fig. 5(b)]. The low-melting-point Sn then leaks out from the carbon spheres to form liquid Sn droplets and the hollow carbon spheres [Fig. 5(c)]. The formation of the hollow carbon spheres has been confirmed in Fig. 4(a). The Sn droplets act as the catalytic centersReference Li, Sun, Zhou, Cai and Sun26 to decompose C2H2 and grow CNT [Fig. 5(d)]. With the continuous growth of CNT, the Sn droplets around the CNT will be absorbed into the interior of the CNT by the capillary force,Reference Lee, Mathews, Toghiani, Wipf and Pittman27, Reference Wang and Lee28 forming the 1D Sn/CNT core–shell structure [Fig. 5(e)]. After absorbing all the neighboring Sn droplets, the CNT tends to close its end.Reference Li, Sun, Zhou, Cai and Sun26 It should be stressed that the hollow carbon spheres will retain in the ultimate products [Fig. 4(a)]. To sufficiently reduce SnO2, a high temperature and a long time are generally necessary. However, the increased pressure of Sn vapor in the closed CNT will cause the breaking of the CNT at elevated temperature, resulting in the leakage of Sn [Fig. 3(g)]. Prolonging the CVD reaction time, on the other hand, will thicken the wall of the CNT as seen in Fig. 6.
Schematic illustration of the growth mechanism of one-dimensional core–shell structured Sn/carbon nanotube (CNT).

TEM image of the CVD product prepared at 600 °C for 4 h.

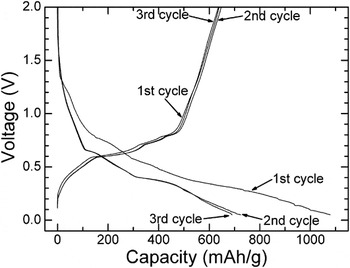
Figure 7 shows the typical charge–discharge curves of the core–shell structured Sn/CNT prepared at 650 °C for 2 h. The first charge (Li-extraction) capacity of the material reaches 638 mAh/g, higher than the theoretical capacity of the carbon-based materials (372 mAh/g). Note that the capacity of the Sn/CNT is smaller than the theoretical value of metallic Sn (990 mAh/g) because of the existence of carbon (hollow spheres and shells in core–shell structure). A large irreversible capacity of about 440 mAh/g is also observed during the first cycle, caused by the electrolyte decomposition and the formation of solid electrolyte interface (SEI). In the subsequent cycles, a good reversibility can be achieved for the Sn/CNT electrode evidenced by the almost overlapped charge or discharge curves. The good reversibility can be attributed to the presence of the disordered carbon layer that not only prevents the direct contact of Sn nanorods with the electrolyte but also supplies the electronically conducting channels for the Sn nanorods.
Charge–discharge curves of the CVD product prepared at 650 °C for 2 h.

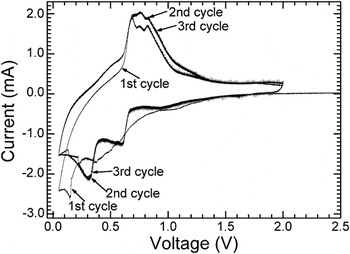
To study the Li-storage mechanism of the core–shell structured Sn/CNT, CV measurement was performed at 0.1 mV/s. Figure 8 shows the typical CV plots of the 650 °C-2 h sample. Apart from the first cycle, the plots are also overlapped in the following cycles, also indicating a good electrochemical reversibility of the material. Three oxidation peaks in the voltage range of 0.5–1 V, which correspond to three quasi-plateaus in the charge curves (Fig. 7), are related to the successive delithiation processes.Reference Huggins29, Reference Huggins30 Two reduction peaks, located at around 0.3 and 0.6 V, respectively, are associated with the stepwise lithiation processes of metallic Sn. A weak reduction peak at about 1.1 V in the first scan is related to the electrolyte reduction reaction that forms the SEI layer.
Cyclic voltammetry plots of the CVD product prepared at 650 °C for 2 h.

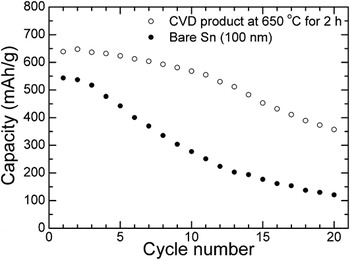
Figure 9 compares cycling stability between core–shell structured Sn/CNT nanorod and bare Sn. It is obvious that the Sn/CNT nanorod exhibits an improved cycling stability compared with the bare Sn with a diameter of around 100 nm, particularly in the initial cycles. After 20 cycles, a charge capacity of about 350 mAh/g is still retained for Sn/CNT. In contrast, for bare Sn, this value drops rapidly to about 100 mAh/g after the same cycles. The improved electrochemical performance can be ascribed to three factors: first, the carbon shell can buffer the large volume changes during the Li-insertion/extraction processes; second, the 1D structure is more resistant to aggregating upon repeated cycling; third, the hollow carbon spheres can also serve as separators to prevent the Sn/CNT from aggregating since the 1D Sn/CNT grows among these carbon spheres. In addition, the carbon shells offer the conducting channels for Sn nanorods, facilitating the charge transfer in the electrochemical reaction. In a separate experiment, we also found that the Sn encapsulated by CNT is resistant to oxidation when heated in air. Nevertheless, it should be emphasized that the long-term cycling stability of Sn/CNT is not satisfactory yet due to the intrinsic large volume changes of Sn upon Li-insertion/extraction and the gradually degraded buffering ability of CNT during repeated cycling.
Comparison of cycling stability between core–shell structured Sn/CNT and bare Sn.

IV. CONCLUSIONS
Core–shell structured Sn/CNT nanorods were successfully synthesized by a facile, one-pot CVD route in N2/C2H2 (10% C2H2) using SnO2 nanoparticles as the starting material. The formation of the core–shell structure was realized through a Sn-self-catalytic CNT growth route with the absorption of Sn into CNT by the capillary effect simultaneously. The Sn/CNT nanorod exhibits a better electrochemical performance compared to bare Sn due to the unique 1D core–shell structure, the buffering effect of the carbon shell, and the enhanced electronic conductivity. It suggests that the cycling stability of the material can be further optimized by reducing the diameter of Sn nanorods and/or producing discrete Sn nanorods with an inter-rod spacing in CNT.
ACKNOWLEDGMENTS
This work was supported by Zijin Program of Zhejiang University, the Fundamental Research Funds for the Central Universities (No. 2010QNA4003), the Ph.D. Programs Foundation of Ministry of Education of China (No. 20100101120024), and the Foundation of Education Office of Zhejiang Province (No. Y201016484).