I. INTRODUCTION
Metal nanostructures in general and one-dimensional (1D) metal nanowires in particular have stimulated research in disciplines that range from biology to electronics to mechanics. Metallic nanowires have been used for electron field emission as electron sources and ionizers,Reference Marinov, Buldum, Clemons, Kreider, Young and Hariharan1–Reference Lee, Lee, Ihm and Han3 for interconnects in microelectronics,Reference Dong, Bush, Chirayos, Solanki and Jiao4 for electrochemical sensors and biosensors,Reference Yogeswaran and Chen5, Reference Walter, Penner, Liu, Ng, Zach and Favier6 and for electrochemical energy storage devices as electrode materials.Reference Ko, Kang, Park, Lee and Kim7 From a processing point of view, metal nanowires are primarily fabricated in top–down or bottom–up processes. In a top–down process, which is mostly suited for small nanowires, a nanowire of any given shape is made from the bulk material using techniques such as electron-beam lithography.Reference Lee, Chen, Chilkoti and Zauscher8 In a bottom–up process, single crystal nanowires with high aspect ratios can be fabricated using different deposition techniques.Reference Ji, Lee, Scholz, Gosele and Nielsch9 Many of the potential applications for metal nanowires require 1D nanowires (one dimension greater than a few hundred nanometers), and preferably defect free.Reference Sosnova, Dmitruk, Korovin, Mamykin, Mynko and Lytvyn10, Reference Xia, Yang, Sun, Wu, Mayers, Gates, Yin, Kim and Yan11 Experimental mechanical testing of such metal nanowires with one dimension in the range of a few hundred nanometers to a few microns is difficult, if not impossible, because of the physical limitations of any testing device and the uncontrolled interactions between the measuring device and the nanostructure, and appropriate modeling is needed in conjunction with experimental measurements and observations. Atomistic and molecular dynamic (MD) simulations have mostly focused on the smallest of nanowires with cross-sectional dimensions of a few nanometers and lengths of at most a few tens of nanometer.Reference Hyde, Espinosa and Farkas12–Reference Horstemeyer, Baskes and Plimpton16 The time span in such simulations is also typically very short, which results in deformation rates that are substantially higher than physically realistic values. Therefore, for 1D nanowires and where atomistic or MD simulations are currently not practical, validated microstructure-based continuum modeling methods can play a critical role by providing insights on the evolution of elastic and inelastic deformations, potential failure modes, and microstructural behavior. Furthermore, due to the very high strength of nanowires, even in the elastic regime, they might undergo large elastic rotations, for which classic elasticity theories are no longer valid, which further underscores the need for microstructurally based computational methods.Reference Timoshenko and Goodier17
Experimental measurements have shown that in metal nanowires, Young’s modulus is mainly independent of diameter, whereas the yield strength is a function of the diameter and increases as diameter decreases.Reference Li, Gao, Murphy and Caswell18–Reference Agrait, Rubio and Vieira20 These studies also indicate that Young’s modulus in metal nanowires is comparable with that of bulk metal, and that their yield strengths could be up to two orders of magnitude lager than bulk values. One of the methods in measurement of force-displacement response of metal nanowires is to use an atomic force microscope (AFM) tip to bend a nanowire.Reference Wong, Sheehan and Lieber21, Reference Wu, Heidelberg and Boland22 In a bending test, the nanowire could be positioned in several ways. These methods include pinning one end of the nanowire to the substrate, positioning the nanowire across pores on a substrate, and positioning the nanowire over a trench on a substrate with its two ends fixed to the substrate. The latter setup was used by Wu et al.Reference Wu, Heidelberg and Boland22 to obtain force-displacement data for two-end fixed gold nanowires placed over trenches 0.3–4-μm wide on a substrate and deformed by an AFM tip-induced lateral force exerted near the middle of the nanowire. The nanowires in Ref. Reference Wu, Heidelberg and Boland22, range in diameter from 40 to 250 nm, and results are reported for a 200-nm nanowire. Transmission electron microscope investigation of smaller size gold nanowires in Ref. Reference Wu, Heidelberg and Boland22 shows that individual grains span the diameter of the nanowires, and that adjacent grains are separated by low-angle boundaries. In this study, we have simulated this physical setup to understand the behavior of 1D metallic nanowires. A multiple-slip crystalline plasticity formulation for face-centered cubic (fcc) materials is used with a specialized finite element framework to investigate the elastic and inelastic behavior of a two-end fixed 1D single crystal gold nanowire subjected to bending stresses. Results from this study provide a detailed understanding of the mechanical properties and deformation and failure mechanisms of 1D metal nanowires. They can also be used to predict the behavior of systems that rely on the functionality of 1D metal nanowires for reliable operating conditions.
This article is organized as follows: in Sec. II the multiple-slip crystal plasticity formulation and computational approach is presented; the results and discussion are presented in Sec. III; and the summary and conclusions are presented in Sec. IV.
II. MULTIPLE-SLIP CRYSTAL PLASTICITY FORMULATION
The plasticity behavior of nanocrystalline materials is dominated by the large surface-to-volume ratios and microplasticity mechanisms.Reference Volkert and Lilleodden23 The formulation used here for large elastic and inelastic deformations of a single crystal gold nanowire is based on a general multiple-slip crystal plasticity (e.g., Ref. Reference Rezvanian and Zikry24) that is modified for nanoscale deformation mechanisms. For finite strain deformations, the velocity gradient tensor L can be obtained from the deformation gradient tensor F and its rate of change  asReference Zikry and Nemat-Nasser25

The velocity gradient can then be decomposed into the deformation rate tensor D and the spin tensor W. The deformation rate tensor and the spin tensor can be additively decomposed into elastic (*) and plastic (p) components as


The plastic components are defined in terms of the crystallographic slip rates  as


where α is summed over all slip systems, and P (α) and ω (α) are defined as


 is the unit vector normal to the plane of slip system α, and
 is the unit vector in the slip direction. A general power law relation for crystallographic slip rates is used, which has the form of

where m is the strain-rate sensitivity parameter,  is the reference strain rate, τ (α) is the resolved shear stress, and
 is the threshold resistance to slip on system α, and can be stated as

where τy is the static yield stress, c is a constant, G is the shear modulus, and b is the magnitude of the Burgers vector.  in Eq. (6) is density of the stored dislocations that act as obstacles against slip on slip system α. At larger length scales during the inelastic deformation of crystalline materials dislocations are immobilized in large enough numbers and
 contributes to strain hardening. There are relations available to approximate the evolution of
 .Reference Rezvanian, Zikry and Rajendran26, Reference Zikry and Kao27 However, in metal nanostructures that have at least one dimension of less than a few hundred nanometers, conditions are more favorable for mobile dislocations to reach a free surface with few obstacles. This is more significant for single crystalline nanostructures in the absence of grain boundaries. In defect-free nanowires, dislocations can be nucleated by thermal activation at high temperatures. On the other hand, low-temperature oscillations in defect-free nanowires can nucleate many sites simultaneously, which can result in a large drop in the material’s load carrying capacity.Reference Zhu, Li, Samanta, Leach and Gall28 When defects are present, at room temperature, mobile dislocations could initiate from initial defects usually introduced during the fabrication process and particularly in bottom–up processes, which are used to fabricate 1D nanowires.Reference Hyde, Espinosa and Farkas12 This can be modeled by assigning a lower threshold slip resistance to a number of randomly selected locations. The defect sites can be selected from the areas that are more prone to defects, such as surfaces. Here, a different approach has been adopted in which it is assumed that every material point can nucleate dislocations when the threshold slip resistance is exceeded at that point, and that the threshold resistance remains constant. Once the crystallographic slip rates are obtained from Eq. (5), the plastic components of deformation rate tensor and spin tensor are obtained from Eq. (3), and used to update the corotational stress rate tensor
 as

where the elastic moduli L ijkl can be defined in terms of Lame elastic constants.
The finite element method that is used here is based on the modification of the method developed by Zikry and Nemat-NasserReference Zikry and Nemat-Nasser25 for multiple-slip crystal plasticity. The deformation gradient tensor is computed from nodal displacements. Then the velocity gradient tensor is obtained from Eq. (1). Once the velocity gradient tensor is obtained, the total deformation rate tensor and the total spin tensor can be updated. An implicit finite element method is used to obtain the total deformation rate tensor. Nodal displacements are obtained by the quasi-Newton Broyden-Fletcher-Goldfarb-Shanno (BFGS) method.Reference Broyden29 The B-bar methodReference Hughes30 is used to overcome any spurious deformations associated with incompressible modes and one-point integration.
III. RESULTS AND DISCUSSION
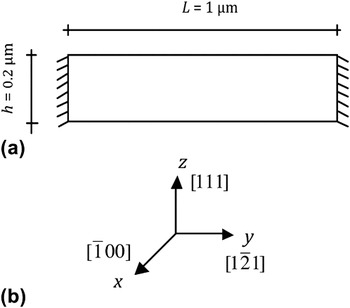
The dimensions of the finite element model have been chosen to represent a 1D nanowire. The model is 1000-nm long and 200-nm thick. The geometry and boundary conditions are shown in Fig. 1(a), and the global coordinate axes are shown in Fig. 1(b). On the basis of a convergence analysis, 8000 quadrilateral elements are used in a mesh of 200 by 40 elements with an aspect ratio of one. The lateral boundaries are constrained in both directions so that the model represents a two-end fixed beam similar to the setup in Ref. Reference Volkert and Lilleodden23. A quasistatic displacement is applied at the top middle until the middle node is displaced by 20% of the initial thickness. The model nanowire consists of a single crystal, for which the grain orientation is shown in Fig. 1(b).
(a) The geometry, dimensions, and boundary conditions of the model (b) the global coordinate axes and the grain orientation.

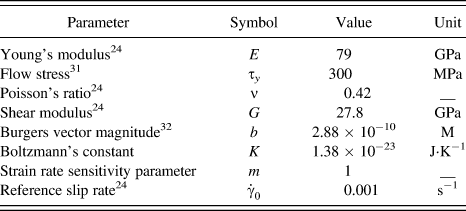
The material properties, which are representative of pure gold, and the values of the constants and parameters used in the crystal plasticity formulation are given in Table I.
Material properties and constitutive parameters for gold.

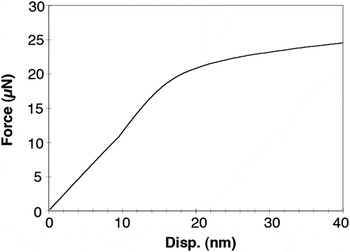
The experimental force–displacement data obtained by Wu et al.Reference Wu, Heidelberg and Boland22 for a 1.8-μm long gold nanowire with a diameter of 200nm, predict that Young’s modulus, E, to be on average in the range of 70 ± 11 GPa and diameter (size) independent, and the average yield strength, σ y, (from elastic beam bending theory) to be in the range of 3.5 ± 1.1 GPa, which is substantially greater than the reported values of 55–200 MPa for bulk gold. For 1D nanowires, several deformation and strengthening mechanisms have been speculated for different aspect ratios. Among them is near-perfect elasto-plasticity for smaller size nanowires, which typically consist of a single grain,Reference Champion, Langlois, Guerin-Mailly, Langlois, Bonnentien and Hytch33 and strain hardening for larger nanowires consisting of at least a few grains.Reference Wu, Heidelberg and Boland22 Here, the results represent a constant flow stress behavior. The force–displacement curve from finite element model is shown in Fig. 2. In the finite element model, the applied force is calculated as the summation of nodal reaction forces in z-direction for fixed lateral boundaries. On the basis of the assumed plane strain conditions, this model actually represents a thin film. However, the results can be used to approximate the bending force for a nanowire with square cross section with an into-the-plane width of 200 nm. The force–displacement curve in Fig. 2, therefore, represents such a square nanowire. In Fig. 2 the displacement is that of the displaced node at the top midpoint [Fig. 1(a)]. The reaction force in Fig. 2 increases approximately linearly up to a displacement of 18.5 nm that is equal to a nominal strain of 9.3% after which deformation occurs more readily indicating a change in deformation mechanism. On the force–displacement curve in Fig. 2, there is also a point at a displacement of ∼9 nm at which the slope continues to increase, but with a higher rate until an inflection point is reached. Such behavior in force–displacement curves has commonly been seen in micro and nanobending experiments. Reference Shan, Wang, Guo and Wang34, Reference Riaz, Fulati, Yang, Nur, Willander and Klason35 The increase in slope can be explained by the increase in the localized plastic zone in the middle of the nanowire. The hydrostatic pressure dominates in this zone, and consequently more energy would be needed to compress the material. Furthermore, this point occurs before the inflection point. This underlines the increase in the plastic zone before a plastic hinge is formed in the nanowire, which is consistent with the experimental observation of Ref. Reference Wu, Heidelberg and Boland22.
Force-displacement curve from crystal plasticity and the finite element modeling for the gold nanowire model shown in Fig. 1.

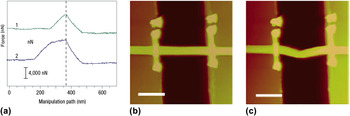
Figure 3(a) shows the force–displacement measurements from Ref. Reference Wu, Heidelberg and Boland22 for elastic deformations (curve labeled 1) and in the plastic regime (curve labeled 2). These curves show an initial linear region that has been attributed to elastic response followed by a yield point, after which deformation occurs more easily. Figures 3(b) and 3(c) are the AFM images corresponding to force–displacement curves labeled 1 and 2. A permanent elongation of the wire and some local deformations at the contact region between the AFM tip and nanowire are seen in Fig. 3(c).
(a) Force-displacement measurements from Ref. Reference Wu, Heidelberg and Boland22 for a 1.8-μm long gold nanowire. The atomic force microscope images of the gold nanowire in (b) elastic regime and (c) into the plastic regime.Reference Wu, Heidelberg and Boland22 Scale bars are 1 μm.

Quantitative comparisons between the modeling and experimental results in Ref. Reference Wu, Heidelberg and Boland22 are difficult due to several reasons. In the bending experiments,Reference Wu, Heidelberg and Boland22 the nanowire’s length is ∼1.8 μm, it has a circular cross section, and more importantly the force–displacement data represent the stiffness of the nanowire and AFM tip as a system, which would be softer than the individual nanowire and AFM tip. To obtain the stiffness of the nanowire, the stiffness of the AFM tip has to be known.
From elasticity theory for assumed small rotations, and for a given displacement, δ, at the middle of a two-end fixed beam, the reaction force, F, is equal to (192EI/L 3)δ, where E is the Young’s modulus, I is the moment of inertia of the beam’s cross section, providing resistance against the applied deformation, and L is the length of the beam. For a square cross section, the moment of inertia is b 4/12, where b is the length of each side. For a circular cross section of radius r, the moment of inertia is πr 4/4. Hence, for a square cross section of 200 nm, I is ∼1.68 times that of a circular cross section with a diameter of 200 nm. Therefore, for the modeled 1-μm beam with a square cross section of 200 nm, the reaction force is ∼9.7 times that of the 1.8-μm beam with circular cross section and a diameter of 200 nm in Ref. Reference Wu, Heidelberg and Boland22. Furthermore, in Fig. 3(a), the stiffness of the nanowire and AFM tip as a system k s, is related to the stiffness of the nanowire k wire, and stiffness of the AFM tip k tip, as k s = (k wirek tip)/(k wire + k tip). Assuming that the AFM tip is two to four times stiffer than the gold nanowire, the stiffness of the nanowire would be 1.5 to 1.25 times the stiffness of the nanowire and AFM tip as a system, which is shown in Fig. 3(a). When the middle of the nanowire is displaced by 10 nm, the modeling and experimental results predict the force to be 11.5 μN (Fig. 2) and 0.6 μN [Fig. 3(a)], respectively. Considering the 9.7 factor obtained above, and assuming that the AFM tip is two to four times stiffer than the gold nanowire, the modeling predicts a force of 0.59–0.95 μN for the system used in the measurements,Reference Wu, Heidelberg and Boland22 which is in perfect agreement. This could indicate that the presumed flow stress behavior in the crystal plasticity model is physically realistic as an operative deformation mechanism for 1D metallic nanowires.
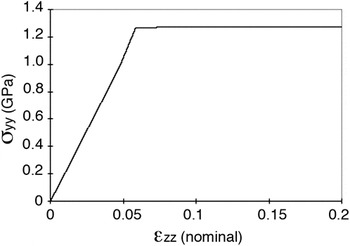
Figure 4 shows the stress in y-direction, σyy, at the bottom midpoint of the nanowire as a function of strain. The strain is a nominal strain, obtained by dividing the applied displacement by the initial thickness. The stress–strain curve shows a perfect elastic–plastic behavior as expected by the material model. The yield stress is ∼1.25 GPa, which is considerably larger than the assumed flow stress of 300 MPa. A question then arises as to what causes the large difference between the flow stress and the yield stress. To answer this question and to understand how the stresses and deformations evolve during loading, the role of the effects of crystalline shear slips on the overall response has to be determined.
Stress in y-direction at the bottom midpoint of the nanowire as a function of a nominal strain, obtained by dividing the applied displacement by the initial thickness.

For the selected grain orientation, the active slip systems are: slip system 7  , slip system 9
 , slip system 10
 , and slip system 12
 . The shear slips occur at the early stages of loading, at the vicinity of the contact region. At the points, where the flow stress is reached, the in-plane stresses indicate that stresses increase almost with the same rate as before flow. The stress data attribute this increase to hydrostatic pressure. The modeling results indicate that once the flow stress is reached at a material point, deviatoric stresses, which contribute to resolved shear stresses on slip systems will no longer increase. The hydrostatic pressure, however, will continue to increase due to a non-zero trace of the deformation rate tensor and dominate the stress response. This trend continues until the trace of the deformation rate tensor decreases and becomes equal to zero, indicating a pure shear deformation at the middle of the nanowire. This suggests that before a change in the overall force–displacement response occurs, plasticity has to evolve from a localized and dispersed status into a form (e.g., a plastic hinge) that changes the deformation mode of the subject structure. It also suggests that the use of classic elastic relations to obtain nanowire properties such as yield strength from the force–displacement response should be with caution. On the basis of the elastic bending relations for the modeled nanowire with a square cross section, the maximum tensile stress at the bottom midpoint for a concentrated load F applied at the middle is 3FL/4b 3. For F = 17.8 μN at the break of linear response from the force–displacement curve in Fig. 2, this suggests a yield strength of 1.67 GPa. Our model predicts the yield stress at the bottom midpoint to be 1.25 GPa (Fig. 4). The difference can be explained by the stiffer response when elastic bending relations for assumed small rotations are used for large strains and rotations.
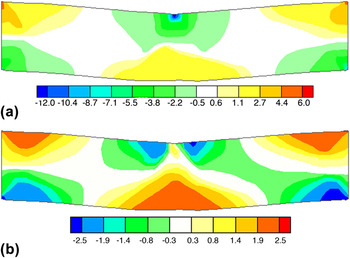
The hydrostatic pressure values and their spatial distributions at 20% nominal strain are shown in Fig. 5(a). At the same nominal strain, the distribution and magnitude of deviatoric stresses in z-direction are shown in Fig. 5(b). The contour values are normalized by the flow stress. Negative values indicate compression and positive values indicate tension. It can be seen from these contours that the hydrostatic pressure is considerably larger than the deviatoric stress, which underscores how the hydrostatic pressure contributes to the force–displacement response of the nanowire.
(a) The hydrostatic pressure at 20% nominal strain and (b) the deviatoric stress contours at the same nominal strain level. Contour values are normalized by the flow stress.

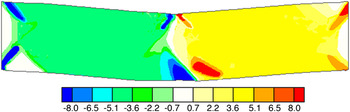
The lattice rotations from rigid body rotations and plastic spins due to shear slips are shown in Fig. 6 for a nominal strain of 20%. Rigid body rotations are ∼5°. At the corners and the middle of the nanowire, rotations are as high as 10° due to plastic slip.
Lattice rotations, at 20% nominal strain, due to rigid body rotation and shear slip. Positive values indicate a counter clockwise rotation and negative values indicate a clockwise rotation.

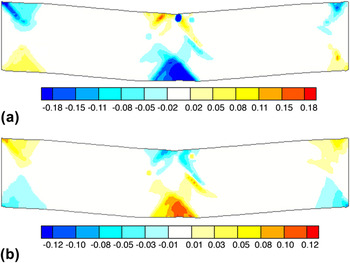
The spatial distributions of plastic strains at 20% nominal strain are shown in Fig. 7. Plastic strains are resulted from shear slips on slip systems. Figures 7(a) and 7(b) show the distribution and magnitude of plastic strains in z- and y-directions, respectively. Negative values indicate a compressive strain. It is seen that the plasticity is mostly concentrated around the middle of the nanowire and at its corners. The contours indicate that plastic hinges are about to form at the middle and the two ends, although at 20% nominal strain the plastic hinge at the middle is more developed as the plastic regions at the top and bottom join. This is suggested, as the process that gradually changes the force–displacement response of the nanowire.
Plastic strain distribution and magnitude at 20% nominal strain in (a) z-direction and (b) y-direction.

IV. SUMMARY AND CONCLUSIONS
A multiple-slip crystal plasticity formulation for fcc materials was used with a specialized finite element analysis framework to investigate the elastic and inelastic behavior of a two-end fixed 1D single crystal gold nanowire subjected to bending stresses. The model simulates the experimental setup in Ref. Reference Wu, Heidelberg and Boland22 that uses an AFM tip to measure mechanical properties of 1D metallic nanowires. For large-strain deformations, the force–displacement response of the nanowire is obtained and compared with the experimental measurements. Deformation and yield mechanisms are proposed based on the evolution of hydrostatic and deviatoric stresses and the development of plastic regions. The modeling results indicate that due to elastic rotations, the use of small strain elasticity relations in such cases could result in inaccurate results. This modeling framework can be used for modeling 1D metal nanowires with one dimension of at least a few hundred nanometers to a few microns, which would span physical dimensions that are not obtainable with atomistic and MD simulations.
ACKNOWLEDGMENT
This work has been supported by the Extreme Friction MURI program, AFOSR grant FA9550-04-1-0381.