Recent theoretical and methodological advances in the investigation of the relationship between language and thought have demonstrated different cognitive effects in monolingual speakers of languages with different concepts (e.g., color: Davidoff, Davies, & Roberson, Reference Davidoff, Davies and Roberson1999; Roberson, Davies, & Davidoff, Reference Roberson, Davies and Davidoff2000; space: Levinson, Reference Levinson, Bloom, Peterson, Nadel and Garrett1996; Levinson, Kita, Haun, & Rasch, Reference Levinson, Kita, Haun and Rasch2002; Majid, Bowerman, Kita, Haun, & Levinson, Reference Majid, Bowerman, Kita, Haun and Levinson2004; time: Boroditsky, Reference Boroditsky2001; kinship: Anggoro & Gentner, Reference Anggoro, Gentner, Alterman and Kirsh2003; modes of motion: Gennari, Sloman, Malt, & Fitch, Reference Gennari, Sloman, Malt and Fitch2002; Slobin, Reference Slobin, Gumperz and Levinson1996, Reference Slobin, Gentner and Goldin-Meadow2003; grammatical number: Imai & Gentner, Reference Imai and Gentner1997; Imai & Mazuka, Reference Imai, Mazuka, Gentner and Goldin-Meadow2003; Lucy, Reference Lucy1992; Lucy & Gaskins, Reference Lucy, Gaskins, Gentner and Goldin-Meadow2003; grammatical gender: Boroditsky, Schmidt, & Phillips, Reference Boroditsky, Schmidt, Phillips, Gentner and Goldin-Meadow2003; Sera, Berge, & del Castillo Pintado, Reference Sera, Berge and del Castillo Pintado1994; Sera, Elieff, Forbes, Burch, Rodriguez, & Dubois, Reference Sera, Elieff, Forbes, Burch, Rodriguez and Dubois2002; numerical cognition: Gordon, Reference Gordon2004).
The majority of these studies have empirically supported the so-called “weak” version of the linguistic relativity hypothesis (the idea that the language we speak influences the way we think). Language directs attention to the concepts encoded in it; this does not entail that if a particular concept is not encoded in our language then we cannot have that concept in our mind at all (for a discussion, see Fishman, Reference Fishman1960; Hunt & Agnoli, Reference Hunt and Agnoli1991; Slobin, Reference Slobin1971; for a historical overview, see Lucy, Reference Lucy1992). The findings from these studies pose interesting and challenging questions for bilinguals with languages that differ in their concepts. Specifically, does the first language (L1) fix cognitive dispositions once and for all, or can the acquisition of a second language (L2) with different conceptual properties from the L1 reorganize cognition according to the distinctions made in it? The current paper provides empirical evidence in an attempt to answer that question and thus contributes toward a new line of investigation of the linguistic relativity hypothesis in relation to bilingualism (for a discussion, see Green, Reference Green1998).
CROSS-LINGUISTIC EFFECTS ON COGNITIVE CATEGORIZATION
Categorization is an essential element of human cognition. In our everyday lives we tend to organize reality and the world around us into identifiable categories. A series of recent studies, mostly in the field of cognitive psychology, have shown that the way we do this is largely based on the lexical categories made available by our language. For example, whereas the physiological basis of color vision may be common to all human beings (Kay & McDaniel, Reference Kay and McDaniel1978), recent evidence shows that when a child learns its first language, attention is directed to the color categories that are specific for that language (Roberson, Davidoff, Davies, & Shapiro, Reference Roberson, Davidoff, Davies and Shapiro2004). Recent research has also shown that grammatical categories such as number marking on nouns affect the way speakers of different languages categorize objects based on their shape or material properties (Lucy, Reference Lucy1992).
In English there is a systematic distinction in the nominal system between count and mass nouns. Count nouns can be preceded by a numeral directly and take obligatory morphological plural marking when quantified (e.g., three book-s). In contrast, mass nouns cannot be modified directly by numerals nor can they take plural marking (e.g., *three waters), but instead require a unitizer to be quantified (e.g., three glasses of water). In contrast, in languages like Yucatec and Japanese, only nouns that have animate referents can be pluralized (e.g., from Japanese: kodomo-tachi “child-plural”), and such plural marking is optional rather than obligatory (Lucy, Reference Lucy1992; see also Corbett, Reference Corbett2000). In contrast, common nouns that refer to inanimate entities exhibit many of the characteristics typical for mass nouns in English (Chierchia, Reference Chierchia1998; Takano, Reference Takano and Akatsuka1994).Footnote 1 They typically cannot take grammatical number marking or be directly preceded by a numeral (e.g., from Japanese: *san ringo lit. three apple), but to be quantified they take unitizers, which are called numeral classifiers (e.g., san ko no ringo, “three piece-of apple”). Consequently, all inanimate nouns in classifier languages like Yucatec and Japanese are semantically unspecified with regard to individuation, just like mass nouns in English are.Footnote 2
Lucy (Reference Lucy1992) hypothesized that these cross-linguistic differences have consequences for cognition. Specifically, Lucy (Reference Lucy1992) predicted that use of obligatory plural marking on inherently individuated (count) nouns in English should direct speakers’ habitual attention toward the shape of objects. This is because the best perceptual indicator of individuation is usually the form or shape of an object. In contrast, speakers of a classifier language like Yucatec should show preferential attention to the material properties of objects because the overwhelming majority of nouns in that language routinely draw speakers’ attention to their referents as nonindividuated substances.
To test his hypotheses, Lucy (Reference Lucy1992) implemented a triads matching task with Yucatec and English monolingual speakers. Participants were presented with a standard object made from a certain material and having a certain shape, for example, a wooden spoon. They were then presented with two alternate objects, one matching the standard in material but having a different shape, for example, a wooden spatula, and one matching the standard in shape but made from a different material, for example, a plastic spoon. Participants were asked to match one of the two alternates with the standard object. Results showed that speakers of English tended to make a shape match significantly more than speakers of Yucatec, who in turn, showed a material preference. These findings provided support for Lucy's (1992) claim of a link between grammatical number marking and cognitive categorization preferences. These results were further substantiated by a similar study comparing English and Japanese monolingual speakers (Imai & Mazuka, Reference Imai, Mazuka, Gentner and Goldin-Meadow2003) and by Lucy's further investigations with English and Yucatec speakers (Lucy & Gaskins, Reference Lucy, Gaskins, Bowerman and Levinson2001, Reference Lucy, Gaskins, Gentner and Goldin-Meadow2003). These studies have also prompted investigation of categorization preferences in bilingual speakers of languages with different grammatical properties. These are described in the following section.
COGNITIVE CATEGORIZATION IN BILINGUALS
Research on bilingualism and cognition has so far focused on general cognitive effects that have been documented mainly in children. A series of studies have shown that bilingualism may enhance and speed up the development of certain metalinguistic abilities such as phonological awareness and reading skills (Bialystok, Majunder, & Martin, Reference Bialystok, Majunder and Martin2003; D'Angiulli, Siegel, & Sera, Reference D'Angiulli, Siegel and Sera2001; Yelland, Pollard, & Mercuri, Reference Yelland, Pollard and Mercuri1993), grammatical development (Galambos & Goldin-Meadow, Reference Galambos and Goldin-Meadow1990), and writing skills and fluency (Ransdell, Arecco, & Levy, Reference Pilling, Wiggett, Özgen and Davies2001). In addition, research has demonstrated that bilingual children and adults have an advantage over monolingual controls in nonlinguistic tasks that require inhibition of attention to a misleading cue (Bialystok, Reference Bialystok1999, Reference Bialystok and Cook2002; Bialystok, Craik, Klein, & Viswanathan, Reference Bialystok, Craik, Klein and Viswanathan2004; Bialystok, Martin, & Viswanathan, Reference Bialystok, Martin and Viswanathan2005).
However, given the increasing amount of converging evidence for cross-linguistic effects on cognition, we can now begin to investigate cognitive effects of bilingualism that stem from cross-linguistic differences in lexicalized and grammaticalized concepts.Footnote 3 Earlier work had investigated “semantic shifts” in bilinguals, showing L2 influence on use and meaning of L1 lexical domains such as color. For example, Ervin (Reference Ervin1961) showed that bilinguals use their L1 color terms differently than monolinguals, whereas Caskey-Sirmons and Hickerson (Reference Caskey-Sirmons and Hickerson1977) showed that bilinguals have different prototypes (foci) for a range of L1 color terms from monolinguals. Although these studies did not investigate nonlinguistic cognitive behavior, their results suggest that bilinguals may differ from monolinguals in lexical concepts. More recently Ameel, Storms, Malt, and Sloman (2005) showed that bilinguals exhibit a unique naming pattern for common containers (bottles and dishes) that is unlike that of monolingual speakers of either language but somewhere in between. Their results suggest that lexical organization in bilinguals is a shared system, combining elements from both languages and merging them into a single pattern.
A study by Boroditsky (Reference Boroditsky2001) on the conceptualization of time showed that the degree to which Chinese–English bilinguals who were studying in the United States followed the Chinese pattern of thinking about time depended on how young they were when they started to acquire English. Younger learners were less likely to use the Chinese pattern than older learners. This finding suggests that maturational constraints may moderate the degree to which bilinguals shift cognitively toward the L2.
The methodological paradigm used in the object categorization studies mentioned earlier has been fruitfully applied to the domain of bilingualism in two recent studies. Cook, Bassetti, Kasai, Sasaki, and Takahashi (2006) repeated a word-extension task conducted by Imai and Gentner (1997), which had shown that monolingual speakers of English tend to extend the novel name for a standard object to another object with the same shape significantly more than monolingual speakers of Japanese, who in turn, tended to extend the novel name for a standard object to another object of the same material. Cook et al. (Reference Cook, Bassetti, Kasai, Sasaki and Takahashi2006) found that Japanese L2 English speakers displayed a unique cognitive disposition, preferring a match by shape more than Japanese monolinguals but less than English monolinguals. However, Cook et al. (Reference Cook, Bassetti, Kasai, Sasaki and Takahashi2006) did not collect any data from Japanese and English monolinguals but compared their results with those reported in Imai and Gentner (1997). Given that some of the materials as well as the novel names used differed, the authors point out that their comparisons are tentative rather than conclusive.
Athanasopoulos (Reference Athanasopoulos2006) conducted a modified version of a picture-matching task used by Lucy (Reference Lucy1992), which had demonstrated that speakers of English judge differences in the number of countable objects as more significant than differences in the number or amount of noncountable substances. In contrast, speakers of Yucatec show no such preference. Athanasopoulos (Reference Athanasopoulos2006) replicated Lucy's (1992) results with English and Japanese monolinguals and furthermore found that intermediate Japanese L2 English speakers performed like Japanese monolinguals, whereas very advanced Japanese L2 English speakers performed like English monolinguals. These results suggest that L2 acquisition can redirect attention toward features of different types of objects, and that such effects are more apparent in very advanced L2 speakers.
Although the studies described above have taken significant initial steps toward investigating cross-linguistic effects in bilinguals, there remain several important issues that need to be addressed. For example, Boroditsky (Reference Boroditsky2001) did not formally assess the L2 proficiency of the bilinguals that took part in her study but used instead an arbitrary measure such as the amount of exposure to the L2, which was calculated by subtracting the age of acquisition from the age at the time of testing. Given that the shift in the cognition of bilinguals depends on the assumption that it is properties of language that induce this shift, rigorous assessment of L2 proficiency is an especially important issue. Furthermore, Boroditsky (Reference Boroditsky2001), Athanasopoulos (Reference Athanasopoulos2006), and Cook et al. (Reference Cook, Bassetti, Kasai, Sasaki and Takahashi2006) overlooked an important issue, namely, the context in which bilinguals were tested. In these studies bilinguals received instructions in their L2 by a non-L1 speaker, in the L2-speaking country.Footnote 4 Thus, it is not clear whether the patterns observed reflect the bilinguals’ general cognitive outlook, or whether they are because of the experimental context, which facilitated the L2 pattern.
AIMS OF THE CURRENT STUDY
To address the issues raised above, the current study implements a triads matching task, comparing object categorization preferences in Japanese and English monolinguals, and Japanese–English bilinguals of different proficiency levels and in different experimental contexts. Furthermore, the current study will also measure bilinguals’ use of grammatical number marking in English during speech production. This will allow for straightforward comparisons between nonverbal cognitive tendencies and spontaneous linguistic performance on the grammatical feature claimed to be influencing object classification. Such comparisons will yield a more complete picture of the relationship between cognition and language in the bilingual mind than previous studies.
The current study aims to address another important issue. It has been argued that effects of language on categorization tasks may result from implicit verbal coding strategies (Munnich & Landau, Reference Munnich, Landau, Gentner and Goldin-Meadow2003; Pilling, Wiggett, Özgen, & Davies, Reference Pilling, Wiggett, Özgen and Davies2003; Roberson & Davidoff, Reference Roberson and Davidoff2000; for the opposing view, see Lucy & Gaskins, Reference Lucy, Gaskins, Bowerman and Levinson2001). In the case of the object categorization studies described earlier, and by extension in the bilingual studies, many of the stimuli used were recognizable objects and substances that could be labeled with count or mass nouns. Thus, it is not possible to know to what degree the patterns observed reflect genuine cognitive tendencies or whether they are simply the result of implicit verbal descriptions of the stimuli. To address this issue, the current study employs a series of artificial, and thus novel, two-dimensional objects as stimulus materials. Thus, a possible verbal coding bias is significantly reduced. Obviously, using two-dimensional displays rather than actual objects and using novel stimuli rather than familiar ones has an effect on the comparability of the current results to those obtained in previous studies. However, the aim of the study is to add another dimension rather than validate previously obtained results with real physical objects.
The task in question requires participants to match these novel objects with a shape or color alternate. Implementing a color alternate instead of a material one affords the advantage that the stimuli cannot be lexically labelled with a count or mass noun, that is, the crucial grammatical properties where English and Japanese differ. Thus, it cannot be argued that participants made their choice because they were influenced by a readily available name (e.g., “the spoon” or “the pile of sand”). Nevertheless, there is a possibility that participants could label using a simple noun phrase like “the red one” (count) or “the red stuff” (mass). However, this does not pose a problem for the current study, as in those cases the color name is used as an adjective, and as such, it is inherently neutral with regard to any semantic or grammatical content denoting count or mass status.
Furthermore, there is empirical evidence to suggest that in shape versus color categorization tasks, there is a range of other factors influencing participants’ choices. Previous studies have shown that educated children and adults living in urban areas show preferential attention to shape over color, whereas uneducated children and adults living in rural areas show preferential attention to color over shape, suggesting that education and cultural background are the crucial variables directing attention to shape or color (Broota & Pahwa, Reference Broota and Pahwa1984; Kaur, Broota, & Sinha, Reference Kaur, Broota and Sinha1986; Schmidt & Nzimande, Reference Schmidt and Nzimande1970; Serpell, Reference Serpell1969). Thus, in the current study, we should expect all participants to favor shape over color, because they are all pooled from University populations. However, given the recent findings that the degree to which speakers of different languages attend to the shape of objects reflects the degree to which individuation is marked in the nominal systems of their language, the question of shape preference relative to color warrants reexamination. Specifically, if language is the driving factor or at least one of the driving factors behind cognitive categorization preferences then it cannot be assumed that speakers of English and Japanese who are matched for education and cultural background will match objects by common shape rather than color to the same degree. In a shape- versus color-matching task, we should expect speakers of English to select shape more than speakers of Japanese. The main concern of the current study, however, is the behavior of bilinguals: will they follow the L1 pattern, or will their attention shift toward the L2 pattern, and if so, to what degree, and why?
METHOD
Participants
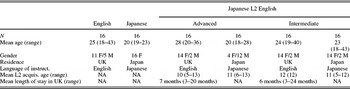
Table 1 provides a summary of the participants’ details. The monolingual participants were 16 English-speaking adults (mean age = 25, age range = 18–43; 11 female, 5 male) and 16 Japanese-speaking adults (mean age = 20, age range = 19–23; all female),Footnote 5 who were all tested in their native country with instructions in their native language (because they were monolingual). In addition, two groups of bilingual speakers took part: 32 Japanese L2 English advanced speakers, half of whom were tested in the United Kingdom and instructed in English by a non-Japanese speaker (mean age = 28, age range = 20–36; mean age of L2 acquisition = 10 years old, range = 5–13; 14 female, 2 male), the other half tested in Japan and instructed in Japanese by a Japanese native speaker (mean age = 20, age range = 18–28; mean age of L2 acquisition = 11 years old, range = 6–13; 4 female, 12 male); and 32 Japanese L2 English intermediate speakers, half of whom were tested in the United Kingdom in English by a non-Japanese speaker (mean age = 24, age range = 19–40; all started acquiring the L2 at 12; 14 female, 2 male), the other half tested in Japan and instructed in Japanese by a Japanese native speaker (mean age = 23, age range = 18–43; mean age of L2 acquisition = 11, range = 5–12; 14 female, 2 male).
The English monolinguals and the L2 speakers who were tested in English were students at the University of Essex in the United Kingdom. The advanced L2 speakers had stayed in the United Kingdom for an average of 7 months (range = 3–20 months), whereas the intermediate L2 speakers had stayed in the United Kingdom for an average of 6 months (range = 3–24 months). The Japanese monolinguals were students at Gunma Prefectural Women's University in Japan and had never lived in an English-speaking country before. Some of the L2 speakers who were tested in Japanese were students at Gifu University in Japan, and some at Gunma Prefectural Women's University in Japan. None of these participants had lived in an English-speaking country before. Sociocultural factors were controlled in this experiment as the vast majority of participants fell more or less within the same age range (early to late 20s) and all of them were University students living in suburban surroundings.
Summary of participants’ details
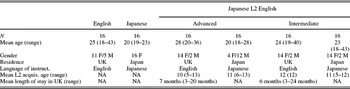
Note: The values are rounded to the nearest whole number. L2, second language.
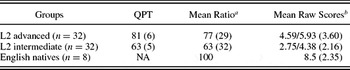
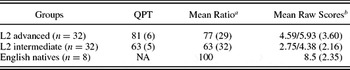
Proficiency in English was measured with the Oxford Quick Placement Test (QPT; Oxford University Press, 2001). In addition to the QPT, the L2 speakers were also given a picture description task, where they were asked to describe orally a picture depicting a scene from a typical town center in England. Their descriptions were recorded through the use of a standard portable tape recorder and transcribed for analysis. The specific grammatical property measured was obligatory grammatical number marking on count nouns. Eight native English speakers who took part in the object classification task were also asked to describe the picture to obtain a reliable basis against which to rate L2 speakers’ performance. The responses for each L2 speaker were scored by calculating the ratio of correctly supplying plural marking to the number of required contexts.Footnote 6 Scores were then converted into percentages and the mean was calculated for each group. Table 2 shows a summary of the L2 speakers’ mean percentage scores in the QPT and number marking in the picture description task, along with the raw figures for each group.
Participants’ mean percentage scores (standard deviations) in the Quick Oxford Placement Test and picture description task and mean raw scores/number of required plural morphology contexts in the picture description task
Note: The values are rounded to the nearest whole number except for the mean raw scores/number of required contexts where figures are rounded to the nearest two decimal places. QPT, Quick Oxford Placement Test; L2, second language.
aMean percentage ratio of producing correct plural morphology.
bMean raw scores of producing correct plural morphology/number of required contexts.
Independent samples t tests showed that the two groups differed significantly in their QPT scores, t (62) = 12.812, p < .01, and their plural marking scores, t (62) = 1.830, p < .05.
Materials
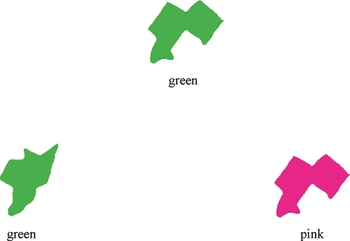
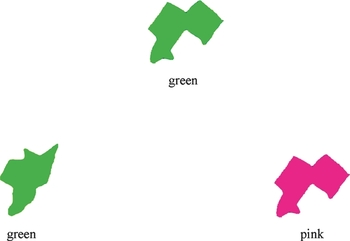
Thirty color illustrations of novel objects were used as stimuli. The stimuli were first drawn by hand on a white piece of paper and then scanned and transformed in digital form. The stimuli were then edited and colored in Adobe Photoshop 5. They were then organized into 10 different triads (Figure 1 shows one such triad). Each triad was composed of a standard object and two alternates, a shape alternate, which had the same shape as the standard but different color, and a color alternate, which had the same color as the standard but different shape. A number of precautions were taken in the design of the stimulus set. First, all stimuli were drawn and edited on the same scale. Therefore, a potential size variable was eliminated. Second, the colors used within each triad were carefully selected so that the shape alternate was not similar in color to the standard. For example, if the standard was red, then care was taken so that the shape alternate was not pink but a more contrasting color, for example, green. Conversely, care was taken so that the color alternate was not similar in shape to the standard. Third, the shapes used were arbitrary novel shapes as opposed to highly recognizable shapes like squares, triangles, and circles.
A triad of stimuli used in the experiment. [A color version of this figure can be viewed online at www.journals.cambridge.org]
Procedure
Each participant was tested individually in a quiet room at a university either in Japan or the United Kingdom. An interactive computer program was created as a test instrument. The software used to create the program was Flash 5 by Macromedia. The participants had to use the computer mouse to interact with the program. After reading the instructions on the computer screen, each participant was prompted to click on the “next” button for the experiment to begin. There were a total of 10 trials. Each trial consisted of two stages. In the first stage, the standard novel object appeared on the top of the screen and participants were asked to click on it. In the second stage, once the participants had clicked on the standard, the two alternates appeared side by side underneath the standard and at an equal distance from it, and participants were instructed to click on the alternate that they thought was “the same” as the standard. The English instruction was “show me which is the same as this, please click.” The Japanese instruction was “Kore(this) to(with) onaji-no(same) wa(topic-marker) dochira(which) desuka(is). Onaji-no(same) wo(topic-marker) crikku(click) shite-kudasai(do).”
The position of the alternates relative to the standard was counterbalanced across trials, such that the shape alternate appeared in 5 out of 10 trials on the left side of the screen, and in 5 out of 10 trials on the right side of the screen, and vice versa for the color alternate. The order in which each trial was presented was randomized for each participant. For the randomization of the trials Flash's Actionscript was used. There was no time limit imposed on the participants. The procedure was repeated for the remaining nine trials. Each participant's response was recorded for each trial and was saved as a data file that appeared at the end of the experiment. Each data file was then committed to paper and gathered for the statistical analysis by the administrator of the experiment. The task lasted for about 10 min. Upon completion of the task, the L2 speakers completed the picture description task and the QPT. Testing for those participants lasted for a total of about 30 min. At the end of the experiment, participants were thanked and debriefed. The majority of them accepted a small reward for their participation.
RESULTS
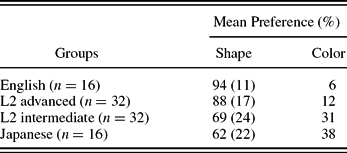
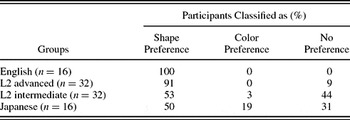
Responses were scored as the number of times each participant selected a shape or color alternate. Scores were then converted into percentages and the mean was calculated for each group of participants. In Table 3 a summary of those mean scores is presented.
Participants’ mean proportion (standard deviations) of shape and color responses
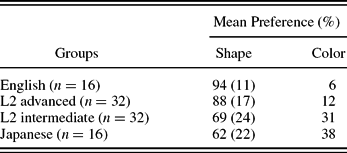
Note: The values are rounded to the nearest whole number. L2, second language.
It is evident from Table 3 that the proportion of color responses is 1 minus the proportion of shape responses. Because of the binary/dichotomous nature of the data, results were analyzed by means of a Logit, with frequency of shape responses as the dependent variable. Overall, this showed a significant main effect of group (χ2 = 51.279, p < .01). Separate Logit analyses showed a significant difference between the English and Japanese monolinguals (χ2 = 23.309, p < .01); between the English monolinguals and the intermediate L2 speakers (χ2 = 19.781, p < .01); between the advanced and the intermediate L2 speakers (χ2 = 21.737, p < .01); and between the advanced L2 speakers and the Japanese monolinguals (χ2 = 23.729, p < .01). There were no significant differences between the English monolinguals and the advanced L2 speakers (χ2 = 4.535, p > .05); and between the Japanese monolinguals and the intermediate L2 speakers (χ2 = 10.136, p > .05). To sum up, the results show that the English monolinguals and the advanced L2 speakers selected the shape alternate significantly more than the intermediate L2 speakers and the Japanese monolinguals.
Furthermore, a comparison of those bilinguals tested in the L1 with those tested in the L2 showed no significant difference between them (χ2 = 9.436, p > .05). This means that the experimental setting that the bilinguals were tested in did not affect their categorization preferences in this experiment, that is, there was cognitive shift even when instructions were given in the L1 by a native L1 speaker in the L1 country.
Tests against chance
Despite the between-group differences, Table 3 shows that the Japanese monolinguals and the intermediate L2 speakers did show a shape bias, albeit significantly smaller than the other two groups. Tests against chance level (50%) were carried out to see whether the shape bias in the Japanese monolinguals and the intermediate L2 speakers is statistically reliable or whether these two groups performed randomly. These showed that the groups in question did select shape significantly above chance: t (15) = 2.162, p < .05 for the Japanese monolinguals; t (31) = 4.433, p < .01, for the intermediate L2 speakers. The English monolinguals and the advanced L2 speakers showed a strong reliable bias toward shape: t (15) = 16.232, p < .01, and t (31) = 12.889, p < .01, respectively.
Individual preferences
To examine whether the group averages in Table 3 above are consistent with individual participants’ patterns it is important to look at the proportion of the number of participants that made shape or color choices. Each participant's response preference was classified as shape preference, color preference, or no preference. The participant's pattern was scored as shape or color preference when he or she made a shape or color choice at least in 7 out of 10 trials. The pattern was scored as no preference when the participant made four, five, or six shape or color choices.Footnote 7Table 4 shows the percentage proportion of the number of participants in each preference type for the four groups. A chi-square analysis of between-group differences replicated the findings from the Logit analysis.Footnote 8
Proportion of the number of participants in each preference type across the four groups
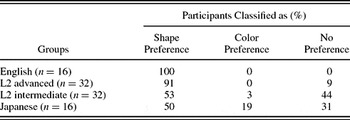
Note: The values are rounded to the nearest whole number. L2, second language.
Correlation between linguistic and cognitive performance
To directly compare L2 speakers’ cognitive tendencies with their production of number marking in English, the two groups of L2 speakers were pooled together into one group (n = 64). Each L2 speaker's shape score in the triads matching task (Table 3) and plural marking score in the picture description task (Table 2) was entered into a Pearson's correlation analysis, partialing out age of L2 acquisition. Results showed that the correlation was moderate and statistically significant (r = .338, p < .05). The correlation between age of L2 acquisition and shape preferences was also significant (r = −.275, p < .05), but when plural marking scores were partialed out the correlation became nonsignificant (r = −.190, p > .05). An additional correlation between shape preference and plural marking scores was performed on those L2 speakers who had lived in the United Kingdom (n = 32), partialing out both length of stay in the United Kingdom and age of L2 acquisition. Results showed that the correlation was moderate and statistically significant (r = .385, p < .05). There was no significant correlation between shape preference and length of stay in the United Kingdom (r = .095, p > .05). These results mean that even when controlling for extra-linguistic variables such as length of stay in the L2 country and age of acquisition, there is a significant relationship between the shift in cognitive preferences and specific linguistic competence, that is, the better L2 speakers are in producing correct number marking in the oral production task, the more they select the shape alternate in the triads matching task.
DISCUSSION
The results show a clear cognitive difference between the two monolingual groups: English speakers selected the shape alternate almost at ceiling, and significantly more than Japanese speakers. The Japanese monolinguals, however, also displayed a substantial shape preference, tending to select the shape alternate significantly above chance. Given that these were University students, and bearing in mind results from previous studies, this finding is not surprising. However, the current results also show that the degree to which this shape bias manifests itself is different for speakers of different languages, and appears to conform to language-specific patterns of individuation. Given that the current study utilized novel, artificial stimuli that could not be labeled with a count or mass noun, these findings substantially reinforce Lucy's (1992) and Lucy and Gaskins’ (2001) claim that linguistic structure influences nonlinguistic similarity judgements.
The picture becomes even more interesting when we consider the results from the L2 speakers. Advanced L2 speakers differed significantly from monolingual speakers of their L1, but not from monolingual speakers of their L2. It seems that their cognitive behavior has shifted significantly toward the L2 pattern. In contrast, the intermediate L2 speakers performed like monolingual speakers of their L1 and differed significantly from monolingual speakers of their L2. These findings suggest that it is possible for language to affect cognition later in life, and that the extent of that effect is closely linked to the acquisition of specific grammatical features and the level of proficiency reached in the specific language. The correlational analyses showed that nonlinguistic variables such as acculturation do not play a role in the bilingual cognitive shift, whereas learning the L2 earlier in life may facilitate the redirection of attention to new conceptual categories, but it is ultimately specific linguistic competence that is most tightly linked with the bilingual cognitive shift.
The findings from the current study also address the crucial issue of cognitive organization in bilinguals (Cook, Reference Cook, de Groot and Kroll1997, Reference Cook and Cook2002; Pavlenko, Reference Pavlenko1999). One possibility is that bilinguals maintain two separate cognitive representations of language-specific concepts, and they alternate between the two mental views of the world according to the language they are engaged in. This possibility is not supported by the current results, as advanced bilinguals shifted their behavior even when engaged in an L1 experimental context. The current findings demonstrate that learning specific grammatical concepts might alter the individual's cognitive representations in a more permanent way, at a deep (prelanguage) level. This suggests that learning new conceptual dimensions may lead to genuine cognitive reorganization or restructuring to a certain extent.
Of course, the correlation between cognitive shift and linguistic competence observed here can only be suggestive rather than demonstrative of a causal link between specific L2 knowledge and cognition. However, this finding contributes to the investigation of a central question for the field in general: how can we tell whether it is language influencing cognition, or whether language maps onto preexisting cognitive patterns? Several studies looking at the relationship between language and cognition developmentally suggest that it is language that acts as an attention-directing mechanism on preexisting cognitive patterns. Although children initially use universal ontological knowledge to categorize entities as objects or substances (Soja, Carey, & Spelke, Reference Soja, Carey and Spelke1991), later on, after experience with language, categorization patterns are heavily influenced by the syntactic count/mass distinction (Subrahmanyan, Landau, & Gelman, Reference Subrahmanyam, Landau and Gelman1999) and become language specific (Imai & Mazuka, Reference Imai, Mazuka, Gentner and Goldin-Meadow2003; Lucy & Gaskins, Reference Lucy, Gaskins, Bowerman and Levinson2001, Reference Lucy, Gaskins, Gentner and Goldin-Meadow2003). Thus, infants acquiring an L1 modify their attention according to the salience of the categories in their linguistic environment (Slobin, Reference Slobin, Gumperz and Levinson1996, Reference Slobin, Gentner and Goldin-Meadow2003). It seems that there is a transition from cognitive-universal conceptualization in early childhood to language-specific conceptualization in later childhood. The current study of bilinguals shows that cognitive representation is not permanently fixed by the native language. Rather, bilinguals seem to shift their cognitive preferences with the acquisition of novel linguistic categories. What remains to be seen, in the context of the current study, is whether it is Japanese children who have to move away from a starting bias toward form (as the work by Lucy and colleagues suggests), or whether it is English-speaking children who have to move away from a starting bias toward color. A third possibility could be that children move away from some intermediate position (a possibility compatible with Slobin's Reference Slobin1985 notion of a language-neutral “opening wedge” in semantic space). The issue is obviously open to further research.
Furthermore, the current data show that from monolingual to intermediate L2 level there are minimal changes, whereas from intermediate to advanced level there is a wholesale shift toward the L2. This pattern suggests that some rather specific cognitive reorganization occurs when bilinguals reach an advanced level of L2 proficiency, thus complementing Caskey-Sirmon and Hickerson's (1977) earlier claim that “the worldview of bilinguals, whatever their first language, comes to resemble, to some degree, that of monolingual speakers of their second” (Caskey-Sirmons, & Hickerson Reference Caskey-Sirmons and Hickerson1977, p. 365). Although the current study has identified and evaluated the impact of several variables on the bilinguals’ changing cognitive state, we are still at the very early stages of that investigation. Further research is necessary, particularly in other linguistic/cognitive/perceptual domains, as well as using longitudinal experimental techniques, to gain a more precise picture of the nature of the bilingual cognitive shift.
Another important issue that needs to be addressed is the nature of the observed cognitive effects. Ameel et al.'s (2005) study showed cross-linguistic effects on naming patterns, but also showed that in nonlinguistic categorization monolinguals of Dutch and French (as well as bilinguals) performed similarly, suggesting that language may not influence nonlinguistic classification. However, Ameel et al.'s (2005) study addresses the lexical domain, whereas Lucy's studies and the current study concern the grammatical domain. Thus, it may be the case that such effects are domain specific, and are localized only in the grammatical domain because that domain makes certain obligatory categorical distinctions, crucial for grammaticality. In contrast, the categories of the lexical domain may not influence nonlinguistic cognition because they do not force obligatory distinctions; for example, a speaker of English must use grammatical number marking when quantifying nouns, whereas naming patterns are malleable and may depend on the context as in cases of political correctness. However, studies focusing on another lexical domain, namely, color, show robust naming effects on memory and nonlinguistic categorization (for a review, see Roberson, Reference Roberson2005). This may mean that linguistic effects on nonlinguistic cognition also depend on the relationship between perceptual and linguistic categories, that is, color may have stronger lexical associations in memory than container objects such as bottles and dishes investigated by Ameel et al. (Reference Ameel, Storms, Malt and Sloman2005).
The findings from this study then open several new avenues of investigation. Specifically, are cross-linguistic effects of bilingualism on cognition empirically observable in other domains (e.g., color perception, spatial cognition, etc.)? What are the consequences of these effects for on-line cognitive processing (e.g., response times for perceptual judgements and memory accuracy)? Furthermore, given that the current and previous studies have shown effects of grammatical representation on higher level cognitive processing such as categorization and reasoning, it remains to be seen whether similar effects may be observed in the lower level processing mechanisms involved, such as visual processing for example. Psychophysical experimental techniques such as eye tracking could test the specificity of these effects in the visual processing stream. This will establish whether learning new ways of categorizing reality involves genuine changes in visual perception or whether it only affects later cognitive processing. Recent evidence shows changes in participants’ perceptions over the course of a training study. Özgen and Davies (Reference Özgen and Davies2002) and Notman, Sowden, and Özgen (Reference Notman, Sowden and Özgen2005) have demonstrated that learning new, artificial categories alters low-level perceptual sensitivities, at least in the very short term. Other studies have shown that conceptual learning leads to perceptual changes and vice versa in categorization and object recognition by adult participants (Goldstone, Reference Goldstone, Kimchi, Behrmann and Olson2003; Goldstone & Barsalou, Reference Goldstone and Barsalou1998; Goldstone, Steyvers, Spencer-Smith, & Kersten, Reference Goldstone, Steyvers, Spencer-Smith, Kersten, Diettrich and Markman2000; Rogosky & Goldstone, Reference Rogosky, Goldstone, Carlson and van der2005). No investigation of the long-term effects of learning a second set of categorical divisions (as bilinguals do) on low-level perceptual processes has yet been undertaken.
CONCLUSION
The current study has implemented a triads matching task utilizing artificial stimuli, and has compared categorization preferences in monolingual and L2 speakers, evaluating the relative impact of several variables that may influence the cognitive behavior of bilinguals. The results support the basic insight of Lucy's (1992) work, that is, that grammatical properties of specific languages correlate with the way speakers of these languages categorize objects. More importantly, the results from the current investigation have valuable implications for the relationship between language and cognition in the bilingual mind. They suggest that the acquisition of an L2 with different concepts from the L1 can reorganize the cognition of bilingual speakers, and that the degree of that reorganization is linked to the acquisition of specific grammatical categories, that is, number, which are present and obligatory in the L2 but absent, or optional, in the L1. The present study provides converging evidence to support the emerging view that language plays an important role in the restructuring of human cognition. The extent and precise nature of that restructuring is open to further investigation.
ACKNOWLEDGMENTS
This research was supported by a postgraduate studentship awarded to the first author by the Economic & Social Research Council (ESRC Award PTA-030-2002-01335). The fieldwork trip to Japan was supported by the Sir Eric Berthoud Travel Grant awarded to the first author by the University of Essex. The authors express their gratitude to Professor Roger Hawkins, Dr. Shigenori Wakabayashi, and Angelos Markou for assisting at various stages of the research. Earlier versions of this paper were presented at the 15th EUROSLA Conference in Dubrovnik, Croatia, and at the joint conference of the American Association for Applied Linguistics and the Canadian Association for Applied Linguistics in Montreal, Canada. The authors thank the audiences of those events, as well as Dr. Martha Crago and three reviewers for Applied Psycholinguistics for their constructive feedback. Any faults that remain are entirely our own.