INTRODUCTION
The determination of individual age and growth rate is one of the key parameters for stock assessment (e.g. Lai et al., Reference Lai, Gallucci, Gunderson, Donnelly, Gallucci, Saila, Gustafson and Rothschild1996; Orensanz & Jamieson, Reference Orensanz and Jamieson1998). Growth, production and physiological activity in bivalve species can be affected by abiotic factors such as temperature (e.g. Green, Reference Green1973; Jones et al., Reference Jones, Arthur and Allard1989; Dekker & Beukema, Reference Dekker and Beukema1999), substrate characteristics (e.g. Pratt, Reference Pratt1953; Pratt & Campbell, Reference Pratt and Campbell1956; Urban, Reference Urban1998), variations in salinity (e.g. Morton, Reference Morton1978; Vincent et al., Reference Vincent, Joly and Harvey1994; Kube et al., Reference Kube, Peters and Powilleit1996) and food availability (e.g. Beukema & Desprez, Reference Beukema and Desprez1986; Beukema & Cadée, Reference Beukema and Cadée1991; Arneri et al., Reference Arneri, Giannetti and Antolini1998). Moreover, population processes such as density-dependence (e.g. Weinberg, Reference Weinberg1998; Dekker & Beukema, Reference Dekker and Beukema1999; Gutiérrez & Defeo, Reference Gutiérrez and Defeo2003) and interaction processes (trophic and non-trophic such as presence of predators, parasitism, ecological engineers) can also affect growth rate (e.g. Nakaoka, Reference Nakaoka2000; Beal, Reference Beal2006; Lomovasky et al., Reference Lomovasky, Mendez Casariego, Brey and Iribarne2006). In this sense, along an intertidal gradient, the effects of environmental stress on shell growth seem to outweigh those of biological interactions at higher zones (Reise, Reference Reise1998; Gosling, Reference Gosling2003; Cognie et al., Reference Cognie, Haure and Barillé2006), while the relationship is opposite at lower intertidal levels (Bartol et al., Reference Bartol, Mann and Luckenbach1999; Bologna & Heck, Reference Bologna and Heck1999). Thus, knowledge of the biological characteristics, distribution patterns, abundance and growth across the intertidal range constitutes additional information for sustainable management of exploited intertidal bivalve populations.
The stout razor clam Tagelus plebeius (Lightfoot, 1786) is a euryhaline species that inhabits tidal flats with cohesive sandy silt sediments along the American Atlantic coast from Cape Cod, Massachusetts (42°N, USA; Leal, Reference Leal and Carpenter2002) to the Northern Argentinean Patagonia (San Matías Gulf, 41°S, Argentina; Olivier et al., Reference Olivier, Escofet, Penchaszadeh and Orensanz1972a, Reference Olivier, Escofet, Penchaszadeh and Orensanzb). Their shells are ubiquitous in Holocene estuarine deposits of central South America (1340 to 3850-year B.P.; Fasano et al., Reference Fasano, Hernández, Isla and Schnack1982; Schnack et al., Reference Schnack, Fasano, Isla and Colquhoun1982) and are often used as indicators of palaeoenvironmental conditions (see Golfieri et al., Reference Golfieri, Ferrero and Zárate1998; Iribarne & Botto, Reference Iribarne and Botto1998; Iribarne et al., Reference Iribarne, Valero, Martínez, Lucifora and Bachmann1998; Aguirre & Farinati, Reference Aguirre and Farinati1999). This suspension-feeding species (Holland & Dean, Reference Holland and Dean1977a; Arruda et al., Reference Arruda, Domaneschi and Amaral2003) is a deep burrowing species that inhabits permanent burrows (up to 0.70 m depth) showing vertical movements through each semidiurnal tidal cycle, but not showing intertidal migration (Holland & Dean, Reference Holland and Dean1977b). Current knowledge of T. plebeius biology and ecology is limited to a few localities in Argentina (Mar Chiquita coastal lagoon: Cledón et al., Reference Cledón, Peralta Brichtova, Gutiérrez and Penchaszadeh2004; Lomovasky et al., Reference Lomovasky, Gutiérrez and Iribarne2005, Reference Lomovasky, Mendez Casariego, Brey and Iribarne2006; Addino et al., Reference Addino, Lomovasky, Cremonte and Iribarne2010, Reference Addino, Alvarez, Iribarne and Lomovasky2016; Bahía Blanca estuary: Addino et al., Reference Addino, Montemayor, Escapa, Alvarez, Valiñas, Lomovasky and Iribarne2015), Brazil (Canal do Calunga, Maceió: Viégas, Reference Viégas1982; São Sebastião: Abrahão & Amaral, Reference Abrahão and Amaral1999; Arruda et al., Reference Arruda, Domaneschi and Amaral2003; Abrahão et al., Reference Abrahão, Cardoso, Yokoyama and Amaral2010; Cachoeira river estuary: Ceuta & Boehs, Reference Ceuta and Boehs2012; Ceara river estuary: de Farias & Rocha-Barreira, Reference de Farias and Rocha-Barreira2012; Caraguatatuba Bay: da Silva et al., Reference da Silva, Corte, Yokoyama, Rodrigues Abrahão and Zacagnini Amaral2015), and the USA (North Inlet estuary, Holland & Dean, Reference Holland and Dean1977a, Reference Holland and Deanb).
Given the current knowledge about the effects of biological interactions on this species, we expect distinct patterns of individual growth in T. plebeius across an intertidal system. For example the differences in morphometric characteristics related to the presence of the intertidal burrowing crab Neohelice granulata (a co-habiting species, Lomovasky et al., Reference Lomovasky, Mendez Casariego, Brey and Iribarne2006), to parasitism by the gymnophallid metacercariae (Lomovasky et al., Reference Lomovasky, Gutiérrez and Iribarne2005; Addino et al., Reference Addino, Lomovasky, Cremonte and Iribarne2010), and to the presence of salt marsh plants Spartina alterniflora (Addino et al., Reference Addino, Montemayor, Escapa, Alvarez, Valiñas, Lomovasky and Iribarne2015) are important. Given this evidence, we hypothesize that the density pattern and individual growth may respond to metabolic necessities of this species determining differential recruitment and mortality, albeit modulated by trophic (e.g. predation, parasitism, competition) and non-trophic (e.g. ecosystems engineering) biological interactions. Accordingly, we expect highest density and growth rates at the low intertidal level. Thus, the aims of the present study are to evaluate the distribution pattern, density and growth of the stout razor clam T. plebeius across intertidal in Mar Chiquita Coastal Lagoon estuarine system.
MATERIALS AND METHODS
Study area, sampling procedure and sediment characteristics
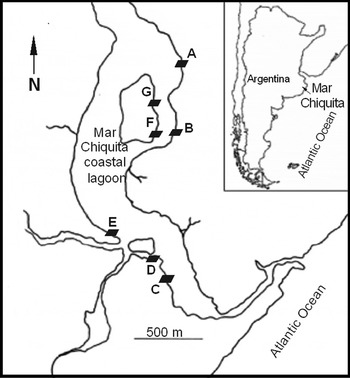
The study was performed between January 2003 and March 2004 in the Mar Chiquita Coastal Lagoon (37°32′S 57°19′W; Argentina). This is a brackish water area of about 46 km2 with muddy sediments and low tidal amplitude (<1 m, Fasano et al., Reference Fasano, Hernández, Isla and Schnack1982). Sampling was conducted in a tidal flat area located along 3 km of shoreline from the lagoon inlet at seven different sites (Figure 1). At each site, samples were taken at three tidal levels parallel to the shore with similar exposure time: low intertidal level (LIL) 0.40 m above mean low tide (thereafter amlt), medium intertidal level (MIL) 0.55 m amlt and high intertidal level (HIL) 0.75 m amlt.
The seven sampling sites in the Mar Chiquita Coastal Lagoon, Argentina, South-west Atlantic.

Five sediment samples (cores of 5 cm diameter and 35 cm depth) were collected at each site and tidal level in January 2004. Organic matter content (OMC) of ~10 g subsamples was determined as the difference between dry weight (80°C to constant weight) and the ash weight (450°C for 8 h). Grain size frequency distribution was obtained by sieving a dried 400 g subsample through a series of five screens (screen sizes: 2000, 500, 250, 125, 62 µm). The null hypothesis of no difference in OMC and each grain size fraction along intertidal levels was evaluated by one-way ANOVA with a posteriori Tukey test (Zar, Reference Zar1999).
Tagelus plebeius distribution pattern, size structure and shell morphology
At each site the density of Tagelus plebeius was estimated by counting siphon holes on the sediment surface, a measure that approximates the number of bivalves reasonably well and is not disruptive to the intertidal environment (see Holland & Dean, Reference Holland and Dean1977a; Iribarne et al., Reference Iribarne, Valero, Martínez, Lucifora and Bachmann1998). Between five to ten randomly placed replicates of 0.25 m2 area were examined at each site and tidal level. The null hypothesis of no difference in the density of T. plebeius between intertidal levels was then tested by Kruskal–Wallis non-parametric analysis (Zar, Reference Zar1999) with multiple comparisons of mean ranks of all groups, as the assumptions for a parametric test were not fulfilled.
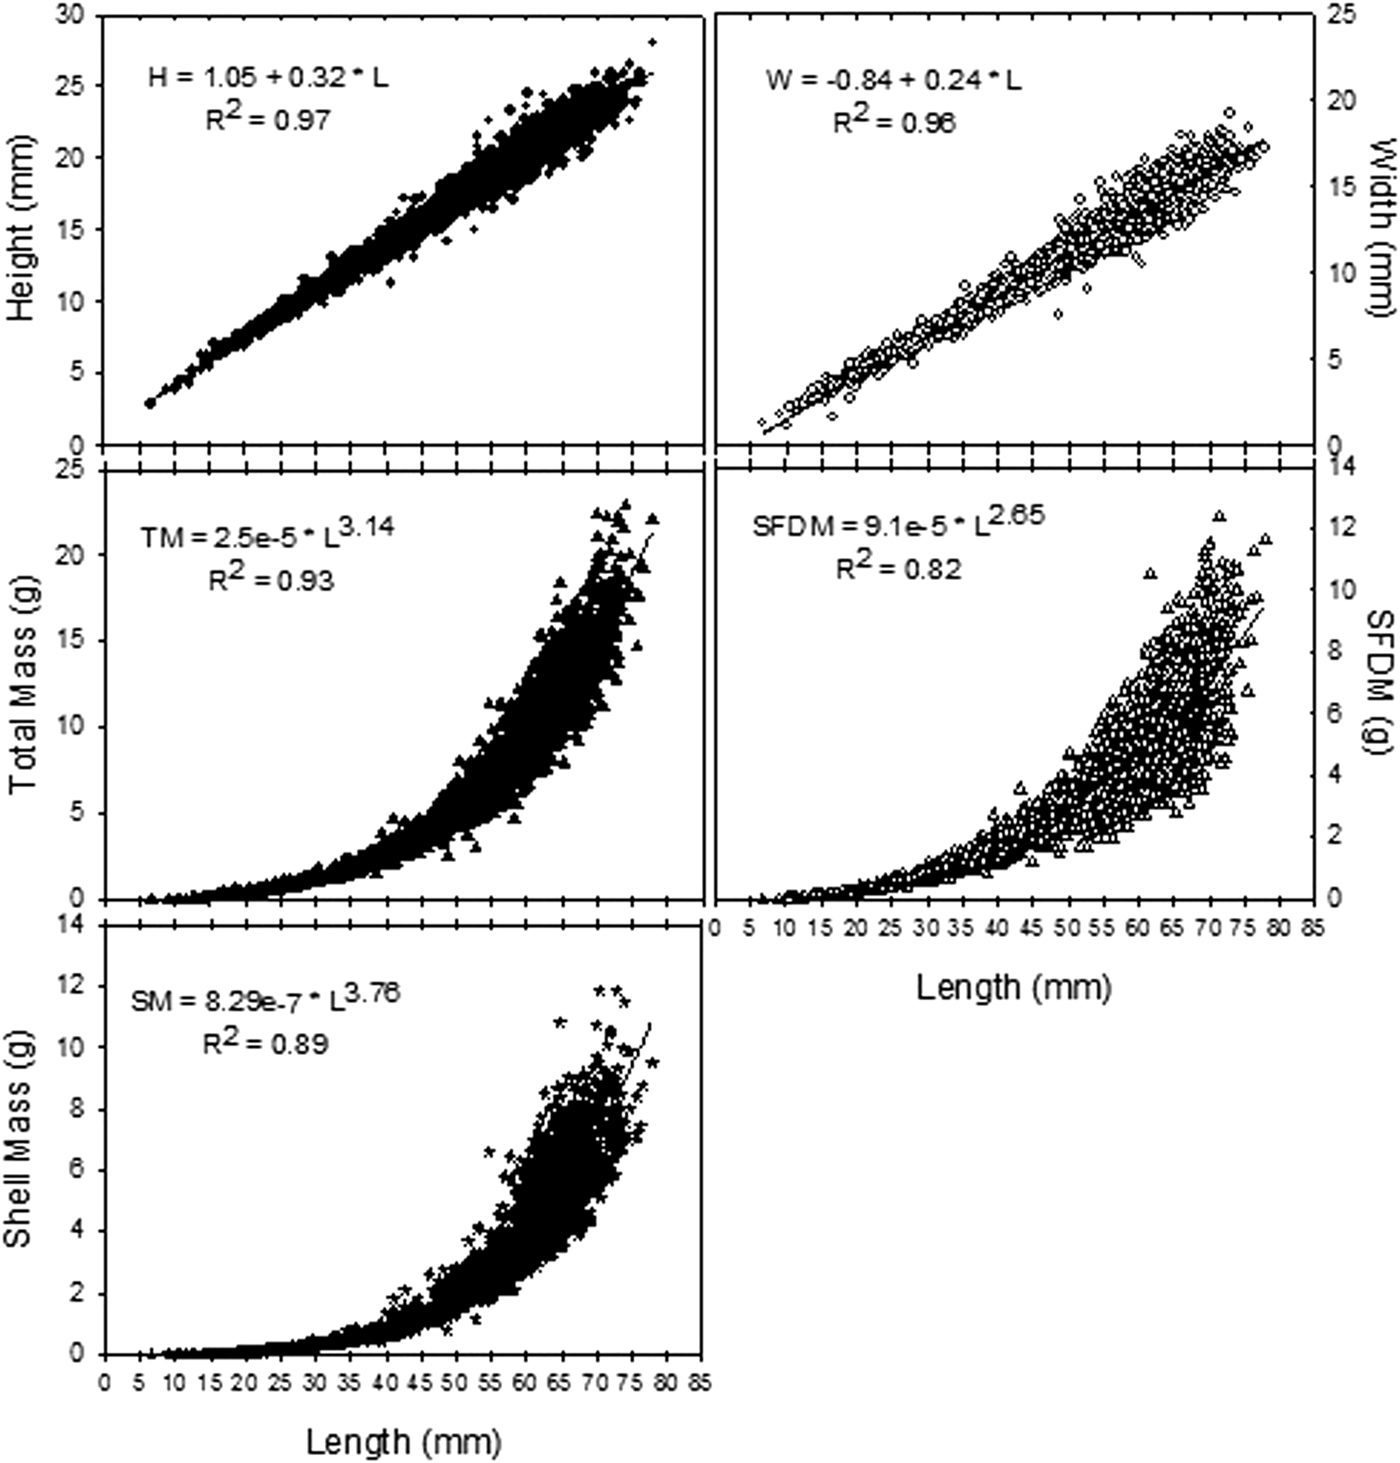
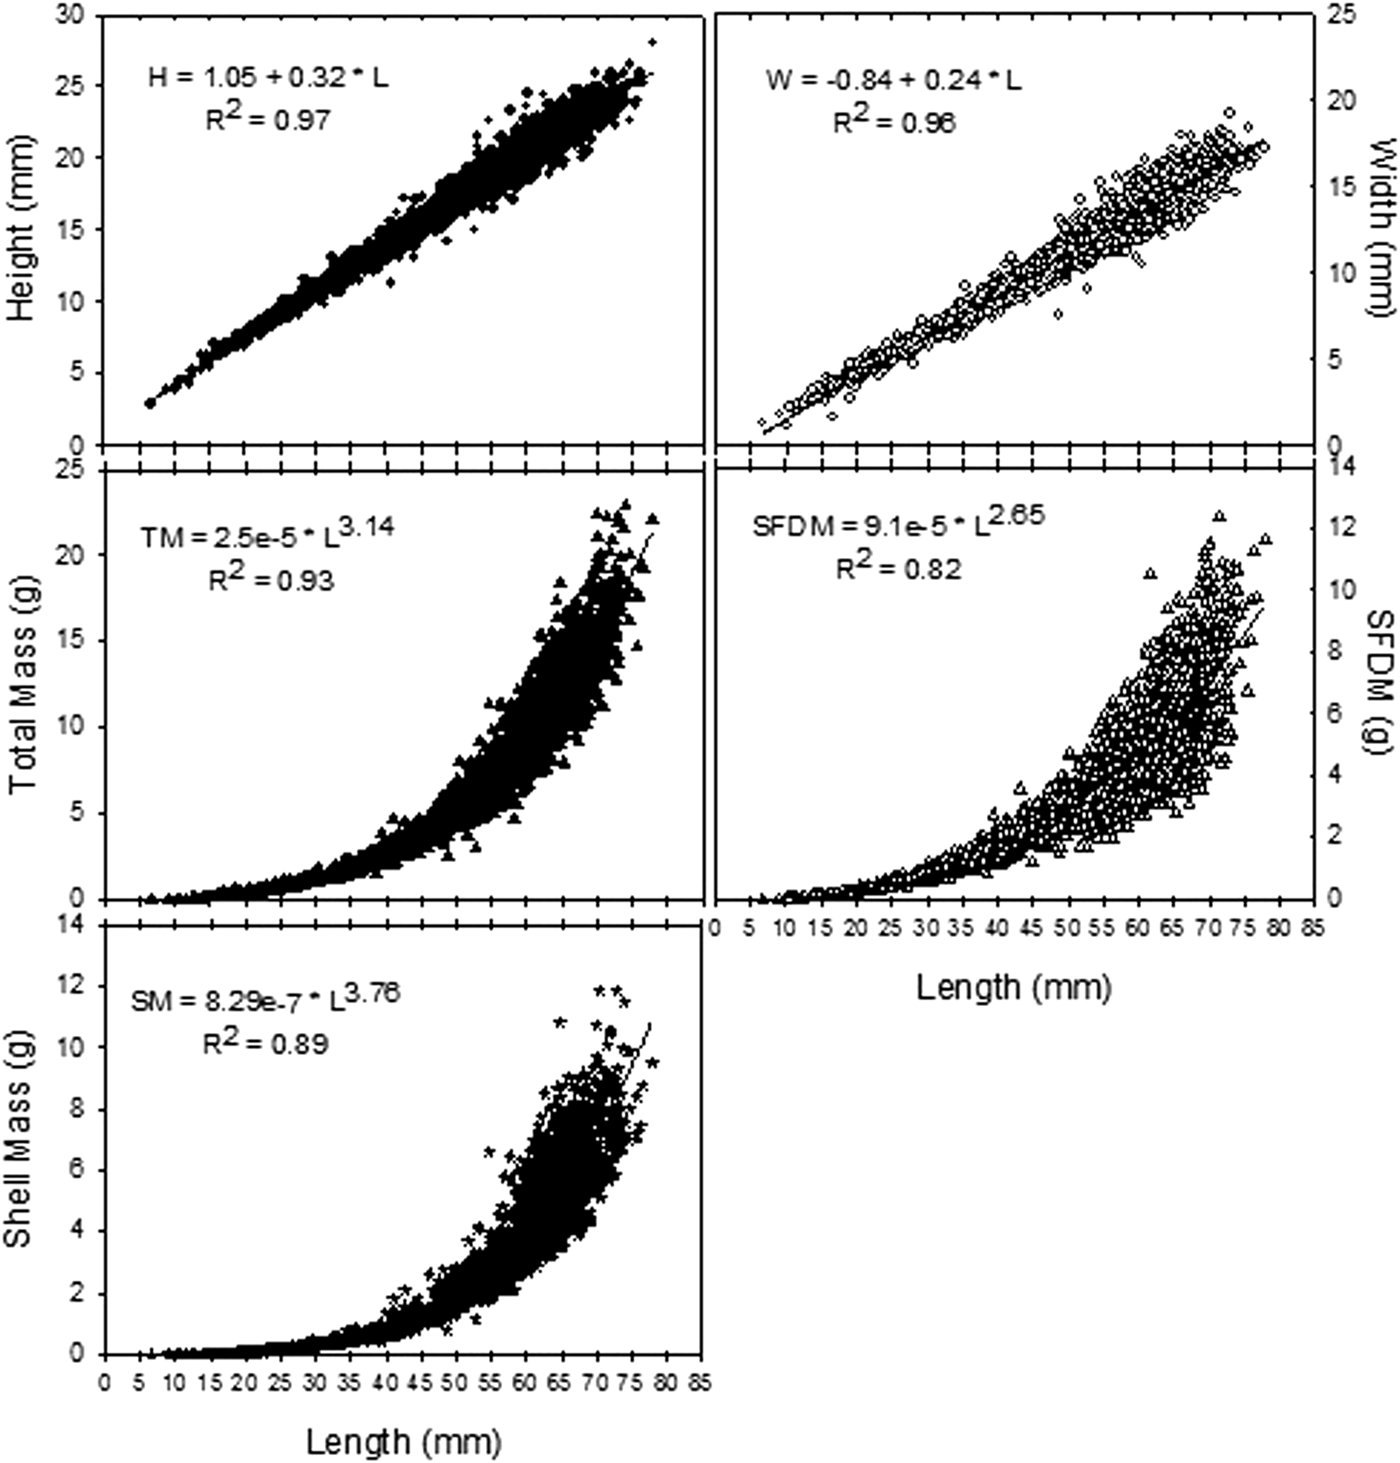
At each site, 30–100 bivalves (N = 2491) were collected by excavating the sediment using a shovel. Shell length (L; the anterior-posterior axis), height (H; from the umbo to the ventral margin), width (W; all with precision ± 0.1 mm), total Mass (TM) and shell mass (SM) were determined (precision ± 0.01 g). Then, the internal tissues were dried at 70°C to constant mass in order to obtain the shell free dry mass (SFDM; precision ± 0.001 g). The relations between H, L, W, TM, SM and SFDM were fitted to the best model (linear or exponential).
Internal shell growth pattern and growth rate of T. plebeius
Subsamples for growth analysis were obtained from each area and tidal level (N = 626). Individual age was inferred from internal shell growth bands (following Richardson, Reference Richardson2001) of the left valve. Each valve was embedded in polyester resin and sectioned along the axis of maximum growth in height (H) using a Bosch GDC 34 saw with a diamond blade. The cross-sections were polished on lapidary wheels using grits of 400, 600, 1200, 2400 and 4000 grade, and etched 14 min using 0.5% DE-CAL agent. Acetate peel replicates of the cross-sectioned surfaces were produced following Rhoads & Lutz (Reference Rhoads and Lutz1980) and examined microscopically. The number of internal translucent bands and the corresponding length were recorded as age-length data (following age validation in next section).
The von Bertalanffy growth model was fitted to the shell length-at-age data using:
 $$L_{\rm t} = L_\infty ({\rm 1}-e^{-k\;(t-t_{\rm 0} )} )[{\rm mm},\;{\rm y}]$$
where L ∞ is the asymptotic length, k is the growth constant, t the age and t 0 the age at zero length. To fit the model to the data, the maximum likelihood method was used (following Edwards, Reference Edwards1992; Hilborn & Mangel, Reference Hilborn and Mangel1997).
Additionally, in order to compare the growth across intertidal levels, the von Bertalanffy k, t 0 and L ∞ parameters from each intertidal level were compared by pair-wise comparisons using the Likelihood ratio test (Cerrato, Reference Cerrato1990), and bivariate confidence limits (Cl) for k, t 0 and L ∞ were built using profile likelihood (see Hilborn & Mangel, Reference Hilborn and Mangel1997).
Timing of growth band formation
Under stereomicroscopy, the internal shell growth bands can be identified as translucent and opaque bands (Jones et al., Reference Jones, Quitmyer, Arnold and Marelli1990). If major growth bands were formed annually, then one winter growth line (translucent band) should have been formed in the shell part grown during one year. Thus, the annual formation of internal shell growth bands was verified by a one-year tagging-recapture field experiment. Sixty individuals of varying size (40.5–63.25 mm L) were collected from MIL, measured and marked with numbered plastic labels adhered to the surface of the periostracum. The animals were then returned to the intertidal area and allowed to bury each in an individual enclosure consisting of a PVC tube (10 cm diameter and 50 cm height) open in the top that was vertically buried in the sediments. The wall of these tubes was perforated to allow for the horizontal flow of water through the enclosure. After one year the animals were recovered, the increment in length was determined, the internal shell growth pattern was examined using the acetate peel technique (see above) and the number of translucent and opaque growth bands formed during the experimental time was registered.
Additionally, the annual band formation (see Results section) was confirmed using trace element profiles derived by laser ablation – inductively coupled plasma – mass spectrometry (LA-ICP-MS) at Bremen University (Bremen, Germany). A shell was embedded in polyester resin and sectioned along the axis of maximum growth in height (H) and polished on lapidary wheels as described above. The section was rinsed with deionized water and allowed to dry in a clean hood. Shell material was ablated by a Finnigan 266 nm laser probe (settings: laser energy 1.0 mJ, pulse rate 5 Hz, beam diameter 40 µm) using helium as sample gas in the ablation cell (0.4 l min−1) and subsequent addition of argon as make-up gas (0.8 l min−1). The isotopes 43Ca and 88Sr were measured by a ThermoFinnigan (plasma power 1200 W, low resolution, 160 ms dwell time per isotope). We used the NIST610 glass standard reference for external calibration (Pearce et al., Reference Pearce, Perkins, Westgate, Gorton, Jackson, Neal and Chenery1997); external reproducibility for Sr/Ca of this standard was 1–2%. Samples were collected (N = 120) with an average distance of 65 µm along the growth trajectory until an annual band was reached that was too narrow to collect four or more samples. Every five samples the NIST610 standard was measured and a new calibration line established in order to compensate for instrument drift. The calculated Sr/Ca ratios were related to the position of the translucent and opaque bands in the shell and a t-test was made to test the null hypothesis of no difference in the mean Sr/Ca ratios between translucent and opaque bands (Zar, Reference Zar1999).
RESULTS
Sediment characteristics
Sediments of the different sites differed in a wide variety of physical properties.
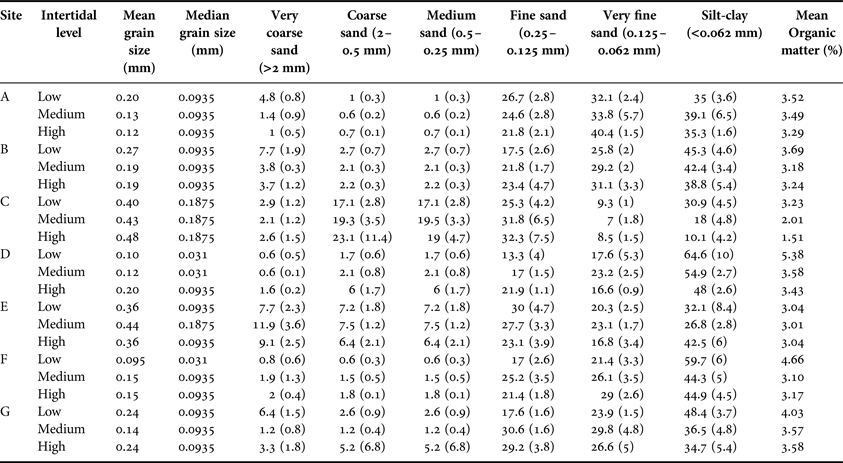
Median grain size diameter varied from 0.031 to >0.1875 mm, mean silt-clay content from 10.1 to 64.6% and the OMC from 1.51% in sandy sediments to 5.38% in the muddiest sediments (Table 1). Sediment organic matter content (OMC) was higher at LIL compared with MIL and HIL (3.94%, SD = 0.99 compared with 3.13%, SD = 0.82 and 3.04%, SD = 0.73 respectively, P < 0.05). The silt and clay sediment fraction <62 µm showed the same pattern as OMC (P < 0.05).
Granulometry of the different sampling sites in Mar Chiquita Coastal Lagoon.
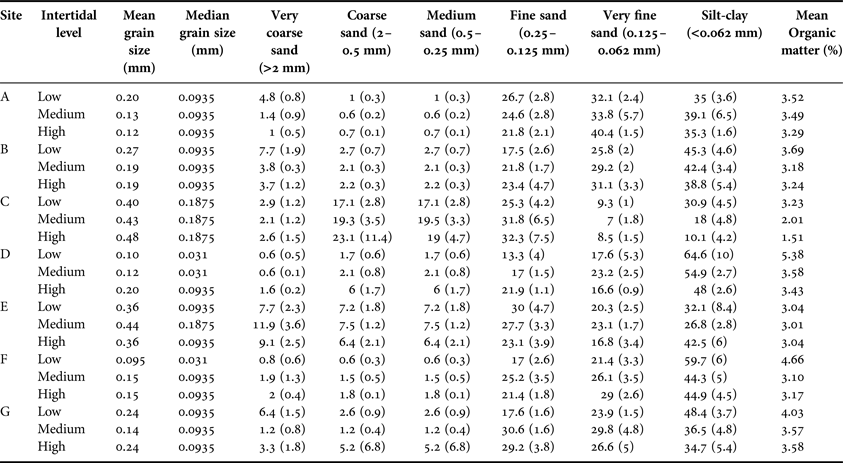
Values for sediment fractions are expressed in percentage.
Tagelus plebeius distribution pattern, size structure and shell morphology
The density of T. plebeius was higher at LIL with 61.18 individuals m−2 (95% CI = 54.34; 68.05) compared with MIL (mean = 23.54 ind m−2, CI = 15.76; 31.32) and HIL (mean = 27.14 ind m−2; CI = 12.15; 42.14; H (2;133) = 60.35, P < 0.05). Shell length ranged from 6.71 to 77.93 mm with a mean of 52.19 mm; SD = 14.40. The morphological relationships are shown in Figure 2.
Morphological relationships in Tagelus plebeius.
Tagelus plebeius individual growth
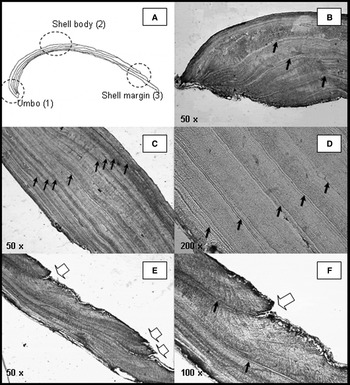
The internal shell cuts under stereoscopy and acetate peels technique under microscopy showed a pattern of alternating broad opaque and narrow translucent bands (Figure 3). The umbo is not well defined in this species thus, the internal growth bands showed a parallel pattern in this area (Figure 3B). It was possible to follow each translucent internal growth band from the umbo throughout the shell section (Figure 3C, D) to the point where it crosses the outer shell layer to form an external ring on the shell surface (Figure 3E, F). In the ventral (most recent) part of the valve, the internal growth bands were situated closer to the shell edge and more narrowly spaced (individuals > 40 mm L). These bands were clearly visible in acetate peels but very difficult to identify on the exterior shell surface.
(A) Scheme of the shell cross section of T. plebeius and acetate peels from (B) umbo, (C, D) body shell, (E, F) shell margin showing the internal growth bands all the way along a cross shell section (black arrows: translucent growth bands) and the point where translucent growth bands cross the outer shell layer to form an exterior ring on the shell surface (white arrows: exterior rings).

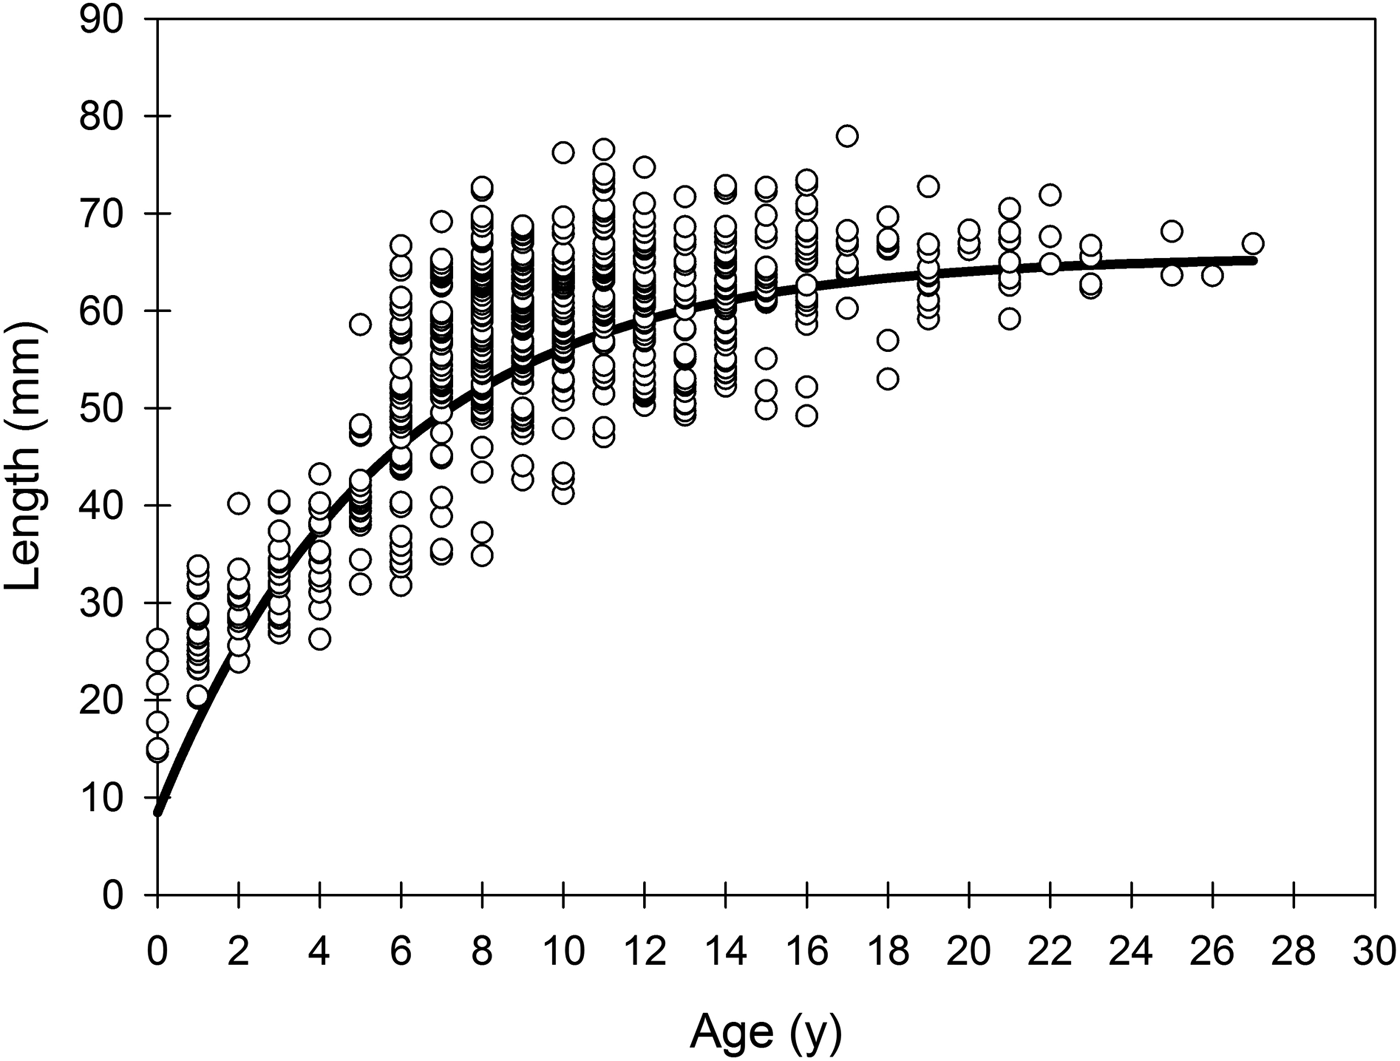
A von Bertalanffy model with L ∞ = 67.60 mm (95% CI = 64.55; 70.64), k = 0.181 year−1 (CI = 0.142; 0.218) and t 0 = −0.77 (CI = −1.46; −0.08; N = 626) described individual growth in the whole population best (Figure 4). The oldest animal found was 27 years old.
Size-at-age data and corresponding von Bertalanffy growth curve in Tagelus plebeius from Mar Chiquita coastal lagoon.

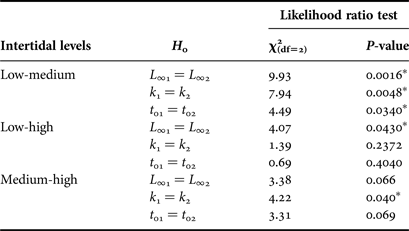
The comparison of the von Bertalanffy parameters from the three intertidal levels (Table 2), showed lower L ∞ at LIL than at MIL and HIL, lower k at MIL than at LIL and HIL, and higher t 0 at LIL than at MIL (Likelihood ratio test, P < 0.05; Table 3). The maximum age was higher at LIL (27 years old) than at MIL and HIL (23 years old).
Parameters of the general von Bertalanffy growth function with confidence limits (CI) at alpha 0.05 in Tagelus plebeius from the low, medium and high intertidal levels.

Results of Likelihood ratio test for pair-wise comparison for k, L ∞ and t 0 parameters between different intertidal levels.
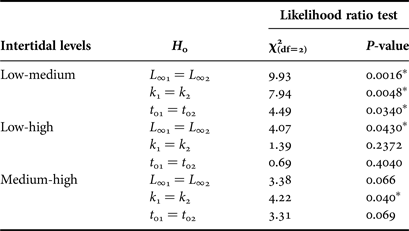
Asterisks indicate a significance of P < 0.05.
Timing of growth band formation
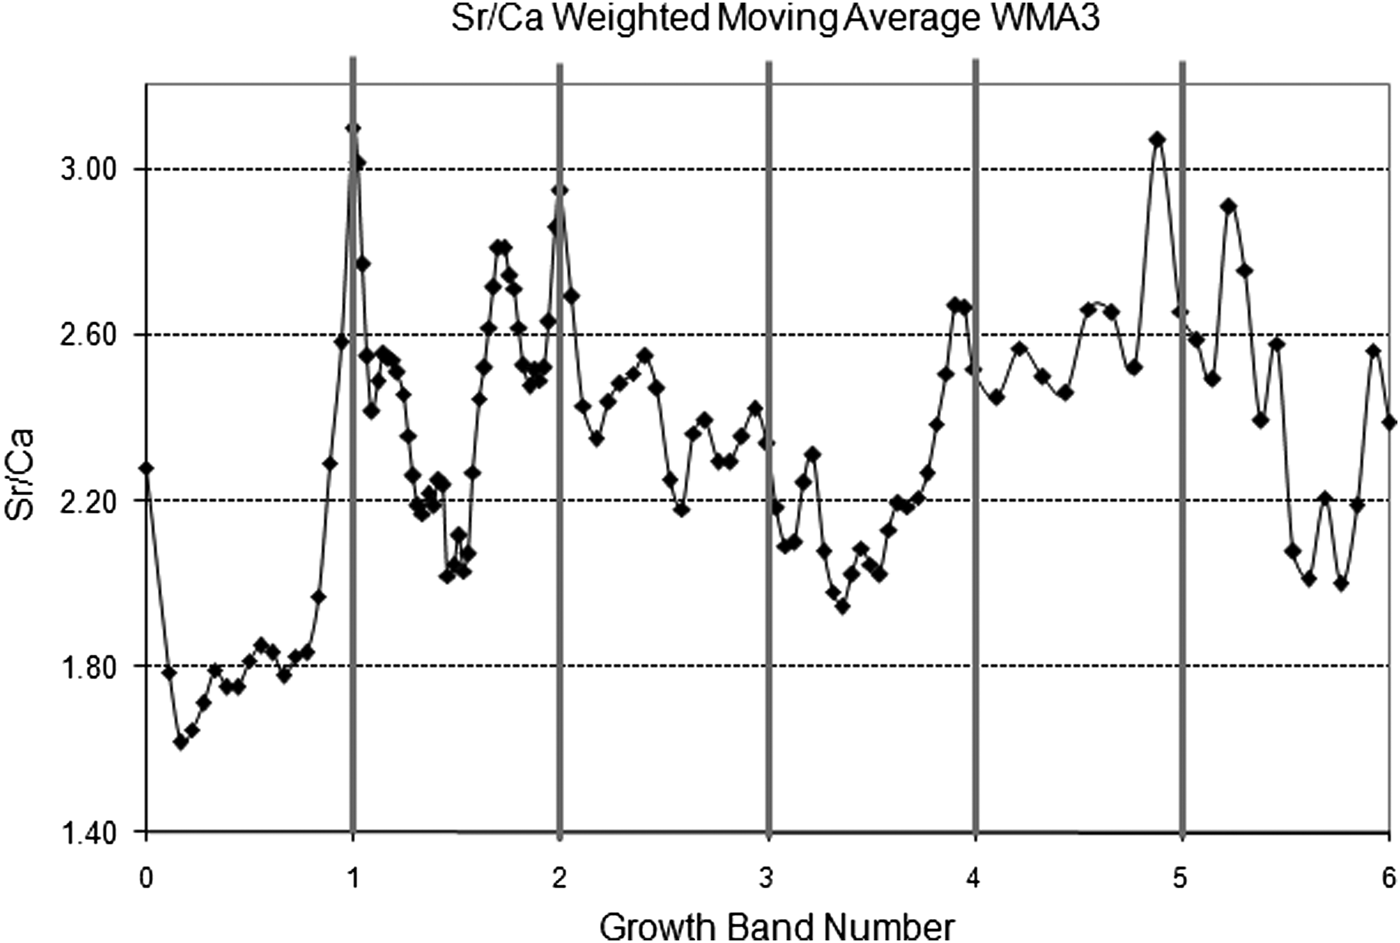
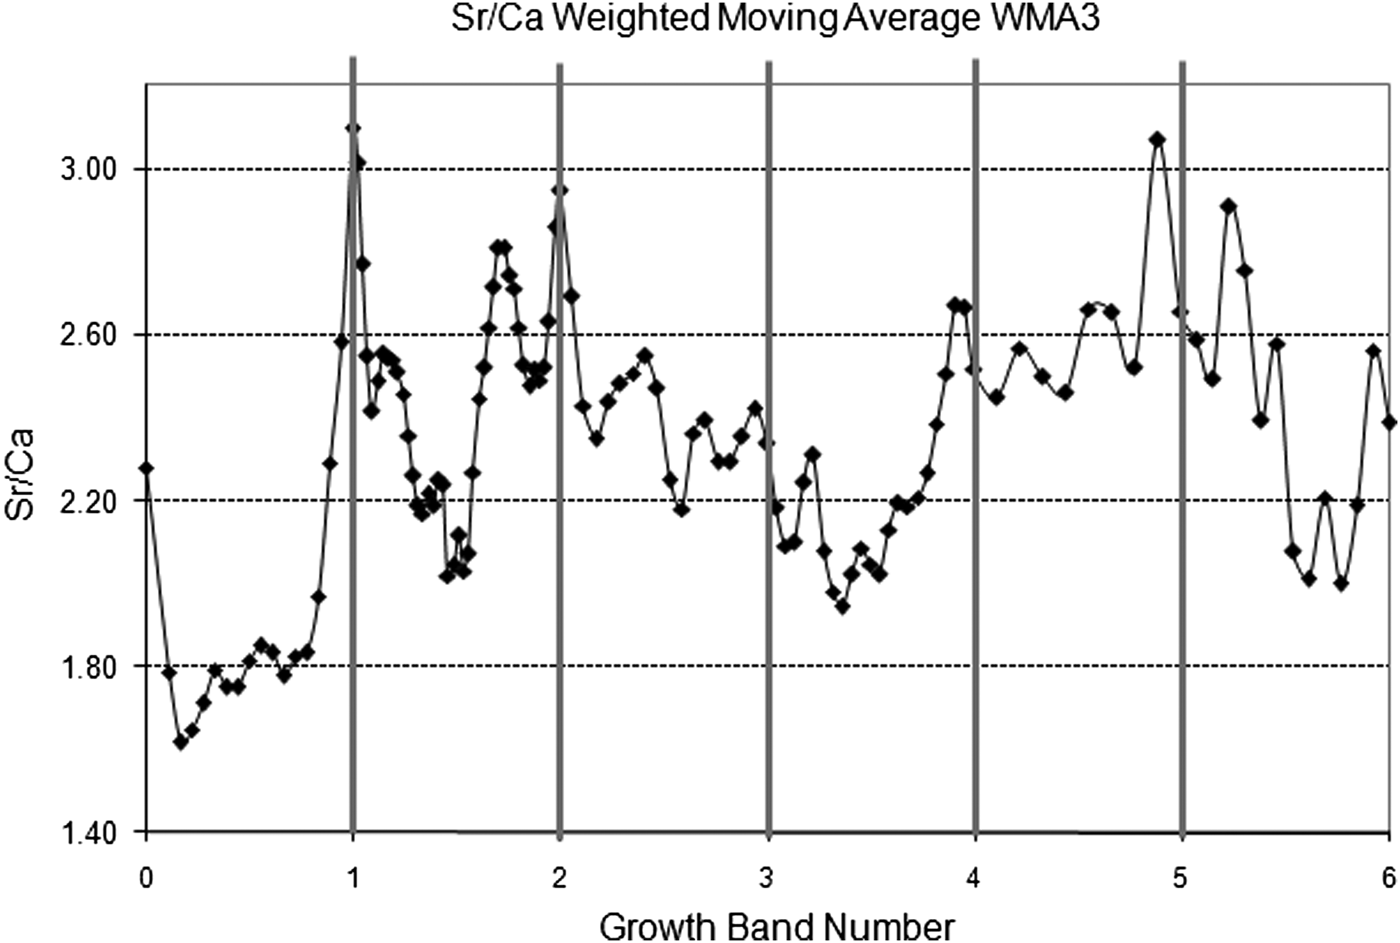
From the 60 individuals introduced in the tagging-recapture experiment only 31 survived after one year not showing individual migration across intertidal levels. Analysis of all surviving individual confirmed that one translucent growth band and one opaque growth band were formed each year. The Sr/Ca ratio ranged from 1.55 to 3.69 mmol mol−1 along the measurement transect, with higher values located at the translucent growth bands (mean = 2.66; SD = 0.34 mmol mol−1) compared with the samples from the opaque bands (mean = 2.31; SD = 0.36 mmol mol−1) (t-test118 = 2.92; P < 0.05; Figure 5).
Analysed Sr/Ca ratios from an individual of Tagelus plebeius 6 years old related to the position of translucent growth bands.
DISCUSSION
The population of Tagelus plebeius from Mar Chiquita coastal lagoon consisted of individuals of up to 27 years old, with shells up to 77.93 mm length. Comparison of density and growth parameters and maximum age between intertidal levels showed higher density, growth rate k, t 0 and maximum age and lower L ∞ at LIL than at MIL, associated with no difference in density and age between MIL and HIL.
Higher density of T. plebeius are commonly associated with muddy sediments of high organic content (e.g. Holland & Dean, Reference Holland and Dean1977a; Abrahão & Amaral, Reference Abrahão and Amaral1999; Lomovasky et al., Reference Lomovasky, Mendez Casariego, Brey and Iribarne2006; this study), while populations associated with sandy and muddy-sandy sediments show lower densities (Abrahão et al., Reference Abrahão, Cardoso, Yokoyama and Amaral2010; de Farias & Rocha-Barreira, Reference de Farias and Rocha-Barreira2012). The sediment characteristics could be an indicator of environmental stability and food availability for suspension feeding species, which are facilitated by fine sediments and high OMC (da Silva et al., Reference da Silva, Corte, Yokoyama, Rodrigues Abrahão and Zacagnini Amaral2015). Similarly, a higher growth index was associated to finer sand but higher OMC in different localities from Brazil (da Silva et al., Reference da Silva, Corte, Yokoyama, Rodrigues Abrahão and Zacagnini Amaral2015). The sediment at all sites sampled in the present study was composed of >10% silt-clay, reaching 64% in some areas. Thus, the whole tidal flat is composed of sandy-muddy and muddy sediments such as described at North Inlet estuary, South Carolina (33°20′N 79°10.0′W, USA) where these more stable sediments facilitate T. plebeius (Holland & Dean, Reference Holland and Dean1977a).
This study showed that T. plebeius has a pattern of alternating broad opaque and narrow translucent growth bands observed in internal shell cuts under stereoscopy and acetate peels under microscopy, which represent alternating periods of fast and slow shell growth respectively. Elevated Sr/Ca ratios along a shell coincide with translucent bands formed during winter as confirmed by our annual field experiment. This inverse relationship between Sr/Ca ratios and water temperature may render Sr/Ca a suitable indicator of the seasonal formation of growth bands in T. plebeius, as found in some further species with aragonite shells (Dodd, Reference Dodd1965; Surge & Walker, Reference Surge and Walker2006), but not in all species analysed so far (see Palacios et al., Reference Palacios, Orensanz and Armstrong1994; Freitas et al., Reference Freitas, Clarke, Kennedy, Richardson and Abrantes2005; Gillikin et al., Reference Gillikin, Lorrain, Navez, Taylor, André, Keppens and Dehairs2005; Schöne et al., Reference Schöne, Zhang, Radermacher, Thébault, Jacob, Nunn and Maurer2011).
The maximum lifespan of 27 years in the recent Mar Chiquita population is much higher than values reported for fossil shells from the same location (8 years, Isla & D'Andrea, Reference Isla and D'Andrea1993) and from different sites in Brazil, below 3 years at Enseada Beach (23°43′S 45°25′W) in São Sebastião (Abrahão et al., Reference Abrahão, Cardoso, Yokoyama and Amaral2010), and at Camaroeiro Beach (23°S 45°W) in Caraguatatuba Bay (da Silva et al., Reference da Silva, Corte, Yokoyama, Rodrigues Abrahão and Zacagnini Amaral2015). However, those studies evaluated growth rate and maximum age using shell size frequency analyses (Abrahão et al., Reference Abrahão, Cardoso, Yokoyama and Amaral2010; da Silva et al., Reference da Silva, Corte, Yokoyama, Rodrigues Abrahão and Zacagnini Amaral2015) and external growth rings (Isla & D'Andrea, Reference Isla and D'Andrea1993). Both methods are highly prone to underestimate age in long-lived species where annual growth increments may become quite small. In such cases, analysis of internal shell growth bands is the appropriate approach (Rhoads & Lutz, Reference Rhoads and Lutz1980; Richardson, Reference Richardson2001). Hence, only a proper re-analysis of the shells used in the previous studies will show whether we are dealing with an increase of maximum lifespan with decreasing ambient temperature, as observed in other bivalve species (e.g. Lomovasky et al., Reference Lomovasky, Lasta, Valiñas, Bruschetti, Ribeiro, Campodónico and Iribarne2008, Reference Lomovasky, Baldoni, Ribeiro, Alvarez, Lasta, Campodónico and Iribarne2011), or with a distinct underestimation of individual age in the previous studies. Although the difference between our analysis and those previously reported may lead to the hypothesis of changes in growth rate, we believe that it is most likely due to deficiencies of the used techniques.
Processes governing benthic populations along an intertidal gradient in soft sediment substrates had been studied in different systems (e.g. Peterson & Beal, Reference Peterson and Beal1989; Nakaoka, Reference Nakaoka2000; Beal, Reference Beal2006), in general determining a distribution pattern for bivalve species of higher density and higher shell growth rate in the low intertidal compared with the medium and high intertidal levels (Holland & Dean, Reference Holland and Dean1977b; Marsden & Weatherhead, Reference Marsden and Weatherhead1999; Gosling, Reference Gosling2003) related to physiological stress and/or biological interactions. In this sense, T. plebeius showed higher density at LIL than at MIL and HIL and this was correlated with higher percentage of OMC and muddy sediments at LIL (Lomovasky et al., Reference Lomovasky, Mendez Casariego, Brey and Iribarne2006 and this study). Similar results were found in the North Inlet estuary located near Georgetown, South Carolina (33″20′N 79″10′W) with higher density of T. plebeius in low intertidal (<200 ind m−2) and low density in the high intertidal (<5 ind m−2) (Holland & Dean, Reference Holland and Dean1977a), and in other filter feeder bivalves inhabiting intertidal areas (e.g. Crosby et al., Reference Crosby, Roberts and Kenny1991; Kingsley-Smith et al., Reference Kingsley-Smith, Harwell, Kellogg, Allen, Allen, Meritt, Paynter and Luckenbach2009; Lomovasky et al., Reference Lomovasky, Alvarez, Addino, Montemayor and Iribarne2014). Shell growth displayed a similar pattern across the intertidal, with faster growth at LIL compared with MIL, but no differences was observed between LIL and HIL. Distribution and growth patterns of bivalve species across tidal flats have been related to the level of physiological stress and to feeding restrictions that increase from low to high tidal levels (Dame, Reference Dame1972; Marsden & Weatherhead, Reference Marsden and Weatherhead1999; Gosling, Reference Gosling2003). In T. plebeius which did not show migration across the intertidal (Holland & Dean, Reference Holland and Dean1977b; this study), this hypothesis could explain the density patterns found (higher at LIL than at HIL) in part by differential adult mortality and/or survival of recruits. However, shell growth rate is higher both at HIL and LIL compared with MIL, which leads to the belief that other, yet unknown factors are likely to play a role here.
Biological interactions such as predation (e.g. Bartol et al., Reference Bartol, Mann and Luckenbach1999; Bologna & Heck, Reference Bologna and Heck1999; Nakaoka, Reference Nakaoka2000), competition (e.g. Peterson & Beal, Reference Peterson and Beal1989; Cognie et al., Reference Cognie, Haure and Barillé2006) and/or parasitism (e.g. Lim & Green, Reference Lim and Green1991; Taskinen, Reference Taskinen1998) can also affect bivalve distribution and size. Different biological interactions affect T. plebeius shell growth (e.g. with crabs, parasites, predators: Lomovasky et al., Reference Lomovasky, Gutiérrez and Iribarne2005, Reference Lomovasky, Mendez Casariego, Brey and Iribarne2006; with salt marsh plants: Addino et al., Reference Addino, Montemayor, Escapa, Alvarez, Valiñas, Lomovasky and Iribarne2015). In this sense, in the Mar Chiquita coastal lagoon the co-habiting of bivalves with the crab Neohelice granulata showed that this crab negatively affects the morphology and growth of T. plebeius differentially across the intertidal (Lomovasky et al., Reference Lomovasky, Mendez Casariego, Brey and Iribarne2006). Negative effects become stronger toward the low intertidal, where the burrowing and migrating of crabs may disrupt bivalve feeding and/or may force bivalves to invest more energy into escape movements and burrow rebuilding, thus leaving less energy for growth (Lomovasky et al., Reference Lomovasky, Mendez Casariego, Brey and Iribarne2006). In areas without crabs, there is a strong effect of intertidal level on morphology and growth showing the typical gradient of intertidal distribution, density and growth (see Lomovasky et al., Reference Lomovasky, Mendez Casariego, Brey and Iribarne2006). Thus, the crabs add an additional effect (although with the opposite gradient to the physiological stress); as we did not discriminate areas with and without crabs looking at the system as a whole this particular process was masked in our results. Additionally, a strong predation pressure by the American oystercatcher Haematopus palliates (Bachmann & Martínez, Reference Bachmann and Martínez1999) was observed in the study site. In this case a strong interaction with parasitism by the gymnophallid metacercariae, which increases the bivalves available for predators, was observed in the medium intertidal zone (see Lomovasky et al., Reference Lomovasky, Gutiérrez and Iribarne2005; Addino et al., Reference Addino, Lomovasky, Cremonte and Iribarne2010). Thus, the intertidal differences in growth rate are likely to be mediated by the presence of the crabs, parasitism and strong predation causing the slower growth rate at MIL found in this study. In conclusion, we hypothesize that the distribution pattern and razor clam characteristics reflect a response to the combined effects of the physical tidal stress gradient and strong biological interactions.
ACKNOWLEDGEMENTS
We thank Agustina Mendez Casariego, Cecilia Ravelli, Martin Bruschetti and Jorge Gutierrez (from UNMDP, Argentina) for field assistance and, Kerstin Beyer (from AWI, Germany) for technical assistance.
FINANCIAL SUPPORT
This project was supported by grants from Universidad Nacional de Mar del Plata (15/E214), FONCyT (PICT-2012-0402), CONICET (Argentina; PIP No. 424), and by the German-Argentinean Bilateral Cooperation Program in Science and Technology (BMBF: ARG02-002 and MinCyT: AL/PA02-BI/002 and AL/09/06).