INTRODUCTION
For centuries, sea cucumbers have been consumed as a luxury food item and also used as medicine in East Asian countries (Conand & Byrne, Reference Conand and Byrne1993; Akamine, Reference Akamine, Lovatelli, Conand, Purcell, Uthicke, Hamel and Mercier2004; Purcell, Reference Purcell, Lovatelli, Vasconcellos and Yimin2010; Purcell et al., Reference Purcell, Mercier, Conand, Hamel, Toral-Granda, Lovatelli and Uthicke2013). The constant increase of the market demand led to the overexploitation of traditional fishing grounds and the global expansion of this fishery, which progressively includes new and less valuable species from both tropical and temperate environments (Guzmán et al., Reference Guzmán, Guevara and Hernández2003; Conand, Reference Conand, Lovatelli, Conand, Purcell, Uthicke, Hamel and Mercier2004; Toral-Granda et al., Reference Toral-Granda, Lovatelli and Vasconcellos2008; Anderson et al., Reference Anderson, Flemming, Watson and Lotze2011; Eriksson & Byrne, Reference Eriksson and Byrne2013). Population declines have generated growing interest in understanding sea cucumber reproductive biology. This knowledge would allow the formulation of effective fisheries management strategies, taking steps towards conservation and to generate aquaculture initiatives and improvements (Purcell, Reference Purcell, Lovatelli, Vasconcellos and Yimin2010, Reference Purcell2014; Zamora et al., Reference Zamora, Yuan, Carton and Slater2016), supporting a global industry estimated at US$130 million in 2001 (Vannuccini, Reference Vannuccini, Lovatelli, Conand, Purcell, Uthicke, Hamel and Mercier2004).
In Chile, two sea cucumber species – Pattalus mollis Selenka, 1868 and Athyonidium chilensis (Semper, 1868) (Larraín, Reference Larraín1995) – were introduced to the fishery in the early 1990s without management regulation, despite the recommendation by the Food and Agriculture Organization of the United Nations (FAO) of applying a precautionary approach to fisheries of species that lack basic biological information (Toral-Granda et al., Reference Toral-Granda, Lovatelli and Vasconcellos2008). Of these two species A. chilensis is the most heavily exploited, particularly in southern Chile. Records indicate that peak catches occurred in 2000 (~1500 t), falling drastically in subsequent years (Sernapesca, 2013). To ensure the supply of this increasingly sought-after product, A. chilensis has been proposed by fishers as a target species for the development of a sustainable fishery inside Management and Exploitation Areas for Benthic Resources (MEABRs) (Stotz, Reference Stotz2007), a co-management approach similar to the internationally known territorial user rights for fisheries (TURFs) (Fernández & Castilla, Reference Fernández and Castilla2005; Gelcich et al., Reference Gelcich, Godoy, Prado and Castilla2008, Reference Gelcich, Hughes, Olsson, Folke, Defeo, Fernández, Foale, Gunderson, Rodríguez-Sickert, Scheffer, Steneck and Castilla2010).
Athyonidium chilensis ranges over 3800 km from Perú to southern Chile (18°S–42°S) (Pawson, Reference Pawson1964, Reference Pawson1969). It inhabits exposed rocky intertidal and shallow subtidal areas, especially where the algae Macrocystis spp. are present (Pawson, Reference Pawson1964, Reference Pawson1969). Athyonidium chilensis is gonochoric and the larvae have lecithotrophic development (Guisado et al., Reference Guisado, Carrasco, Díaz-Guisado, Maltrain and Rojas2012). Despite the species broad distribution there are few unpublished reproductive studies (Caffi, Reference Caffi1981; Moreno, Reference Moreno2002), an obstacle towards developing good management practices. There is also a special need to extend the A. chilensis study distribution, given sea cucumbers can exhibit different reproductive patterns within their latitudinal range (Sewell, Reference Sewell1990; Chao et al., Reference Chao, Chen and Alexander1995; Ramofafia et al., Reference Ramofafia, Byrne and Battaglene2003; Shiell & Uthicke, Reference Shiell and Uthicke2006).
Here we provide information on the reproductive biology of A. chilensis in its southern distribution to support initiatives for fisheries management and conservation. We investigated (1) body gravimetric relationships; (2) breeding pattern through gonad index and gonadal histological analysis for both sexes; (3) macroscopic appearance of A. chilensis gonad; (4) size at first sexual maturity; and (5) fecundity.
MATERIALS AND METHODS
Sample collection and processing
Individuals of Athyonidium chilensis were collected on a monthly basis from the rocky intertidal zone of ‘La Misión’ beach, Valdivia, Chile (39°47′43.73″S 73°23′57.35″W), from May 2007 to April 2008. As A. chilensis does not display external sexual dimorphism, an attempt was made to collect 20 large individuals (~10–25 cm total length) monthly to ensure that adults from both sexes were represented in the sample. At the time of the study, size at first maturity was unknown. To estimate this parameter we also collected the smallest individuals encountered in our monthly samplings. Once size at first maturity was estimated, only individuals above that size which showed mature gametes in histological sections were considered for maturity histograms and gonad index (GI) calculations. Sampled specimens were placed in individual plastic bags and transported in a cooler box to laboratories at Universidad Austral de Chile. Each individual was relaxed for 30 min by injecting 15 ml of 10% MgCl2 into the coelomic cavity (Hewatt, Reference Hewatt1943). Relaxed total length (Tl) was obtained measuring from the base of the oral tentacles to the anus (±1 mm). A longitudinal incision was made along the dorsal surface of the body, the coelomic fluid was drawn off, and drained body weight (sensu Conand, Reference Conand1981) (Dw) was determined. Tl and Dw were obtained from half of the sampled individuals during the study period. For all collected individuals, the gonad was removed, drained and weighed (Gw) (±0.05 g). The animals were sexed; female gonads are olive green and male gonads are creamish to orange (Caffi, Reference Caffi1981). Gonads were preserved in buffered 6% formalin for 2 months, rinsed in tap water and transferred to 60% ethanol for further storage until micro and macroscopic analysis. We also recorded the eviscerated body weight (Ew) (±0.05 g), which corresponded to the body wall weight, excluding internal organs.
PHYSICAL CHARACTERISTICS AND BODY GRAVIMETRIC RELATIONSHIPS
Ew was used as a reference measure to determine whether Dw or Tl could be accurate size estimators for live individuals of A. chilensis. For this we explored possible sex effects on regression slopes and intercepts through an analysis of covariance (ANCOVA) and performed Model II Reduced Major Axis (RMA) linear regression analysis. Homogeneity of variances and normality assumptions were checked using Levene and Shapiro–Wilk tests.
GONAD INDEX
Mean monthly GI was calculated for females and males through the year as GI = (Gw/Ew) × 100. Before conducting ANOVA to assess the effect of months and sex over the variation of GI values we checked model assumptions as described above. After arcsine transformation, homogeneity of variance between months in GI was not achieved. However, given the robust nature of ANOVA, we used untransformed data to explore single and combined effects of sex and months over GI (two-way ANOVA) followed by single factor Welch-ANOVA and Games-Howell post-hoc test to establish pairwise comparisons of means (Quinn & Keough, Reference Quinn and Keough2002).
GONAD MICROSCOPIC ANALYSIS
Athyonidium chilensis single gonad consists of two bilaterally symmetrical tufts of branched tubules arising from the gonad basis, divided by the dorsal mesentery and attached to the anterior body wall (Caffi, Reference Caffi1981). Holothurian gonad morphology and maturation can differ between species and even populations (Sewell, Reference Sewell1992; Hamel & Mercier, Reference Hamel and Mercier1996a; Sewell et al., Reference Sewell, Tyler, Young and Conand1997). In general, gonad tubules can be all of similar size and contain gametes at similar stages of maturity or they can be found as tubule cohorts of different size containing gametes at different stages of maturity, the latter known as the tubule recruitment model (TRM) (Smiley, Reference Smiley1988; Sewell, Reference Sewell1992; Hamel & Mercier, Reference Hamel and Mercier1996a; Sewell et al., Reference Sewell, Tyler, Young and Conand1997). In this study we did not directly assess the dynamics of gonad maturation in A. chilensis. However, we haphazardly removed 15 tubules from the central portion of each male and female gonad. The central portion of the gonad contains the biggest-sized gonad tubules, known in holothurians to be involved in the current-year spawning and to contain the most mature generation of gametes (Hamel & Mercier, Reference Hamel and Mercier1996a; Shiell & Uthicke, Reference Shiell and Uthicke2006). In case the gonad was too small, the entire gonad was processed according to standard histological techniques, sectioned (6 µm thick) and stained with haematoxylin and eosin. Based on previous studies (Sewell, Reference Sewell1992; Ramofafia et al., Reference Ramofafia, Battaglene, Bell and Byrne2000, Reference Ramofafia, Byrne and Battaglene2003), gametogenic stages were assigned to sexually mature individuals based on observations of the germinal epithelium, gonad component cells and their staining properties. Five gametogenic stages were defined: spent (stage I); recovery (stage II); growing (stage III); mature (stage IV); and partly spawned (stage V). The percentage of individuals at each maturity stage was determined for each monthly sample, and monthly spawning frequency was calculated, corresponding to the percentage of individuals with gonads in spawning stages (partly spawned V and spent I). Spawning periods were determined based on months where spawning frequency was over 25% (modified from Chao et al., Reference Chao, Chen and Alexander1995).
GONAD MACROSCOPIC ANALYSIS
We investigated the effect of sex and maturity stages on variations on the length, diameter and bifurcation of gonad tubules. For this, 15 tubules were removed from the gonad as described above and tubule bifurcation, length and diameter were recorded using an electronic caliper (±0.1 mm). Diameter measurements were taken from the mid-length of the tubule. At stages IV (mature) and V (partially spent), male gonad tubules acquired a ‘beaded’ appearance throughout their length. Diameter measurements were taken from the mid-section of the beaded portions. The effect of sex and maturity stages and their interaction over tubule bifurcation, length, diameter and gonad weight were assessed using two- and one-way ANOVA followed by Tukey–Kramer's unplanned multiple comparisons of harmonic means. Model assumptions were checked as previously indicated.
SIZE AT FIRST MATURITY
To estimate size at first sexual maturity, defined as the eviscerated weight at which 50% of the individuals were gametogenically mature (Ew(50)) (Conand, Reference Conand1981, Reference Conand1993b; Abdel-Razek et al., Reference Abdel-Razek, Abdel-Rahman, El-Shimy and Omar2005; Toral-Granda & Martínez, Reference Toral-Granda and Martínez2007), the Ew of males and females were plotted against their maturity condition as determined by histology. A binomial code was assigned to each individual (0 = juveniles; 1 = adults), where animals in maturity stages I, II, III, IV and V that had mature gametes on histological sections were considered adults. A logistic regression was fitted to the data and parameters a (intercept) and b (slope) were estimated through ln[y/(1 − y)] = a + b(x). We tested for model significance using Likelihood-ratio tests (Quinn & Keough, Reference Quinn and Keough2002).
FECUNDITY
Fecundity was estimated for 12 mature females (stage IV) using a gravimetric method. For each female, three subsamples of known weight (±0.0001 g) were taken from the middle length of the gonad tubules. Oocytes were squeezed out from the subsamples leaving the tubule lumen empty and vitellogenic oocytes were counted using a dissecting microscope. An average number of oocytes per gram of gonad (
 $\overline x $
oc) was calculated for each female. Absolute fecundity (FA) was calculated according to FA =
 $\overline x $
oc * Gw (g). Calculations on relative fecundities with respect to: drained body weight (as FRDw = FA/Dw), eviscerated body weight (as FREw = FA/Ew) and gonad weight (as FRGw = FA/Gw) were performed (Conand, Reference Conand1993a; Abdel-Razek et al., Reference Abdel-Razek, Abdel-Rahman, El-Shimy and Omar2005; Toral-Granda & Martínez, Reference Toral-Granda and Martínez2007). Mean fecundities for the 12 measured females are reported (
 $\overline x $
FA,
 $\overline x $
FRDw,
 $\overline x $
FREw,
 $\overline x $
FRGw). For each female, the diameter of 10 vitellogenic oocytes was measured to the nearest micrometer using an eyepiece reticle calibrated to a dissecting microscope; the mean oocyte diameter of the 12 females was calculated.
All statistical analyses were performed using JMP® 10.0.2 statistical software (SAS Institute Inc.) except for the Games–Howell post hoc tests for which we used SPSS® 21 statistical software (IBM), and Model II Reduced Major Axis (RMA) linear regression analysis and ANCOVA which were performed in RStudio (RStudio Team, 2015).
RESULTS
The sampled population
During the entire year of study (May 2007–April 2008), a total of 277 individuals of A. chilensis were sampled from ‘La Misión’, including juvenile and sexually mature individuals. Numbers of sexually mature individuals in the samples varied monthly, females ranging from 3 to 13 (mean: 9 ± 2.5 SD) and males ranging from 5 to 13 (mean: 8.7 ± 2.3 SD).
PHYSICAL CHARACTERISTICS AND BODY GRAVIMETRIC RELATIONSHIPS
Athyonidium chilensis physical parameters are presented in Table 1. Males and females had similar mean total length (Tl) (ANOVA, F (1, 101) = 0.58, P = 0.449), eviscerated weight (Ew) (ANOVA, F (1, 210) = 0.02, P = 0.894), drained weight (Dw) (ANOVA, F (1, 101) = 0.84, P = 0.363) and gonad weight (Gw) (ANOVA, F (1, 210) = 1.92, P = 0.168). There were no statistically significant differences in the sex ratio of mature individuals during the study period (Pearson χ2 (1) = 0.76; P = 0.78; N = 212).
Somatic physical characteristics of mature individuals of A. chilensis (females N = 108, males N = 104).

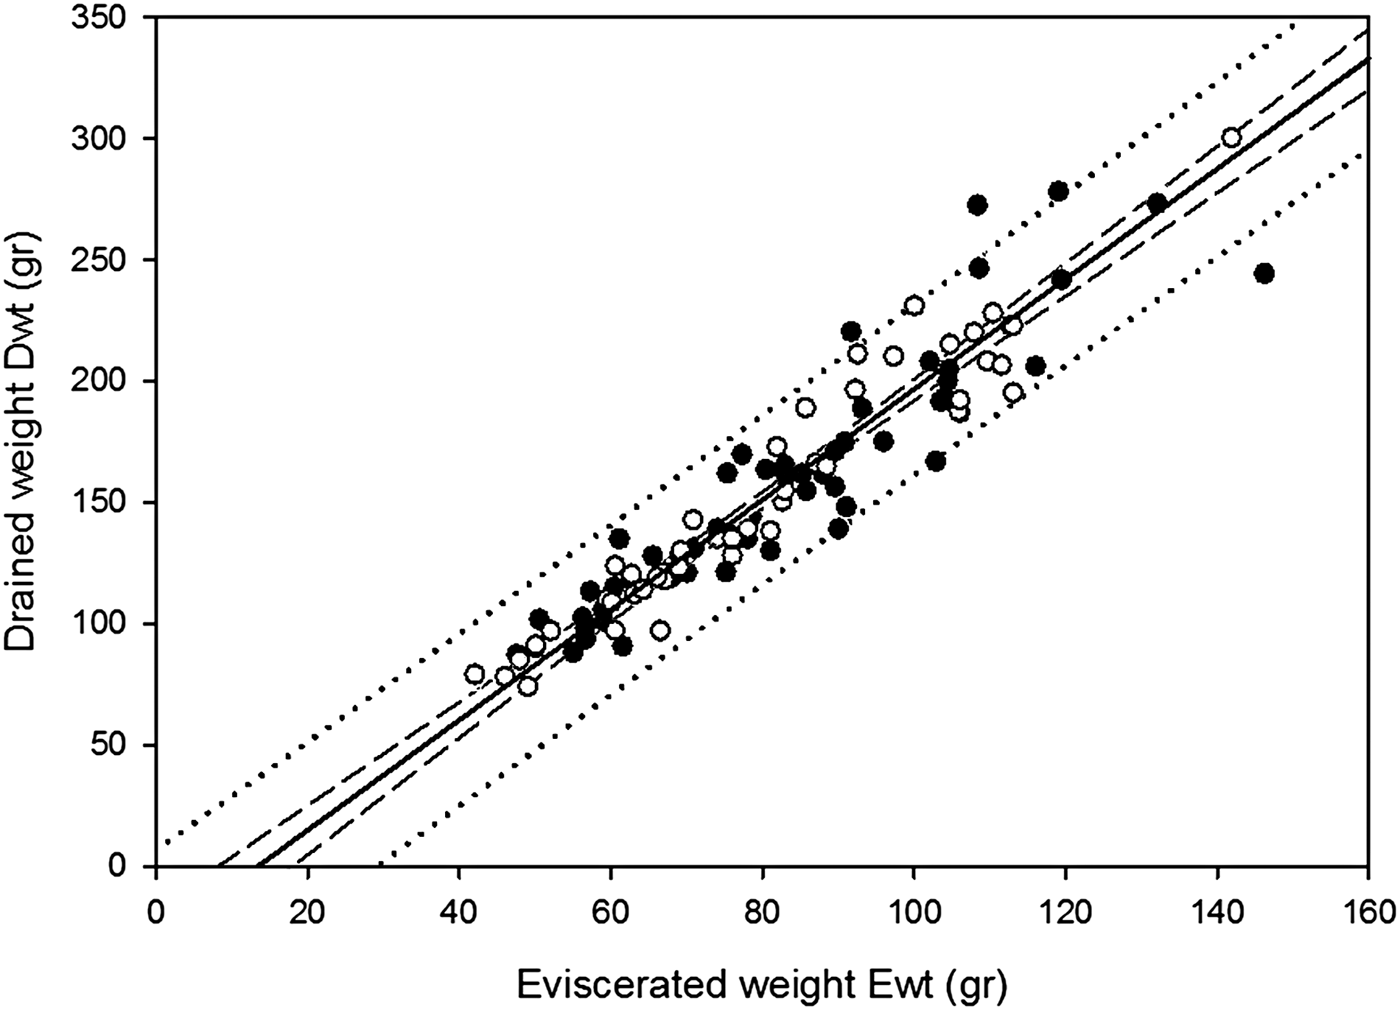
The slopes and intercepts of male and female regression lines for the relationship between Ew and Dw were not significantly different (F (1, 99) = 0.517, P = 0.474 and F (1, 100) = 0.153, P = 0.697, respectively). The same situation was observed for the relationship between Ew and TL (F (1, 99) = 0.508, P = 0.222 and F (1, 100) = 0.036, P = 0.850, respectively). After fitting a single regression line for each relationship, Dw was a much more reliable estimator of animal size than TL (r 2 = 0.89; P < 0.001 and r 2 = 0.29; P < 0.001, respectively) (Figure 1).
Relationship between drained weight and eviscerated weight of A. chilensis. Solid line represents best fit Model II RMA regression y = −30.576 + (2.273 × x), r 2 = 0.89, P < 0.001 for males (empty circles) and females (filled circles) combined. Dashed lines represent 95% mean confidence interval and dotted lines represent 95% individual confidence interval.

GONAD INDEX (GI)
The annual mean GI was 18.3% (±11% SD) and 20.8% (±10.3% SD) for sexually mature females and males respectively. Throughout the year, monthly mean GI was above 11% for both sexes. However, there were high monthly variations on the GI between individuals, reaching values as low as 1.1% for a sexually mature female at the spent stage (stage I, Gw: 0.63 g, Ew: 57 g, October 2007) and 4.3% for a sexually mature male at the same stage (stage I, Gw: 2.5 g, Ew: 58.5 g, March 2008). GI reached values as high as 64.4% for a female at the mature stage (stage IV, Gw: 59.1 g, Ew: 92 g, September 2007) and 46.21% for a male at the same stage (stage IV, Gw: 44.98 g, Ew: 97.33 g, August 2007). The smallest gonad weights recorded for sexually mature individuals were 0.63 g for females (stage I, GI: 1.1%, Ew: 57 g, October 2007) and 2.5 g (stage I, GI: 4.3% Ew: 58.5 g, March 2007) for males, while the highest gonad weights recorded were 60.9 g (GI: 36.5%, Ew: 167 g, April 2008) for males and 67.1 g (GI: 56.3% Ew: 119 g, July 2007) for females.
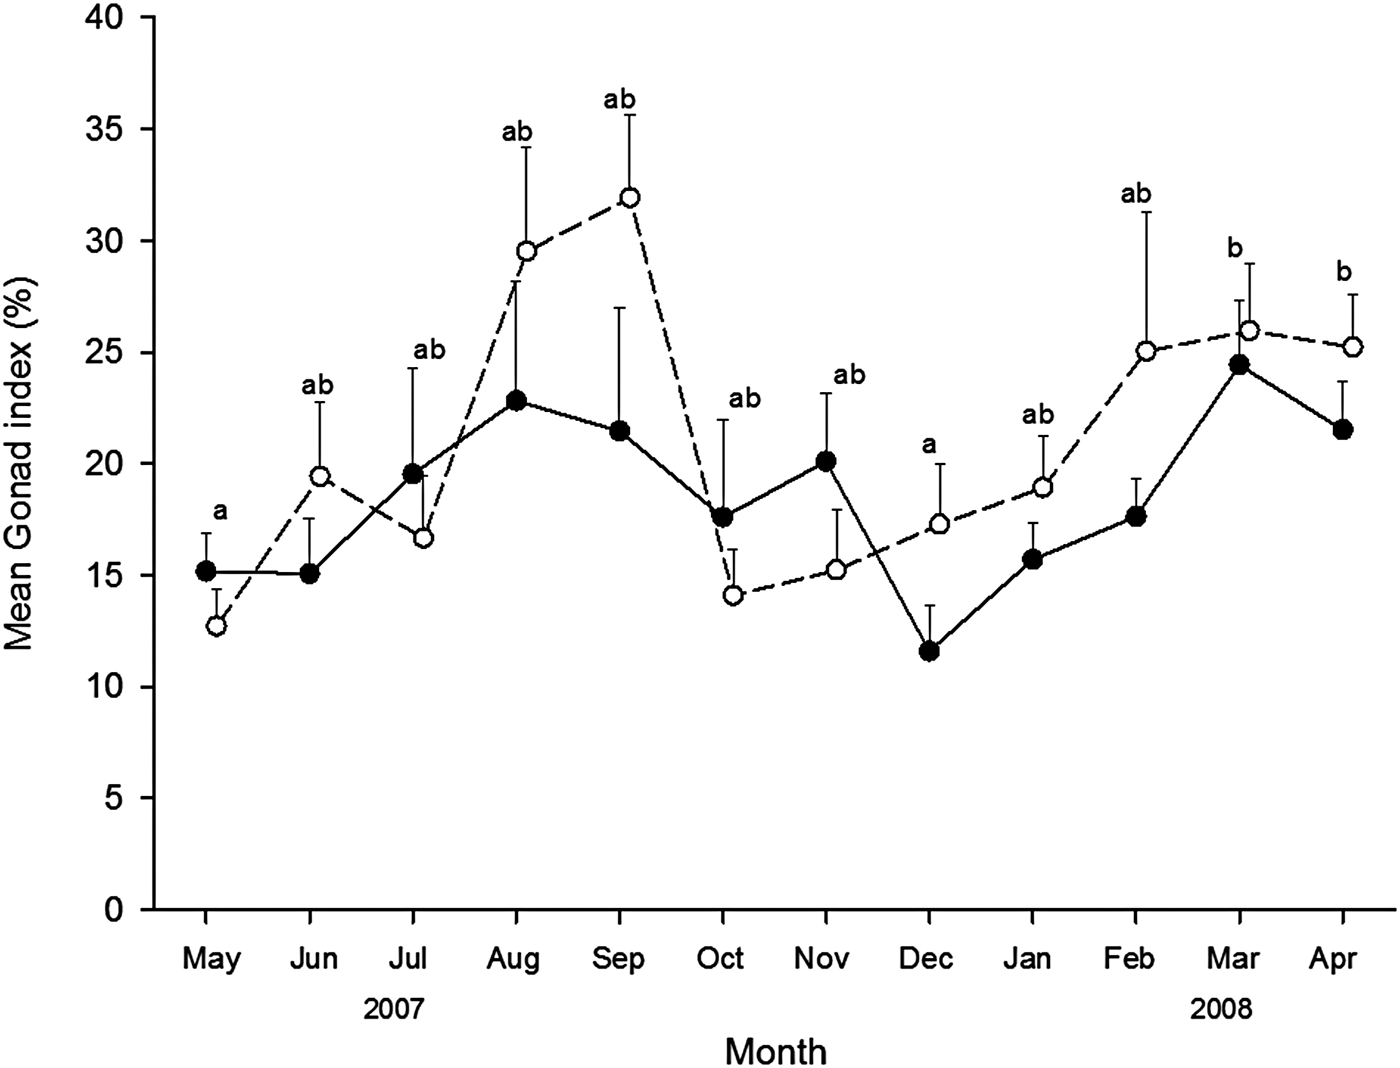
The GI dynamic through the year was similar between males and females (sex×month, two-way ANOVA, F (11, 188) = 0.937, P = 0.506) (Figure 2), and there was no statistically significant difference on the yearly mean GI between sexes (Welch's ANOVA, F (1, 209.9) = 2.72, P = 0.101). However, mean GI varied significantly between months (Welch's ANOVA, F (11, 77.7 = 3.87, P = 0.002), with the most important difference found between December 2007 and March–April 2008 (Figure 2). In general, GI was low at the end of autumn (May 2007) and increased during austral winter (Figure 2). High GIs occurred in August and September 2007 (females and males respectively), decreasing through spring to reach minimum values in October 2007 for males and December for females. The GI recovered again in summer showing high GI values in March 2008 for both sexes, followed by a slight decline in April 2008 (Figure 2). The variability on monthly GI was generally high; it was higher during months with high mean GIs and was lower during months with low mean GIs (Figure 2).
Athyonidium chilensis gonad index (GI) through the year. Males (empty circles) and females (filled circles). Letters above bars indicate post-hoc test results for the effect of month in two-way ANOVA (month, sex). Points that do not share the same letter indicate significant differences. Bars indicate standard error.

GONAD MICROSCOPIC ANALYSIS
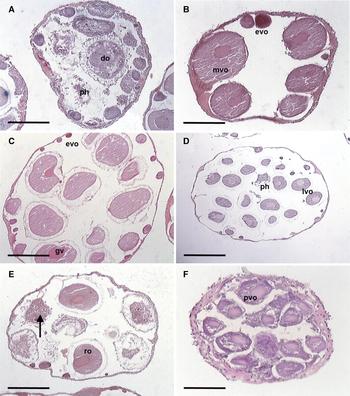
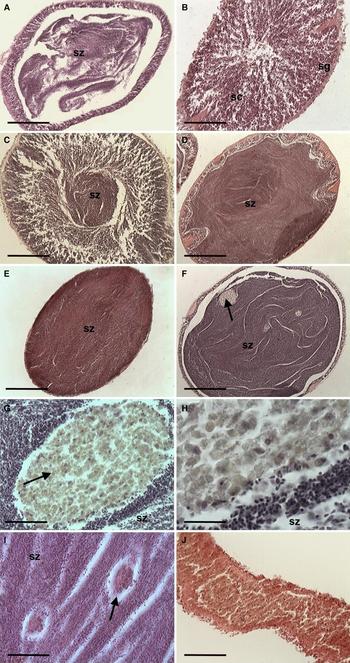
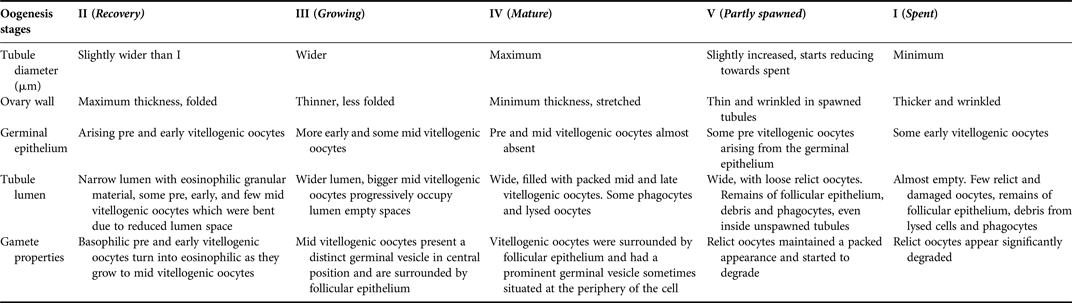
For males and females at stage I (spent) tubule diameter was the smallest and gonad wall thickness started increasing compared with stage V (partly spawned) (Figures 3A & 4A). Gonad tubules had a fairly empty lumen, except for a few relict gametes and debris, and it was possible to observe signs of increased gametogenic activity; pre-vitellogenic oocytes and spermatogonia appeared lining the germinal epithelium in increasing numbers (Figures 3A & 4A). At stage II the gonad wall was the thickest, reproductive cells continued growing and started migrating to the narrow tubule lumen as pre- and mid-vitellogenic oocytes and spermatocytes, still attached to the folded germinal epithelium and spermatogenic column (Figures 3B & 4B). The maturation process from stage II (recovery) to stage V (partly spawned) was evidenced by the thinning and stretching of the gonad wall and an increase in the lumen space defined by tubule diameter (Tables 2 & 3) (Figures 3B–E & 4B–F). By stage III (growing) and IV (mature) tubule diameter increased and the female tubule lumen got progressively packed with fully grown late vitellogenic oocytes surrounded by and attached to their follicular envelopes (Figure 3C, D). Male tubule lumen got filled with tightly packed spermatozoa (Figure 4C, D). At stage V (partly spawned), spawned, partly spawned and unspawned gonad tubules could be found in the same individual. At this stage the majority of female gonad tubules had some free lumen space and contained few intact oocytes, damaged relict oocytes and remains of follicular envelopes, debris and phagocytes (Figure 3E). Male gonad tubules contained diffusely arranged spermatozoa, empty lumen space and phagocytes (Figure 4F–I).
Representative images of oogenesis in A. chilensis: (A) stage I, spent ovary; (B) stage II, recovering ovary; (C) stage III, growing ovary; (D) stage IV, mature ovary; (E) stage V, partially spawned ovary; (F) ovary from a juvenile individual. Abbreviations: do, degrading oocyte; ph, phagocytes; pvo, pre-vitellogenic oocyte; evo, early vitellogenic oocyte; mvo, mid-vitellogenic oocyte; lvo, late vitellogenic oocyte; gv, germinal vesicle; ro, relict oocyte. Arrow indicates highly degraded oocyte. Scale bars: A, 292 µm; B, 160 µm; C and E, 320 µm; D, 640 µm; F, 80 µm.

Representative images of spermatogenesis in A. chilensis: (A) stage I, spent testis; (B) stage II, recovering testis; (C) stage III, growing testis; (D) stage IV, mature testis (early); (E) stage IV, mature testis (late); (F) stage V, partly spawned testis; (G) phagocytic activity indicated in F; (H) phagocytic activity and spermatozoa indicated in F; (I) another kind of possible phagocytic activity; (J) testis from an immature individual. Abbreviations: sg, spermatogonia; sc, spermatocytes; sz, spermatozoa. Arrows indicates phagocytic activity. Scale bars: A and C, 160 µm; B and J, 80 µm; D–F, 320 µm; G and I, 40 µm; H, 16 µm.

Description of female A. chilensis ovarian maturity stages determined through histology.

Description of male A. chilensis testes maturity stages determined through histology.

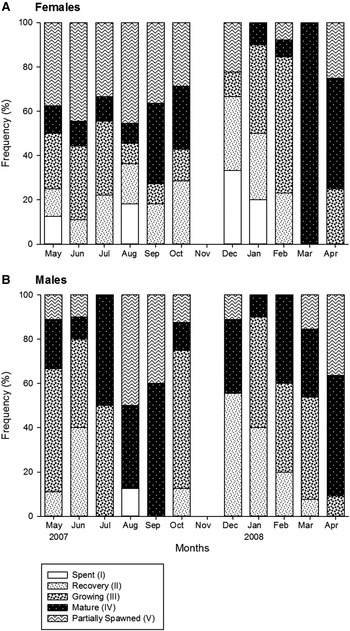
The frequency distribution of male and female maturity stages changed through the year (Figure 5). However, mature individuals (stage IV) were present all year round. Mature females were more abundant in September, October 2007 and March, April 2008, and mature males were more abundant in July–September 2007 and February–April 2008. Partly spawned females (stage V) were present in similar percentages almost all year round; from May 2007 to Dec 2007 and April 2008. Partly spawned males were restricted to fewer months; from August–September 2007 and April 2008. These two periods were separated by intense gametogenic activity evidenced by high percentages of gonads in stages of recovery (stage II) and growing (stage III). Spent females (stage I) were encountered in May, August, December 2007 and January 2008, while spent males (stage I) were only encountered in August 2007.
Monthly frequency of maturity stages of A. chilensis assessed through histology. (A) females; (B) males. November samples were lost in a fire that destroyed the Faculty of Sciences at Universidad Austral de Chile in December 2007.

For females, spawning periods – months where over 25% of individuals had gonads in spawning stages – progressed from May to December 2007 and April 2008 with higher proportions of spawning females in May, June, August, December 2007 and April 2008. For males, spawning periods took place from August 2007 to September 2007 and then April 2008. Spawning periods for both sexes overlapped from the end of winter towards beginning of spring (August and September 2007) and at beginning of autumn (April 2008).
GONAD MACROSCOPIC ANALYSIS
Gonad tubules filled the body cavity of adult individuals of A. chilensis in advanced stages of maturity (stages IV and V). These entangled with the digestive tract, anterior portion of the longitudinal muscles and respiratory trees. As individuals became ripe, male gonad colour turned from light cream to creamy orange and tubules acquired a beaded appearance. The female gonad wall was transparent and oocytes darkened from green to brown as they grew.
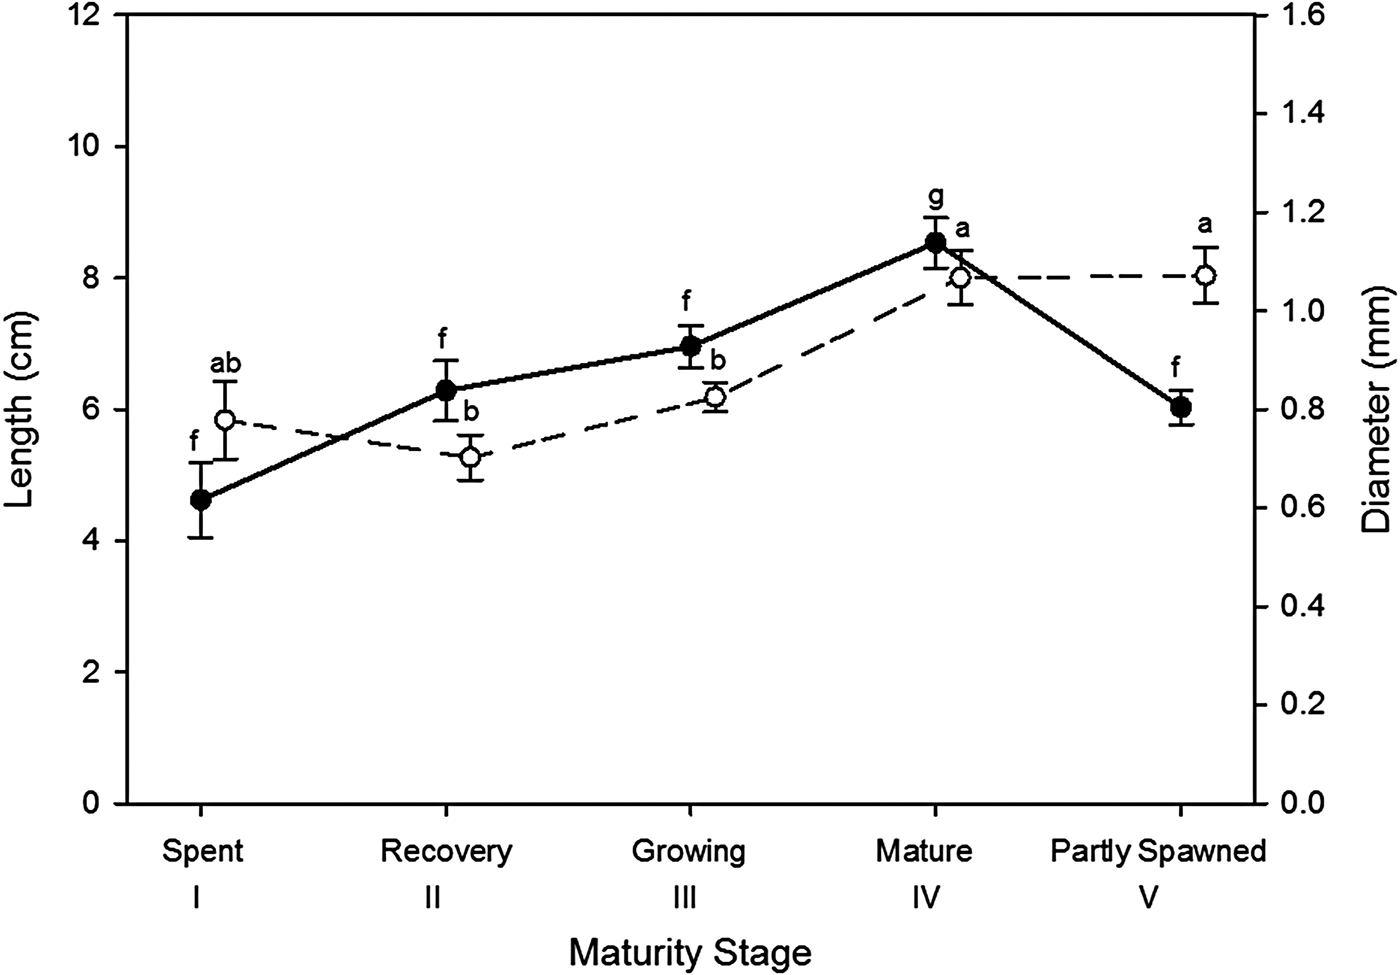
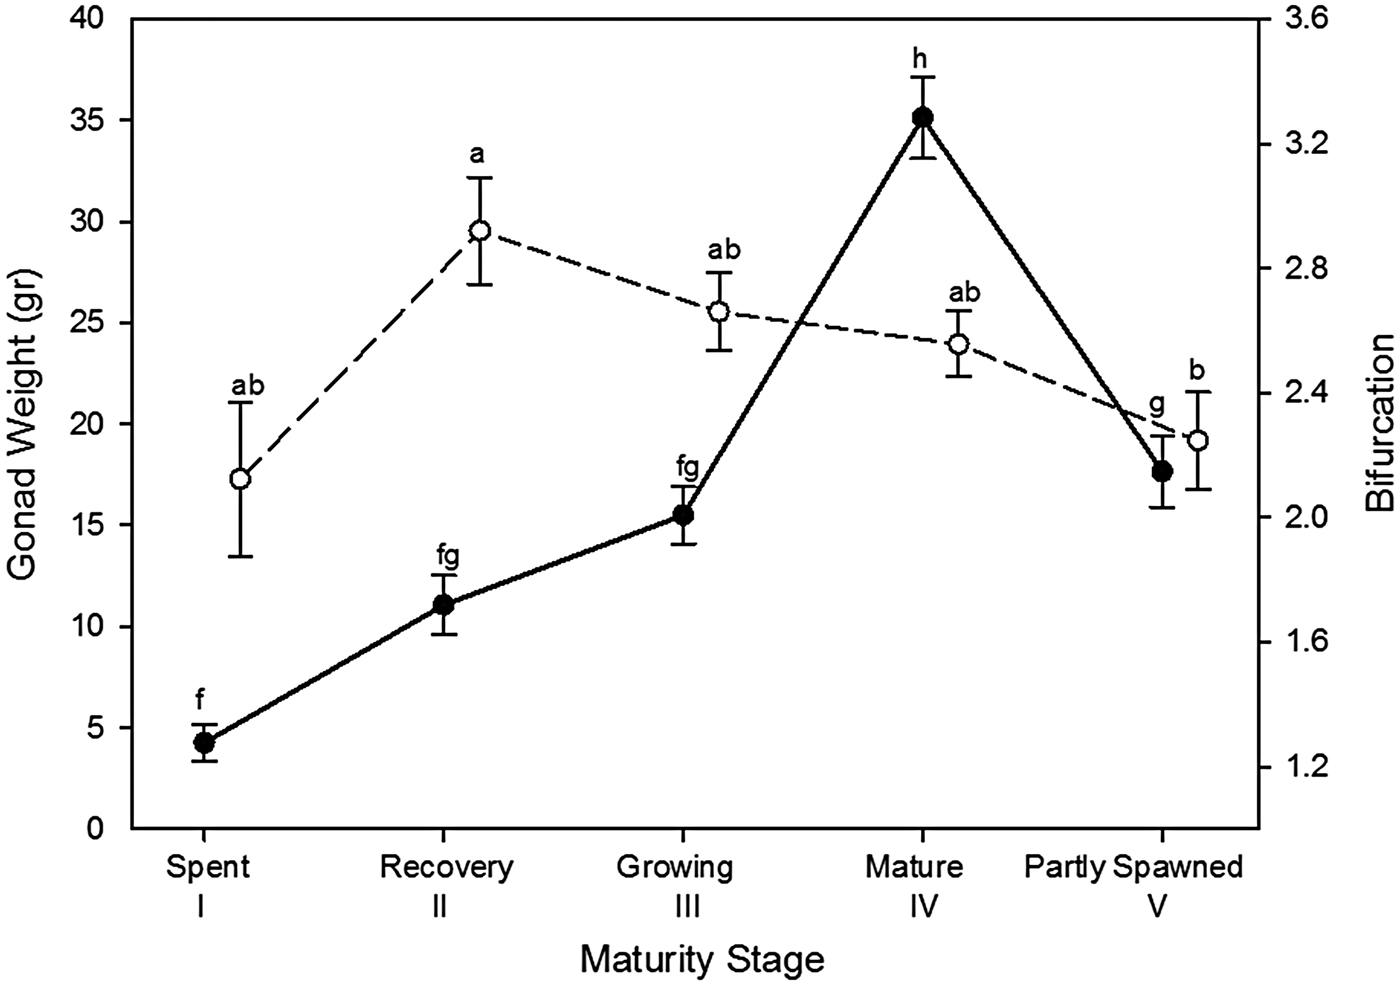
When looking at the effect of sex and maturity stages over macroscopic gonad features we observed no combined effects over gonad tubule length (two-way ANOVA, F (4, 145) = 1.02, P = 0.399), diameter (two-way ANOVA, F (4, 145) = 0.79, P = 0.535) or bifurcation (two-way ANOVA, F (4, 145) = 0.87, P = 0.483). Gonad tubule length was similar between sexes (ANOVA, F (1, 153) = 0.58, P = 0.447). However, female gonad tubule diameter was significantly wider (mean: 1.05 mm ± 0.31 SD) (ANOVA, F (1, 153) = 30.81, P < 0.0001) and had significantly fewer bifurcations (mean: 2.34 ± 0.79 SD) (ANOVA, F (1, 153) = 11.65, P = 0.0008) than male gonad tubules (diameter mean: 0.79 mm ± 0.29 SD, bifurcations mean: 2.79 ± 0.85 SD). Gonad tubule length, diameter and bifurcation differed significantly between maturity stages across sexes; gonad tubules became longer from stage I (spent) to IV (mature) and shortened significantly at stage V (partly spawned) (ANOVA, F (4, 150) = 10.03, P < 0.0001) (Figure 6). Gonad tubule diameter increased from stage II (recovery) to IV (mature) (Figure 6). At stage V (partly spawned) the gonad tubules got particularly distended and filled with liquid, where phagocytic activity could be observed by the naked eye as dark clusters of debris. Female gonads at stage V contained loosely arranged oocytes and had a glossy appearance. From stage V (partly spawned) tubule diameter decreased significantly and reached minimum diameter at stage II (recovery) (ANOVA, F (4, 150) = 9.71, P < 0.0001) (Figure 6). Gonad tubule bifurcation decreased from maximum bifurcation at stage II (recovery) to minimum bifurcation at stage I (spent) (ANOVA, F (4, 150) = 3.23, P = 0.014) (Figure 7). There were no combined effects of sex and maturity stages over gonad weight (two-way ANOVA, F (4, 162) = 0.12, P = 0.975), and mean yearly Gw was similar between sexes (ANOVA, F (1, 210) = 1.92, P = 0.168). However, there were significant differences on Gw between maturity stages, gradually increasing from stage I (spent) towards stage IV (mature) and dropping after spawning (ANOVA, F (4, 167) = 32.06, P < 0.0001) (Figure 7).
Mean A. chilensis gonad tubule length (filled circles) and diameter (empty circles) through maturity stages across sexes. Letters above bars indicate post-hoc test results for the effect of maturity stages in two-way ANOVA (maturity stages, sex). Points that do not share the same letter indicate significant differences. Bars indicate standard error.

Mean A. chilensis gonad weight (filled circles) and mean gonad tubule bifurcation (empty circles) through maturity stages across sexes. Letters above bars indicate post-hoc test results for the effect of maturity stages in two-way ANOVA (maturity stages, sex). Points that do not share the same letter indicate significant differences. Bars indicate standard error.

SIZE AT FIRST MATURITY
The smallest immature female with gonads was 1.7 g Ew and 6 cm Tl. The smallest immature male with gonads was 7.4 g Ew and 9.5 cm Tl. For these individuals, sex could only be determined by microscopic observation (Figures 3F & 4J), while for individuals of sizes over 27 g Ew and 12 cm Tl sex could be determined by the naked eye.
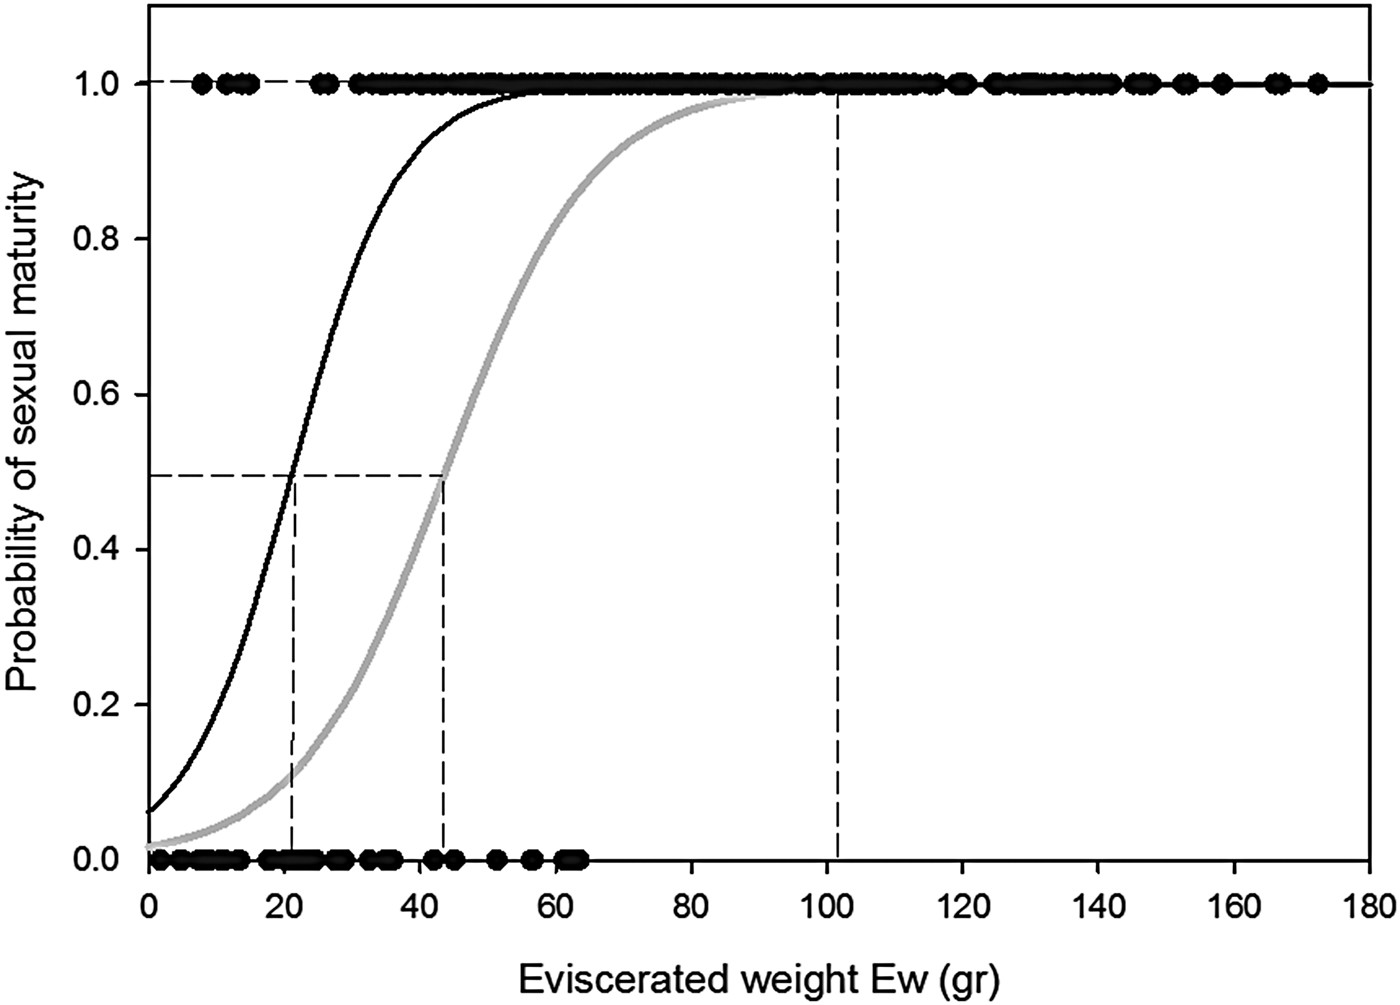
The interaction between Ew and sexual maturity was significant both for females (Logistic-R, χ 2 = 78.59; P < 0.0001) and males (Logistic-R, χ 2 = 46.60, P = 0.0001). Ew(50) was 43.68 g (95% CI from 33.6 to 50.8 g) for females and 21.17 g (95% CI from 9.5 to 28.53 g) for males, while all individuals were mature at Ew(100) 118.11 g (95% CI from 98.29 to 162.50 g) and 75.01 g (95% CI from 57.20 to 131 g) for females and males respectively (Figure 8). From the linear equation calculated from the relationship between Ew and Dw, Dw(50) was 68.71 g for females and 17.54 g for males. Dw(100) was 237.89 g for females and 139.92 g for males.
Athyonidium chilensis size at first maturity for females (grey line) and males (black line). Female logistic regression parameters A: −4.053 (95% CI from −6.381 to −2.34, χ2 = 16.11, P < 0.0001) and B: 0.093 (95% CI from 0.062–0.136, χ2 = 25.14, P < 0.0001). Male logistic regression parameters A: −2.715 (95% CI from −5.112 to −0.925, χ2 = 6.92, P = 0.009) and B: 0.128 (95% CI from 0.073–0.213, χ2 = 13.84, P = 0.0002). Spaced lines indicate eviscerated weight at which 50 and 100% of individuals are mature.

FECUNDITY
GI for the 12 analysed females in stage IV (mature) ranged from 40.61 to 64.4%. Gw, Tl and Ew ranged from Gw: 40.2–67.06 g, Tl: 22–31 cm, and Ew: 100.45–132.11 g. Mean absolute fecundity (
 $\overline x $
FA) was 6.31 × 10⁵ (±1.97 × 10⁵ SD) oocytes per female. Relative fecundities were 1.35 × 10⁴ (±2.2 × 10³ SD) oocytes per gram of gonad (
 $\overline x $
FRGw), 2.82 × 10³ (±1.05 × 10³ SD) oocytes per gram of drained body weight (
 $\overline x $
FRDw) and 5.4 × 10³ (±2 × 10³ SD) oocytes per gram of body wall weight (
 $\overline x $
FREw). Mean vitellogenic oocyte diameter of adult females in stage IV (mature) was 500 µm (±30.2 µm SD) including the follicular epithelium, and 460 µm (±15.7 µm SD) without the latter.
DISCUSSION
Continuous gametogenesis and the presence of spawning individuals in our monthly samples revealed that Athyonidium chilensis in southern Chile was able to reproduce throughout the year. However, the most important reproductive time was spring, where spawning activity observed through histology was accompanied by an important gonad index (GI) decline and recovery in summer. A slight gonad index (GI) decline and enhanced spawning activity observed at the beginning of autumn 2008 coincided with high percentages of individuals in spawning stages and low GIs observed in autumn 2007. Although a longer study period would be required to confirm an important spawning episode in autumn, this could indicate that A. chilensis in southern Chile shows two important reproductive times in the year; one in autumn and another one in spring.
As observed for Holothuria fuscogilva, spawning activity in A. chilensis increased before any significant drop in the GI could be detected (Ramofafia et al., Reference Ramofafia, Battaglene, Bell and Byrne2000). This, along with increased GI variability around high GI periods, indicates that spawning in A. chilensis commences asynchronously among individuals in the population (Ramofafia et al., Reference Ramofafia, Battaglene, Bell and Byrne2000; Dissanayake & Stefansson, Reference Dissanayake and Stefansson2010). This seems to occur as a gradual process involving partial gamete release that gets more coordinated towards major spawning events (Ramofafia et al., Reference Ramofafia, Battaglene, Bell and Byrne2000). As is the case for most dendrochirotes, A. chilensis showed an even male to female sex distribution (Tyler & Gage, Reference Tyler and Gage1983; Murdoch, Reference Murdoch1984; Costelloe, Reference Costelloe1988; Hamel et al., Reference Hamel, Himmelman and Dufresne1993; Chao et al., Reference Chao, Chen and Alexander1995; Foster & Hodgson, Reference Foster and Hodgson1995; Hamel & Mercier, Reference Hamel and Mercier1996a; Singh et al., Reference Singh, MacDonald, Lawton and Thomas2001; Martinez et al., Reference Martinez, Giménez and Penchaszadeh2011), and the prevalent observation of overlapping generations of oocytes inside spawned gonad tubules suggested that the tubule recruitment model (TRM) for ovarian development in holothurians (Smiley et al., Reference Smiley, McEwen, Chafee, Krishnan, Giese, Pearse and Pearse1991) may not apply for this species (Sewell et al., Reference Sewell, Tyler, Young and Conand1997; Ramofafia et al., Reference Ramofafia, Battaglene, Bell and Byrne2000).
Reproductive cycles described for other dendrochirote sea cucumbers include single annual reproduction in spring (Costelloe, Reference Costelloe1985, Reference Costelloe1988; Hamel et al., Reference Hamel, Himmelman and Dufresne1993; Chao et al., Reference Chao, Chen and Alexander1995; Foster & Hodgson, Reference Foster and Hodgson1995; Hamel & Mercier, Reference Hamel and Mercier1996a; Singh et al., Reference Singh, MacDonald, Lawton and Thomas2001; Martinez et al., Reference Martinez, Giménez and Penchaszadeh2011), summer (Foster & Hodgson, Reference Foster and Hodgson1995; Martinez et al., Reference Martinez, Giménez and Penchaszadeh2011) and winter (Rutherford, Reference Rutherford1973; Catalan & Yamamoto, Reference Catalan and Yamamoto1994), while semi-annual and aseasonal reproduction (Tyler & Gage, Reference Tyler and Gage1983; Murdoch, Reference Murdoch1984) are less common in temperate free-spawning holothurians (Harriott, Reference Harriott1985; Sewell & Bergquist, Reference Sewell and Bergquist1990; Sewell, Reference Sewell1992; Chao et al., Reference Chao, Chen and Alexander1995; Navarro et al., Reference Navarro, García-Sanz and Tuya2012). Athyonidium chilensis enhanced reproduction in spring and indications of enhanced reproduction at beginnings of autumn suggest that, even for species with lecithotrophic larval development, seasonal environmental factors might play an important role synchronizing population reproductive times. The planktotrophic sea urchin Loxechinus albus, another echinoderm inhabiting the coasts of Chile, shows an annual reproductive cycle with two episodes of gonadal maturation around spring and autumn (Zamora & Stotz, Reference Zamora and Stotz1992; Vásquez, Reference Vásquez2001); one leads to spawning in spring while the other appears to serve as a source of winter nutrient stores (Buckle et al., Reference Buckle, Guisado, Tarifeño, Zuleta, Córdova and Serrano1978). In Valdivia, A. chilensis biggest yearly spawning event in spring coincided with that of L. albus at the same location (Guisado 1995 in Vásquez, Reference Vásquez2001). This suggests the importance of high primary productivity periods as drivers of gametogenic processes, which along with temperature, have long been recognized to influence reproduction in holothurians (Costelloe, Reference Costelloe1988; Hamel et al., Reference Hamel, Himmelman and Dufresne1993; Chao et al., Reference Chao, Chen and Alexander1995; Martinez et al., Reference Martinez, Giménez and Penchaszadeh2011).
Although several years of observation would be necessary to predict the spawning season of any species at any geographic location (Sewell & Bergquist, Reference Sewell and Bergquist1990), the results from the present one-year study are similar to results obtained in previous unpublished studies on this species. Caffi (Reference Caffi1981) and Moreno (Reference Moreno2002) studied the reproductive biology of intertidal A. chilensis in the central coast of Chile; Concepcion (36°35.9′S 72°58.4′W) and Coquimbo (30°0.5′S 71°26′W). In these studies, A. chilensis also showed aseasonal asynchronous reproduction with partial spawning through the year. However, Caffi (Reference Caffi1981) observed that enhanced spawning periods occurred in spring and summer, while Moreno (Reference Moreno2002) observed enhanced spawning periods in winter and summer. In both studies, autumn GI declines were not clearly associated with increases in the monthly percentage of individuals in spawning stages. Oocyte sizes and GIs of A. chilensis in Valdivia almost doubled those reported for northern populations (Caffi, Reference Caffi1981; Moreno, Reference Moreno2002; Guisado et al., Reference Guisado, Carrasco, Díaz-Guisado, Maltrain and Rojas2012). With a yearly mean GI of 20% and two yearly peaks of 25.22% (±15.93 SD) in August–September 2007 and 25.68 (±9.92 SD) in March 2008, A. chilensis GIs in Valdivia were particularly high compared with those found in northern populations and those of other sea cucumber species (Costelloe, Reference Costelloe1985, Reference Costelloe1988; Hamel et al., Reference Hamel, Himmelman and Dufresne1993; Chao et al., Reference Chao, Chen and Alexander1995; Muthiga, Reference Muthiga2006; Shiell & Uthicke, Reference Shiell and Uthicke2006; Toral-Granda & Martínez, Reference Toral-Granda and Martínez2007; Asha & Muthiah, Reference Asha and Muthiah2008; Herrero-Pérezrul & Reyes-Bonilla, Reference Herrero-Pérezrul and Reyes-Bonilla2008; Muthiga et al., Reference Muthiga, Kawaka and Ndirangu2009; Dissanayake & Stefansson, Reference Dissanayake and Stefansson2010; Martinez et al., Reference Martinez, Giménez and Penchaszadeh2011; Morgan & Neal, Reference Morgan and Neal2012; Navarro et al., Reference Navarro, García-Sanz and Tuya2012). It would be interesting to study if these high GIs are of common occurrence in southern Chile, or if they might have resulted from a year with particularly favourable conditions for A. chilensis reproduction. Male mean GI surpassed female mean GI, which has been previously observed for the dendrochirotes Psolus patagonicus Ekman, 1925 (Martinez et al., Reference Martinez, Giménez and Penchaszadeh2011), Psolus fabricii (Düben & Koren, 1846) (Hamel et al., Reference Hamel, Himmelman and Dufresne1993) and Cucumaria frondosa (Gunnerus, 1767) (Murdoch, Reference Murdoch1984; Hamel & Mercier, Reference Hamel and Mercier1996a). Also, male gonads were on average bigger than female gonads, which could indicate similar energy investment in gamete synthesis between sexes, because less energy is required for males to synthesize an equivalent amount of gametes (Hamel & Mercier, Reference Hamel and Mercier1996a). Overall, latitudinal and small-scale reproductive differences may indicate important geographic trade-offs in populations of A. chilensis, a common occurrence in holothuroids at the intraspecific level (Sewell, Reference Sewell1992; Ramofafia et al., Reference Ramofafia, Byrne and Battaglene2003; Shiell & Uthicke, Reference Shiell and Uthicke2006; Toral-Granda & Martínez, Reference Toral-Granda and Martínez2007; Muthiga et al., Reference Muthiga, Kawaka and Ndirangu2009; Navarro et al., Reference Navarro, García-Sanz and Tuya2012). Given reproductive cycles in echinoderms have also been shown to vary with depth (Leahy et al., Reference Leahy, Hough-Evans, Britten and Davidson1981), studies on subtidal A. chilensis populations are strongly encouraged. Subtidal individuals reach bigger sizes than intertidal individuals (authors' personal observation) and could potentially show even higher GIs than those reported in the present study.
Mature females in this study showed very high fecundity for a species with big egg size. Higher fecundities in marine invertebrates are usually associated with smaller egg sizes and planktotrophic larval development (Thorson, Reference Thorson1950; Catalan & Yamamoto, Reference Catalan and Yamamoto1994). Absolute fecundity in Cucumaria frondosa, another temperate broadcast-spawning dendrochirote with lecithotrophic larval development and similar body size as A. chilensis, has been reported to range between 60–400 thousand (Murdoch, Reference Murdoch1984) and 8–10 thousand (Hamel & Mercier, Reference Hamel and Mercier1996a), although this species shows bigger egg diameter (800 μm). For Eupentacta chronhjelmi, another temperate species with lecithotrophic larval development, 300 µm egg diameter and one third of the body size of A. chilensis, absolute fecundity is 1500 (Catalan & Yamamoto, Reference Catalan and Yamamoto1994). In Valdivia, A. chilensis shows the highest fecundity among holothuroid species with lecithotrophic larval development, fecundity that seems to be in the lower range of that observed for planktotrophic species (Catalan & Yamamoto, Reference Catalan and Yamamoto1994; Toral-Granda & Martínez, Reference Toral-Granda and Martínez2007; Asha & Muthiah, Reference Asha and Muthiah2008; Muthiga et al., Reference Muthiga, Kawaka and Ndirangu2009; Dissanayake & Stefansson, Reference Dissanayake and Stefansson2010). Intertidal A. chilensis might require higher fecundity energy investment given the highly exposed areas it inhabits, where chances of successful fertilization are likely to be very low. Overall, high fecundity, continuous gametogenesis, the presence of spawning individuals year-round with one and possibly two spawning peaks during spring and autumn, and lecithotrophic larval development lasting less than a week (personal observation; Pérez, Reference Pérez2005; Guisado et al., Reference Guisado, Carrasco, Díaz-Guisado, Maltrain and Rojas2012) make A. chilensis a very interesting candidate for aquaculture in southern Chile.
Athyonidium chilensis gonad colours fit patterns described for other dendrochirotes; creamy white to orange male and green to brown female gonad (Costelloe, Reference Costelloe1985; Hamel et al., Reference Hamel, Himmelman and Dufresne1993; Catalan & Yamamoto, Reference Catalan and Yamamoto1994; Foster & Hodgson, Reference Foster and Hodgson1995). As in other holothuroids, the process of gonad maturation can be seen as an increase in tubule length and diameter towards stage IV (mature) (Hamel et al., Reference Hamel, Himmelman and Dufresne1993; Catalan & Yamamoto, Reference Catalan and Yamamoto1994; Foster & Hodgson, Reference Foster and Hodgson1995; Hamel & Mercier, Reference Hamel and Mercier1996a; Singh et al., Reference Singh, MacDonald, Lawton and Thomas2001; Asha & Muthiah, Reference Asha and Muthiah2008; Fajardo-León et al., Reference Fajardo-León, Suárez-Higuera, del Valle-Manríquez and Hernández-López2008; Navarro et al., Reference Navarro, García-Sanz and Tuya2012) and decreased length toward stage V (Catalan & Yamamoto, Reference Catalan and Yamamoto1994; Ramofafia et al., Reference Ramofafia, Byrne and Battaglene2001; Toral-Granda & Martínez, Reference Toral-Granda and Martínez2007; Dissanayake & Stefansson, Reference Dissanayake and Stefansson2010; Navarro et al., Reference Navarro, García-Sanz and Tuya2012). Female tubule diameter was wider than males (Asha & Muthiah, Reference Asha and Muthiah2008; Fajardo-León et al., Reference Fajardo-León, Suárez-Higuera, del Valle-Manríquez and Hernández-López2008), while males had more tubule bifurcations than females. This difference could indicate a higher need for sperm production surface area in males and a need for wider tubule lumen space for oocyte storage in females. At the same time, gonad tubules had more bifurcations during the recovery stage, a likely source of increased surface area for gametes arising from the germinal epithelium to be later transferred to an increasing lumen space. The discrete characteristics of gonad tubules and the way they reflect reproductive condition, especially in terms of diameter and bifurcation, facilitates the assessment of the population's reproductive condition.
Athyonidium chilensis size at first maturity was slightly lower than that of the dendrochirote C. frondosa (55 g Ew) (Hamel & Mercier, Reference Hamel and Mercier1996a), similar to that of the aspidochirote Isostichopus fuscus (161.0 and 170.9 g Dw) (Toral-Granda & Martínez, Reference Toral-Granda and Martínez2007), and considerably lower than that of the aspidochirotes Parastichopus parvimensis (120 to 140 g Ew) (Fajardo-León et al., Reference Fajardo-León, Suárez-Higuera, del Valle-Manríquez and Hernández-López2008) and Holothuria sanctori (101 to 110 g Ew) (Navarro et al., Reference Navarro, García-Sanz and Tuya2012), all holothuroids of similar total length (Tl) to A. chilensis. When comparing the relationship between Tl and drained weight (Dw) against eviscerated weight (Ew) in A. chilensis, Dw was a much more reliable predictor of live animal weight, as observed for other sea cucumber species (Herrero-Pérezrul & Reyes-Bonilla, Reference Herrero-Pérezrul and Reyes-Bonilla2008; Dissanayake & Stefansson, Reference Dissanayake and Stefansson2010; Kazanidis et al., Reference Kazanidis, Antoniadou, Lolas, Neofitou, Vafidis, Chintiroglou and Neofitou2010). Estimated size at first maturity based on the relationship between Ew and Dw was 17.54 g Dw(50) for males and 68.71 g Dw(50) for females. Based on this estimation we recommend the use of a minimum harvesting size where 100% of females are mature; 237.89 g Dw(100) for the live animal, which corresponds to 118.11 g Ew(100). This is a precautionary approach because females mature at a bigger size than males and it is not possible to externally predict the sex of A. chilensis. At the same time, Dw could be easily over-estimated due to water remaining in the cloaca and respiratory trees or excessive food in the digestive tract.
Athyonidium chilensis shows fast larval development, thus limited larval dispersal which is likely to limit the genetic connectivity between populations, making this species particularly susceptible to fishing over-pressure. The information presented in this study could be utilized to reduce fishing pressure during A. chilensis peak reproductive times to allow aggregation of individuals and successful reproduction (Hamel & Mercier, Reference Hamel and Mercier1996b). This study could also be used as a guideline to establish minimum capture sizes for fisheries. Inside MEABRs and through small-scale aquaculture, fishers could assess enhancing sea cucumber stocks through the mass-release of cultured juveniles to restricted areas (Purcell & Agudo, Reference Purcell and Agudo2013) or by establishing local management regulations to protect the reproductive potential of populations (Bell et al., Reference Bell, Leber, Blankenship, Loneragan and Masuda2008a, Reference Bell, Purcell and Nashb).
ACKNOWLEDGEMENTS
We would like to thank people who assisted with sea cucumber sampling, especially Carola Martinez, Juan Pablo Fuentes, Marcelo Flores, Fabián Aros and Cristián Manque. Thanks to Roger Sepulveda and Mary Sewell for valuable input during manuscript preparation. Special thanks to Raúl Arriagada for his help with histology procedures and for providing valuable support after the fire that affected the Faculty of Sciences at Universidad Austral de Chile.
FINANCIAL SUPPORT
This research received no specific grant from any funding agency, commercial or not-for-profit sectors.