

1. Introduction
In their Reference Akerlof and Shiller2015 book Phishing for Phools Akerlof and Shiller use case studies to challenge the deregulatory perspective of Milton Friedman and the wider ‘Chicago School’. They argue that regulatory interventions are the primary reason why today's consumers face fewer risks of being fleeced or being sold dangerous products than their nineteenth-century counterparts. Phishing for Phools complements research by Hanson and Kysar (Reference Hanson and Kysar1999a, Reference Hanson and Kysar1999b), who identified a clear potential for firms to manipulate choices by applying behavioural research on the heuristics and biases that compromise human decision making and provided evidence of firms operating as if they were already doing this. Today's consumers thus may need more regulatory support, not less, to protect them from deviously designed choice architectures and false or misleading claims, especially where the complexity of modern products or opportunistic product proliferation causes information overload. However, there is scope for modernizing the Chicago perspective by recognizing that today's consumers may be able to reduce their risks of ending up with poor deals if they can make what we call ‘market-assisted choices’ (MACs) – in other words, decisions in which the buyer outsources all or part of the choice process – rather than being confined to what we call ‘self-reliant choices’ (SRCs).
MACs are facilitated by a subset of the social institutions that Hodgson (Reference Hodgson1988) portrays as constituting a market. Sometimes, assistance is provided without the beneficiary having to pay for it, as when people use their social networks to share experience and expertise. Useful inputs may also be supplied commercially, for example by consultants, retailers and comparison websites, and even by publishers of books on how to make better choices, written by behavioural economists and psychologists. However, in principle, MACs could end up worse than SRCs, not better, even in markets where the consumer lacks expertise. For-profit product comparison sites may be poorly designed and/or succumb to conflicts of interest if their revenue comes from those providers whose products they ‘enable’ consumers to compare. Consumers may also be let down by product reviewers, members of their social networks or contributors to online discussion boards who mean well but are actually less knowledgeable than they seem.
In this paper we explore the impact that the ability to make MACs has on the quality of choices in a challenging modern-day context, namely, choosing a mobile (cell) phone connection service plan. We find that while outsourcing aspects of the choice process can significantly improve the quality of choices, design flaws in, and incompetent use of, external decision aids such as product comparison websites can hinder the discovery of the best product. Hence, in the context of the study, a ‘Chicago-style’ perspective would be overly optimistic and more regulatory intervention may be needed to make it easier for consumers to spot good deals and limit their risks of being ‘phished for phools’. Our wider message is that although there is potential for an individual's bounded rationality to be mitigated by making MACs rather than SRCs, one should not assume that, where MACs are possible, it is safe to view the population of decision makers ‘as if’ they are optimizing agents.
We reach these conclusions via an experiment in which subjects faced one of two computer-based choice environments. About half were given access only to an archive of providers’ websites and thus had to make SRCs, whereas the rest were given unfettered Internet access. Those in the latter group made extensive use of Google searches, product comparison websites, discussion boards, and so on. All subjects were trying to find the cheapest plan that would service a particular usage remit. They were each given an hour to do this and were rewarded financially depending on their performance.
The context for this study is the 2010–13 Australian mobile phone service market, where consumers were served by over 50 providers offering in total over 800 different plans (a number that expanded dramatically if handset and bundling options were included). The potential for paying too much due to errors of oversight was thus considerable, but many of these offers involved complex contractual arrangements, adding scope for comprehension and calculation errors. However, our subjects’ choice problem was simplified compared with that of actual consumers as the choice remit (1) entailed no usage uncertainty and (2) specified that the plan selected had to be a ‘prepaid’ one, which removed the need to deal with the two-tier pricing systems that are common with postpaid contracts.
This study breaks new ground not merely in its analysis of the efficacy of MACs versus SRCs but also by blending experimental economics with aspects of an approach to behavioural research known as ‘process tracing’. Everything each subject said and everything that happened on the computer screen was recorded as a screen-capture movie, which we then analysed in minute detail. This novel use of audio/visual recordings was highly time-intensive but was a powerful method for revealing the difference that access to online market institutions made to the quality of choices in this context and for pinning down how poor outcomes could occur despite – or, sometimes, because of – access to such institutions and how they were used.
The rest of this paper is structured as follows. Section 2 reviews related work that uses process-tracing methods. Section 3 presents a detailed account of the methods employed in this study. Section 4 presents our hypotheses and findings about the differences between offline and online subjects in the quality of their recommendations, and about the relationships between the errors made by online subjects and the extent of their use of online market institutions. Finally, Section 5 offers a concluding discussion.
2. Previous process-tracing research
Economists normally analyse choices without considering the processes by which they are generated. The latter are the focus of process-tracing research, which is widespread in psychology, marketing and management (for a handbook that critically surveys the field, see Schulte-Mecklenberg et al., Reference Schulte-Mecklienbeck, Kuhberger and Ranyard2011). Process tracing is an umbrella term for a wide variety of research methods, two of which inspired the present study, namely, protocol analysis and mouse tracking, via the classic contributions of Ericsson and Simon (Reference Ericsson and Simon1993) and Payne et al. (Reference Payne, Bettman and Johnson1993), respectively.
Protocol analysis uses small samples – sometimes less than ten – but each participant can generate massive amounts of data (for an excellent short guide, see Trickett and Trafton, Reference Trickett, Trafton, Cohn, Schmorrow and Nicholson2008). The method typically entails: (1) recording participants thinking aloud as they undertake a task, (2) segmenting transcripts of their utterances into distinct episodes, (3) coding the segments of utterances in terms of a framework that the research team has agreed upon as a means for classifying the different kinds of thinking that went on, and (4) studying sequential relationships between coded items and/or their incidence, in order to generate or test hypotheses about decision-making processes in the context in question.
Although protocol analysis has been used widely in other business disciplines, very few papers that apply the technique have been published in economics journals. Like most of their counterparts elsewhere, these papers report studies in which subjects undertook tasks that could be completed in a few minutes. Fatigue-driven difficulties in continuing to ‘keep talking’ were thus not an issue – unlike in the present study, where subjects were allowed an hour to complete their task.
Close to the present study in sample size are papers by Highhouse (Reference Highhouse1994) and Van Osch and Stiggelbout (Reference Van Osch and Stiggelbout2008), both of which had 45 participants. Highhouse investigated the impact of presenting a point estimate, versus an interval estimate, on choices between established and novel medical procedures. The Van Osch and Stiggelbout study, also in a health setting, investigated why the expected utility model of choice performs poorly for predicting how subjects value treatments involving gambles between good health for the rest of their life expectancy and some risk of immediate death. With shorter duration tasks, other researchers have found it viable to undertake protocol analysis with around a hundred participants, as in papers by Schkade and Payne (Reference Schkade and Payne1994) and Christandl and Fetchenhauer (Reference Christandl and Fetchenhauer2009). The former researchers investigated how people formulated responses to a contingent valuation questionnaire, whereas the latter aimed to get a better understanding of how people view the impact of economic growth on the level of GDP.
In terms of context, the closest protocol analysis study to the present paper is the work of Ranyard et al. (Reference Ranyard, Hinkle, Williamson and McHugh2006), who presented each of 96 subjects with two scenarios involving the use of credit – buying a new washing machine and buying a car – and asked them to choose between different credit products. As with mobile phone plans, choices between different credit products pose computational challenges for lay consumers, making them vulnerable to being ‘phished for phools’. The researchers explained to the subjects the kinds of information available about the credit options but then left it to the subjects to ask them for the information they wanted. However, although recordings of these interviews were made for all 96 subjects Ranyard et al. analysed qualitatively only the protocols from a sub-sample of 32 subjects who had requested broadly the same information as the full sample.
The only economics-related study that is similar to the present one in terms of task duration is by Macmillan (Reference Macmillan2015), on how competition lawyers with different levels of experience differed in how they assessed whether merger cases that were being examined by the Australian Competition and Consumer Commission (ACCC) would go before the court. Macmillan used Skype to record his sample of 20 legal professionals remotely for about 45 minutes each as they thought aloud about four cases while perusing copies of ACCC documents that he had loaded, along with task instructions, on to a dedicated website.
These existing studies all employ standard verbal protocol analysis. The decision to build the present study around recordings of what participants did – rather than merely around what they said – en route to their recommendations was inspired by Payne et al.’s (Reference Payne, Bettman and Johnson1993) seminal studies of how consumers cope with complex information environments. However, Payne et al. used Mouselab software to automate the process of gathering information on how participants navigated through an information environment before reaching a decision. Mouselab presents subjects with opportunities to access various kinds of information and records which information they retrieve and the sequence in which they retrieve it. Compared with the present study's method, Mouselab thus saves the time of researchers at the cost of restricting process-tracing research to highly stylized choice environments.
3. Method
The data used in this study come from 41 screen-capture movies recorded on an Apple computer between March and October 2013. These movies showed the webpages examined by participants, and their use of the Apple calculator, as they sought to find the cheapest prepaid Australian mobile phone connection plan for a 24-month usage remit supplied by the investigators. Each participant was asked to imagine that the set of requirements was from a friend who had just arrived in Australia and wanted help in choosing a prepaid mobile phone plan to use on their existing unlocked handset. Subjects were each given an hour to work on the task with the aid of the computer and were asked to ‘think aloud’ as they did so. They were aware that what they said and what happened on the computer screen would be recorded, and that if they went silent they would be prompted to ‘keep talking’. If they were still working on the task after 55 minutes, they were given a ‘five minutes remaining’ prompt. After finishing the task, subjects completed a demographic and mobile phone-related questionnaire, the responses to which are used in a companion paper.Footnote 1
The usage remit was specified per month and covered calls (100, each lasting exactly 75 seconds), domestic SMS messages (41), international SMS messages (10), MMS picture messages (5), data (200MB) and voicemail retrievals (15, each lasting two minutes). The call figures were selected as a test of the participants’ understanding of how call costs are calculated: each call would require two 60-second blocks, or three 30-second blocks, depending on the provider's billing system. Many subjects made poor recommendations after basing their calculations on total monthly calls of 125 minutes: they clearly understood how much time would be spent on calls but showed no appreciation of the significance of calls being charged in 30- or 60-second blocks. Calls and voicemail retrievals could also include connection fees; subjects often failed to include them, sometimes at considerable cost. The figure of 41 domestic SMS messages provided the investigators with the opportunity to see whether subjects approximated this to a round 40, but none did so despite the trivial cost of a single SMS message. To simplify their task slightly, subjects were told to view expiry periods of 28 or 30 days as always equivalent to a month.
Unlike the process tracing studies reviewed in the previous section, this study adopted the experimental economics approach (Smith, Reference Smith1991) of offering participants performance-based rewards. These were based on the difference between the 24-month cost of the plan they recommended (as calculated by the research team, not the participant) and the cheapest available prepaid plan for the usage remit, plus an AU$20 show-up fee. The maximum bonus if they recommended the optimal plan (as three subjects did) was AU$50; at the other end of the reward scale, very poor recommendations yielded only AU$5. Because the remit specified that the recommended service had to be a prepaid one, those who recommended something other than a prepaid service only received the show-up fee. Average earnings, including the show-up fee, were AU$39 (equal to approximately US$37 at the time of the experiment). Each session lasted up to 90 minutes, including instruction and training time.
Before starting, subjects had to practise ‘thinking aloud’ while doing a Google search in an unrelated context, namely, times for a UK rail service. Ericsson and Simon (Reference Ericsson and Simon1993) document that, unlike merely ‘thinking aloud’, requiring subjects to explain what they are doing distorts what they do, so we emphasized during training and in the written instructions that we did not require participants to explain why they were doing what they were doing at any point, and that they should simply say what they were thinking as they went about the task. The video parts of the recordings turned out to be far more valuable than the audio, for the scale of the problem and the time allowed for exploring it were such that as subjects got further into the task they found it harder to ‘keep talking’, often clicking to a different webpage without any comment. Prompts from the session administrator to ‘keep talking’ could have been more frequent and insistent but ran the risk of diverting the subjects’ attention and being viewed as harassment.
To facilitate quantitative analysis, a target sample of at least 40 subjects was set. There were 41 participants (37 current students and two recent graduates at the University of Queensland, plus two non-students), recruited from our experimental economics database using ORSEE (Online Recruitment System for Economic Experiments) (Greiner, Reference Greiner2015). To ensure consistency, the same administrator ran each individual session. Slightly over half of the participants were female (59%), and around half were business and economics students (54%). Two-thirds (66%) were in their second or third year of university study. Many were international students, with 39% speaking a language other than English at home. All had a personal mobile phone.
The subjects were divided between offline (Subjects 1–21) and online (Subjects 22–41) treatments. The online group could freely search the Internet and thus operate as everyday consumers can, aside from not being able to visit any provider's physical stores. Designing an offline environment that precluded MACs and yet was as naturalistic and controlled as possible posed a major challenge. Since the online group needed Internet access by definition, the ideal strategy would be to allow the other group Internet access, too, but block them from accessing any site that would assist them with their choices. A difficulty, however, was how subjects in the offline environment would locate available offers without access to Internet search engines, which we considered to be market institutions. Most probably, subjects would have only examined products offered by providers with whom they were already familiar, whose brand names were themselves acting as market institutions. Hence, instead of allowing offline subjects censored Internet access, we created an offline search environment in which they could only access an archive of clones of each service provider's website.
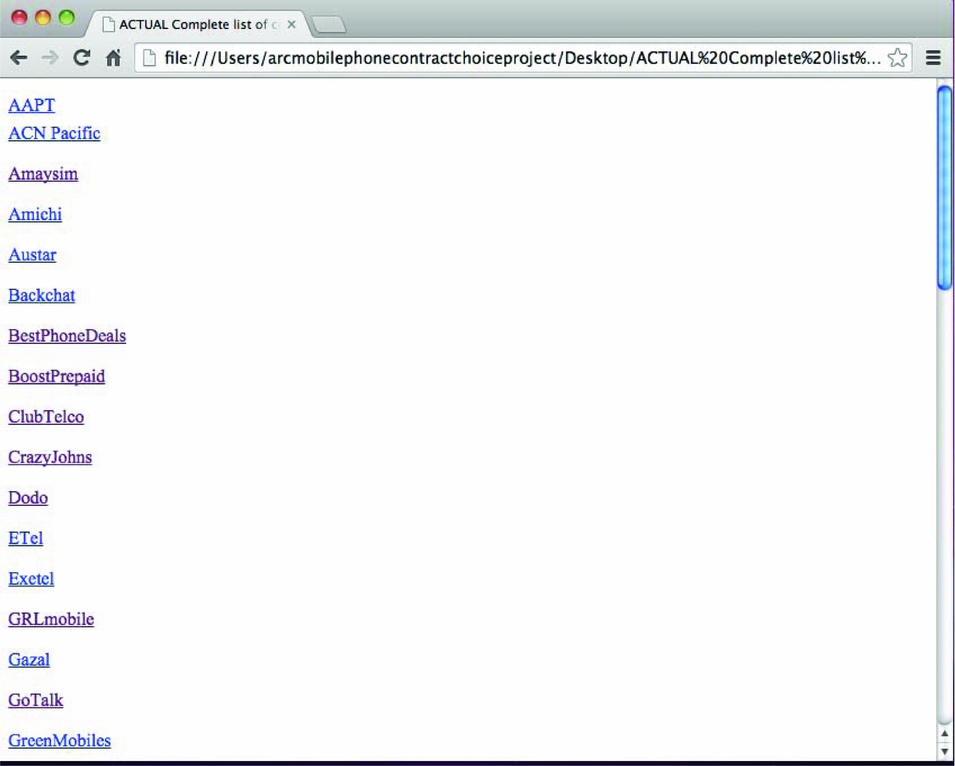
These cloned websites included only pages relevant to the present study, omitting, for example, pages concerning landline phones or broadband. To simplify navigation, the replica sites were programmed so that the cursor arrow lit up in green if a link worked and in black if it did not. The cloned websites were accessed via a home page that consisted of a single column of alphabetically ordered links to providers’ homepages. A long scroll was required to reach the end of this list. The home page (shown in Figure 1) can be viewed as an approximation to what a providers’ trade association might construct to facilitate choice in a world in which potential customers were denied access to search engines, comparison sites, discussion boards and social network sites.
Screen Shot of the Offline Subjects’ Homepage.

Ideally, to control the set of plans between which choices were made, we would have run all the online sessions at the same time on a single day, as well as archiving all the provider websites as they stood at that time, with offline sessions then being run once the working archive had been finished. However, this was logistically impossible under a single administrator and we were mindful of the costs of constructing such an archive, having constructed one at the end of 2010 for an earlier phase of the project of which this study is part. Hence we decided to use this pre-existing archive. Clearly, the choice environment for our experiment was not quite as rigorously controlled as in a traditional economics experiment, but we do not believe this affects the robustness of our findings, despite changes in the choice set between the late 2010 and the third quarter of 2013 when we ran the online sessions. Rather, for reasons that are set out in the paper's Supplementary Material, it appears that, if anything, the choice environment became more challenging during this period, so our results may instead understate the benefits of being able to make MACs.
The cheapest plan for the remit did not change in the period in which the online sessions were undertaken, but the cheapest available plans did differ between the two treatments: offline, the Crazy John's $29 Prepaid Crazy Cap with Bonus Data Option tied with GRL's GRLcap $29 (assuming the latter's voicemail charges could be debited from the included call value as is conventional in the sector, but this was not clear from the archived material and it was impossible to check with the provider as it had exited the market); online, the Virgin $19 Prepaid Cap was the cheapest. This difference reflected Schumpeterian competitive processes associated with the uptake of smartphones and the consequent shift in the focus of competition towards data inclusions in the period between the compilation of the offline archive of providers’ websites and the running of the online experimental sessions. However, the best plans in both treatments entailed complications: offline, the 24-month total for the Crazy John's plan hinged on the presence of a loyalty bonus of 20% more credit with every third recharge; online, the Virgin plan also offered a loyalty bonus, namely, its ‘recharge pay rise’, whereby the amount of ‘included value’ increased in $50 increments on the second, third and fourth credit purchases and then stayed at the level reached on the fourth purchase. Moreover, this plan required 26 blocks of credit to meet the usage remit over 24 30-day ‘months’.
Analysis of the contents of the 41 screen-capture movies involved the following stages. First, we transcribed each audio recording – including all accentuations, pauses, sighs, and so on – with the aid of F4 transcription software. Next, a written narrative (typically, 800–1500 words) and summary table of each movie was prepared in light of a careful viewing, supplemented, where necessary, by the transcript. Each summary table listed the recommended plan and its correct cost (calculated independently by two of the authors), the sequence of providers examined, the amount of time wasted looking at postpaid plans, the total time spent completing the task, and whether the subject provided evidence of misunderstanding the details of any plans. We also tabulated information regarding the online subjects’ use of market institutions, such as the number of Google searches undertaken, the comparison websites and discussion boards visited, and the time spent using each market institution. There was some uncertainty over the total cost of Subject 13’s recommended plan, as she selected the GRL GRLcap $29 plan, whose system for charging for voicemail retrievals was unclear. The primary analysis reported in the paper uses the lowest cost value; however, our results are fully robust to using a more conservative value, for there are only minor changes in significance levels when we use the alternative cost figure in our tests and none of our conclusions change.
4. Hypotheses and Results
Before using the data from the screen-capture movies, we had to resolve an issue inherent in the task remit's requirement that subjects should try to find the best (cheapest) available prepaid plan. To measure the quality of each subject's recommendation we therefore needed to determine if the recommended plan was indeed a prepaid plan. The problem was that consumers, providers, market institutions and the regulatory authorities could differ in how they construe a ‘prepaid’ mobile phone plan; moreover, these constructs could change through time. We dealt with this as follows: if providers classified plans as ‘prepaid’, then so did we.
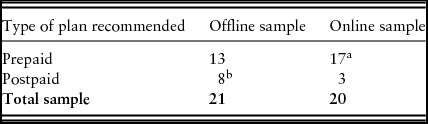
For the online subjects, the providers’ classifications necessarily accorded with those of Australia's Telecommunications Consumer Protection Code (ACMA, 2012, p. 18), but there was potential for them to be misled if comparison sites, which did not have to follow the Code, classified some plans differently. However, the offline subjects were working with plans being offered prior to the introduction of the Code. In 2010, one innovative provider, TPG, was offering plans that it presented as ‘neither prepaid nor postpaid’, which it would have had to list as ‘prepaid’, like their 2013 counterparts, had the Code then applied. A description of how the TPG plans worked is provided in the paper's Supplementary Material. If we classified TPG's plans as ‘prepaid’ for the offline treatment, we would unduly reward those who had failed to notice that TPG had denied (in 2010) that their plans were ‘prepaid’. Hence, we classify TPG plans as prepaid for the online sample but not for the (pre-Code) offline sample. Our results focus on analysing the sample consisting of subjects who recommended an appropriate, i.e. prepaid, option based on this classification. However, our results are robust to classifying all TPG choices as prepaid, apart from minor changes in significance levels, except in the case (Hypothesis 10). Using this categorization, Table 1 shows the types of plans chosen by subjects. Thirteen offline subjects and 17 online subjects recommended a prepaid option and these choices form the core of our analysis. Four subjects in the offline task and two in the online task chose TPG. In both treatments, some subjects recommend options that are clearly classified as postpaid.
Types of Plans Recommended by Offline and Online Subjects

a Includes 2 TPG choices.
b Includes 4 TPG choices.
Our analysis is divided into two parts. First, we consider hypotheses regarding differences between the offline and online groups of subjects (hypotheses H1–H5). Second, we consider how differences in the use that online subjects made of market institutions affected the quality of their recommendations (hypotheses H6–H11). Hypotheses H1–H5 do not entail viewing offline subjects as operating in an institution-free environment; rather, they were deprived of access to Internet resources other than providers’ websites. Hence, their choices could be affected by institutional factors, from lay views of the meaning of ‘prepaid’, to the brand images they assigned to providers in light of their own experience, received wisdom and advertising.
Given the size of our sample, we employ nonparametric statistical tests (Conover, Reference Conover1999). In particular, to compare independent samples, we employ the Mann–Whitney (Wilcoxon) rank-sum test and the Kolmogorov–Smirnov two-sample test, and for correlations, we use the Spearman's rank correlation coefficient.
The impact of access to online market institutions
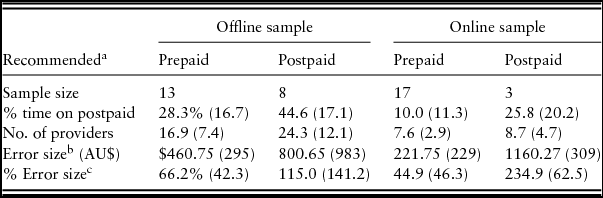
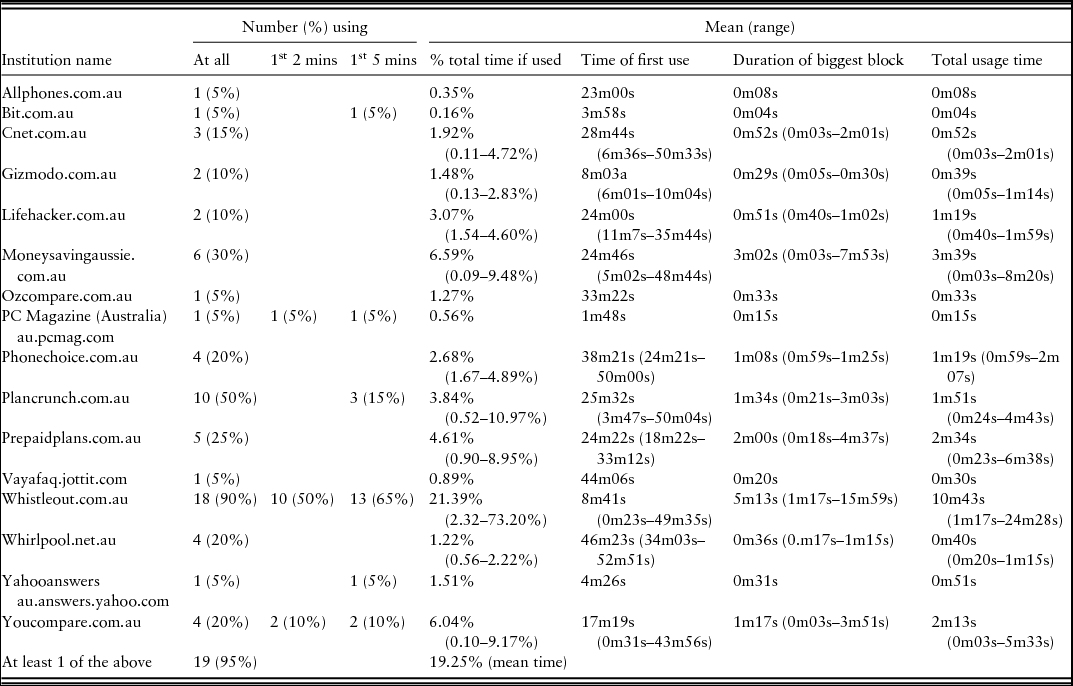
In this section, we investigate whether having access to market institutions results in better decisions. Thus, these are joint tests of the usefulness of the institution as well as consumers’ awareness of them and ability to understand and employ them appropriately. Table 2 reports summary statistics of our key measures, disaggregated by the treatment and by whether the recommended plan was prepaid or not. In this section, unless otherwise stated, all p-values are from two-sided Mann–Whitney tests of treatment differences. The first column of Table 3 lists the set of websites visited by the online subjects. It comprises a mixture of general money-saving and mobile phone plan-specific websites, along with a few discussion boards and geek-oriented sites that include reviews of mobile phone services in the midst of technology news and reviews of other IT products. Though the sites were for Australian consumers, they were otherwise similar to what consumers in other advanced economies can access; indeed, the most widely used site www.whistleout.com.au, a mobile phone plan comparison service, is part of a global operation that includes very similar counterparts in the US (www.whistleout.com) and the UK (www.whistleout.co.uk). Though not precluded from doing so, none of the online subjects tried to employ social networking sites such as Facebook.
H1: Access to online market institutions will reduce the amount of time that subjects spend looking at plans that are not categorized as ‘prepaid’.
Summary Statistics: Mean (Standard Deviation)

a Indicates whether the subject recommended a prepaid or postpaid option. As explained in the text, we consider TPG prepaid for the online sample but not the offline sample.
b Equals the difference between the 24-month cost of the plan recommended by the participant and the cost of the best prepaid option.
c Equals the error size as a percentage of the 24-month cost of the best prepaid plan.
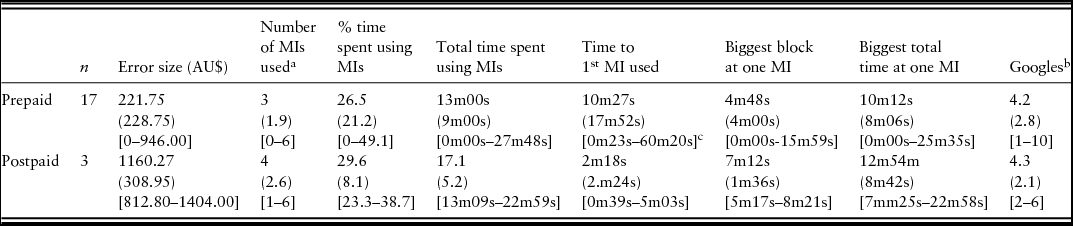
Summary Statistics for the Use of Online Market Institutions (n = 20)

There was considerable potential for wasting time perusing postpaid plans as less than a third of the providers offered prepaid services and providers tended to seek attention on the basis of prices and inclusions rather than the type of service they offered, Given their finite attentive capacities, subjects might forget to keep checking that they were looking at prepaid plans and end up being attracted by the promoted details of plans that were actually postpaid. If online subjects used market institutions to obtain lists that consisted only of prepaid plans, and if the lists were accurate, they would be insulated against this, especially if they could access plan details within market institutions’ websites rather than having to click out to providers’ websites.
Table 2 reports the average percentage of total time spent viewing postpaid plans according to which type of plan the subjects eventually recommended. Access to online market institutions significantly reduced the amount of time subjects spent looking at postpaid products. On average, offline subjects who recommended an appropriate product still spent 28% of their time on postpaid products, whereas for online subjects the average was only 10%, a significant difference (p = 0.0014). Not surprisingly, those who recommended postpaid options spent significantly longer looking at postpaid plans than those who recommended prepaid options in both Offline (p = 0.02) and Online (p = 0.06). This result holds whether TPG is classified in both treatments as prepaid, or in both as postpaid.
Some of the time that online subjects wasted looking at postpaid plans was the result of their clicking directly from Google search results to providers that offered postpaid products. However, many wasted time looking at postpaid plans because of misconceptions about the meaning of a ‘prepaid’ mobile phone plan. Some seemed unaware that if they searched for SIM-only/BYO plans, the results could include both prepaid and postpaid plans listed by the comparison website. Others clicked to comparison sites’ default lists of ‘monthly’ plans, or entered ‘monthly’ rather than ‘prepaid’ into their search engines, seemingly because they viewed anything not on a 12- or 24-month contract as prepaid. Sometimes, when using a comparison site's search engine, subjects forgot to select ‘prepaid’ and were presented with whatever the default setting generated or they selected ‘monthly’ instead of ‘prepaid’. This would not necessarily be a problem, as Whistleout.com.au, the most popular comparison site, offered tabs for ‘prepaid’, as well as ‘monthly’ and ‘contract’ in its search results page. However, six subjects failed to use only the ‘prepaid’ tab.
Some diversions into looking at postpaid products resulted from the design of the comparison sites. Three cases stand out. First, even if subjects selected a plan category, Whistleout.com.au's search engine generated results for all types of plans, leaving it to users to click the appropriate tab. Second, the website designers of Prepaidplans.com.au might have thought they were helping users by including tables for their recommended monthly plans below their recommendations for prepaid ones, but subjects failed to spot this as they scrolled down the site's home page. Given the ‘prepaid’ aspect of the site's name, and the mass of information to process, it is understandable that some subjects clicked to information about the best ‘monthly’ plans. Third, the column for ‘Expiry (days)’ in Moneysavingaussie.com.au's large comparison table included entries for monthly plans from postpaid providers, with their billing cycle (typically 30 days) being listed as the duration of credit. This could be construed as implying that these products were prepaid plans, with subjects acting on that basis until they discovered otherwise.
H2: On average, subjects with access to online market institutions will examine plans from fewer providers than those without such access.
To judge from the transcripts, offline subjects found themselves in an environment in which unfamiliar providers typically appeared to outnumber familiar brands by eight to ten times; moreover, the big-name providers were well out of sight on the home screen, since they all came close to the end of the alphabet (Optus, Telstra, Three, Virgin and Vodafone). These subjects had no obvious basis for discovering which providers offered prepaid services (only one firm, Just Prepaid, signalled this via its brand name), or for guessing which of them might be among the cheapest.
By contrast, the online subjects could use comparison sites to eliminate the postpaid-only providers, and the search engines and recommendations of comparison sites to get an idea of which prepaid providers would be worth their attention. Imperfections in the market institutions would also limit the number of providers considered: the mobile phone service comparison sites each covered less than a third of the providers and the sets they covered overlapped significantly. Hence if online subjects relied upon comparison sites as filters, they would be likely to examine much smaller sets of providers than their offline counterparts. Only two online subjects used Google to try to find a complete list of providers, but in both cases most of the top-rank results were for comparison sites and it was to these that they clicked.
Our data are consistent with H2. Table 2 shows the average number of providers whose sites were examined by offline and online subjects. Offline subjects considered more than double the number of providers that online subjects did, regardless of the recommended plan, and these differences are significant (p = 0.0002 for prepaid, p = 0.02 for postpaid). Offline subjects tended to employ an alphabetical search (14 of the 21 online subjects employed it to some degree), whereas online subjects mostly examined providers based on how comparison sites ranked them by price. Offline subjects who chose a prepaid plan tended to examine fewer providers (17 on average) than those who recommended a postpaid plan (24 on average), but the difference is not significant (p = 0.25).
H3: Access to online market institutions will reduce the incidence of erroneous recommendations of ‘postpaid’ plans.
Online subjects could be guided and kept focused by the specialist websites’ classifications of plans, and hence should have been less likely than the offline subjects to end up recommending postpaid plans. Table 1 shows the distribution of offline and online subjects’ recommendations between prepaid and postpaid plans. Based on our cleanest comparison, 8 of the 21 offline subjects failed to choose a prepaid plan, compared with only 3 of the 20 online subjects, a weakly significant difference (p = 0.10).
Examination of the three cases where online subjects recommended postpaid plans reveals that shortcomings of the market institutions discussed under H1 played key roles in two cases. Subject 38 arrived at two providers of postpaid plans, Vaya and iiNet, via the comparison table at Moneysavingaussie.com.au mentioned under H1. He eventually recommended an iiNet plan with a 24-month cost that came to $1,758, $1,264 more than the cheapest prepaid plan. Subject 41 recommended the Vaya $16 Power Plan, a monthly postpaid plan with a 24-month cost of $1,898, $1,404 more than the cheapest prepaid plan. This disastrous choice was because he visited the Prepaidplans.com.au website and did not notice that the panels below those for its prepaid recommendations listed monthly postpaid plans.
The remaining online participant who wrongly recommended a postpaid plan (Subject 37) appeared to have forgotten the prepaid requirement and/or misunderstood the nature of a prepaid plan. He recommended Vodafone's $30 SIM-only 24-month postpaid plan, with a 24-month cost of $1,306.80, $813.80 more than the cheapest prepaid plan. This was despite the cue provided by the ‘prepaid’ tab in Whistleout.com.au's search results, and despite Vodafone giving him the choice of ‘prepaid’ and ‘SIM-only’ lists.
H4: Access to online market institutions will result in the recommendation of mobile phone connection plans that are, on average, significantly closer to the cheapest available plan than those recommended by offline subjects.
If this hypothesis were falsified, it would mean that MACs were less efficient than SRCs in this context. This would not be entirely surprising: the comparison sites typically covered less than a third of providers (for example, Whistleout.com.au covered 16) and collectively did not cover them all. Information provided by comparison sites could be tainted by conflicts of interest, or be approximations due to incomplete programming of the details of plans in their search engines. Posts from an unrepresentative sample of consumers might have misled subjects who tried to glean insights from discussion board sites such as Whirlpool.net.au. Subjects might also have been led astray if the results of their Google searches were biased by Google's algorithms throwing up results shaped by what past users of Google did when searching in similar territory.
Certainly, there was evidence that the market institutions could have worked better. In addition to examples already given, there are two noteworthy points. First, none of the comparison sites took account of the ‘recharge pay-rise’ aspect of the dominant plan, Virgin's $19 Prepaid Cap. Second, the likelihood of online subjects recommending a TPG plan were greatly reduced because two of the leading comparison sites, Whistleout.com.au and Prepaidplans.com.au, did not include TPG plans on their ‘prepaid’ lists. This was despite TPG describing them as prepaid, consistent with the definition in the Code. This omission was significant, as the cheapest TPG plan was only $5.76 more expensive than the best plan over 24 months and, because it offered enough credit to meet the remit from its basic monthly prepayment, there was no need for subjects to have spotted or understood fine print detailing TPG's complex prepaid credit buffer system. Moreover, unlike Virgin's $19 Prepaid Cap, it did not entail more than 24 credit purchases. TPG plans with $19.99 per month headline prices would readily have attracted attention had they been on the lists of prepaid plans on these two comparison sites. As it was, the only two subjects (subjects 35 and 41) who clicked to TPG plans via Whistleout.com.au did so because they were looking not at ‘prepaid’ search results but at those for ‘monthly’ plans.
The online subjects might have done better had they made more use of the search/calculation engines provided by some comparison sites, even despite the incomplete programming of these devices. However, the online subjects frequently failed to discover that such opportunities existed. Although 18 of the 20 online subjects used Whistleout.com.au, only three of them arrived directly at its homepage, the calculator's location, as their entry point from a Google search. If their Google search specified ‘prepaid’ or ‘SIM-only’, they entered on pages that did not display the calculator and merely provided lists of plans ranked by the plans’ headline charges per month. Two subjects did eventually discover the Whistleout.com.au calculator after entering this way, but for one of these the discovery came in the closing minutes.
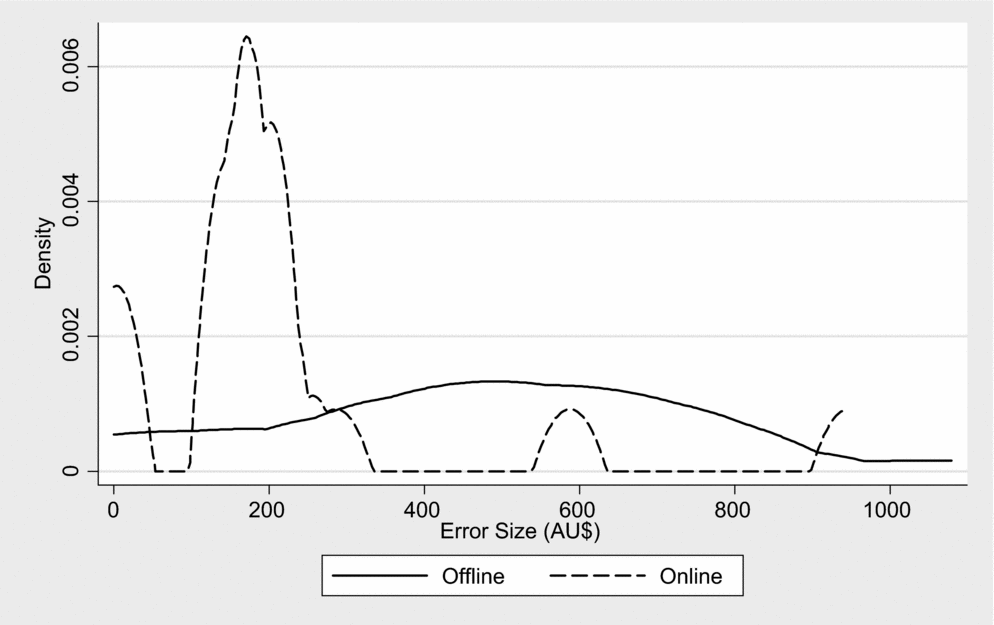
Despite these concerns, the market institutions appeared to function usefully in this context: the online subjects made significantly better recommendations than their offline counterparts. To calculate the excess cost or error size, we compared the 24-month cost of the plan that each subject recommended with the cost of the cheapest available prepaid plan. Summary statistics are reported in Table 2 with the distribution plotted in Figure 2. The two plans that tied as cheapest in the offline treatment were each selected by one subject, with subject 13 impressively ending up with a final choice between both of them, whereas only one subject in the online treatment selected the cheapest plan. For those recommending prepaid options, in the online task the average excess cost was $222, significantly less than for the offline task, where the average was $461 (p = 0.02). As Figure 2 shows, the range of errors was similar across treatments but the errors of most subjects in the online task were lower. A Kolmogorov–Smirnov test confirms the distribution of errors is significantly lower in the online task (one-sided p-value = 0.004).
Kernel Density Plot of Error Size of those Recommending a Prepaid Option.

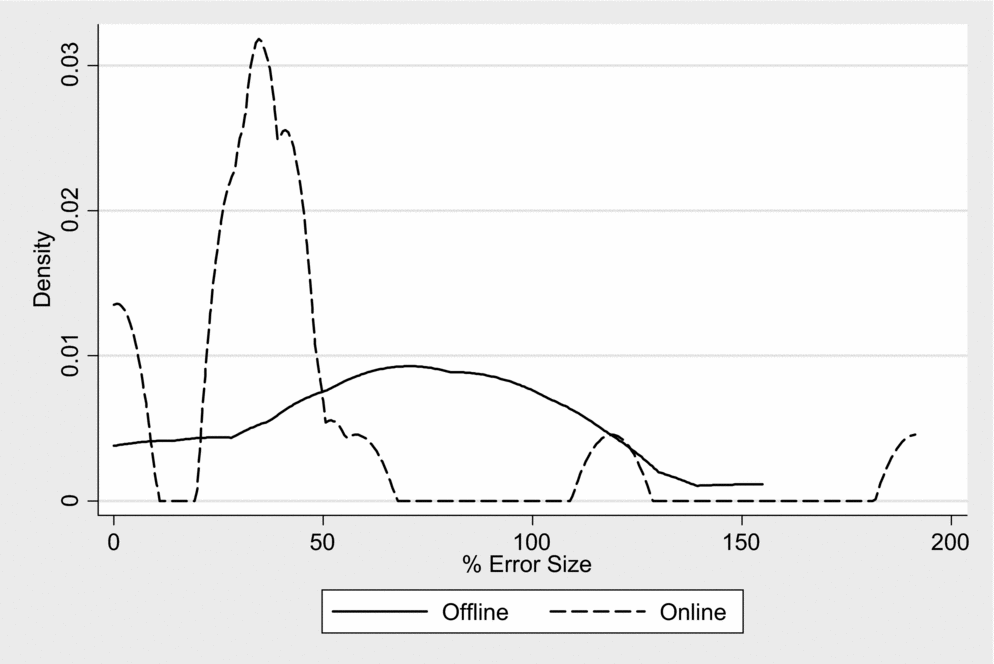
We also constructed a measure of the excess cost as a percentage of the cost of the cheapest prepaid option. This % Error size measure is summarized in Table 2 and plotted in Figure 3. In the offline sample, the average cost of a recommended plan was 66% higher than the best option, compared with only 45% higher in the online sample, but this difference in central tendencies is not significant (p = 0.17). However, as illustrated in Figure 3, the distribution of % Error size was generally lower in the online sample. A Kolmogorov–Smirnov test confirms that the distribution of % Error size is significantly lower in the online sample (one-sided p-value = 0.008). This evidence supports H4. These figures use the best-case value for the GRL plan selected by subject 13 (where, as previously explained, there was uncertainty about how voicemail calls were charged), lessening the advantage of the online sample. Using a more conservative cost value strengthens these differences. It should also be noted that, for reasons spelt out in the Supplementary Material in the discussion of differences between the offline and online plan samples, there are grounds for believing that these results understate the benefits of MACs.
H5: Access to online market institutions will result in subjects on average spending less time arriving at their recommendations.
Kernel Density Plot of Percentage Error Size of those Recommending a Prepaid Option.

Access to market institutions may also result in consumers saving significant amounts of time. In this study, however, the average time spent on the task by online subjects (53m42s, SD = 7m47s) was only slightly less than for offline subjects (56.m16s, SD = 5m08s), an insignificant difference (p = 0.59), although the variation was greater. But only two of the offline subjects finished before the ‘five minutes remaining’ cue, whereas five online subjects did so. Given the scale of the task faced by the subjects, these results are not surprising: the one-hour time limit was likely to be a binding constraint for all but the exhausted or supremely confident subjects, even where they had access to online market institutions.
Determinants of the online subjects’ error sizes
The results in the previous section demonstrate that despite imperfections in market institutions and the bounded rationality of consumers, MACs paid off overall relative to SRCs in this setting. Our online subjects differed greatly in which market institutions they used and how much use they made of them, so we now examine whether differences in the use of online market institutions among those in the online treatment affect decision quality as measured by the error size. We thereby attempt to uncover how the benefits of MACs depend on the time allocation choices that subjects made rather than access to market institutions per se. These choices may be proxies for our subjects’ decision-making skills: it takes wisdom to judge which market-assistance opportunities to take up as means of enhancing one's choice.
Table 3 lists the set of online market institutions that our subjects used and presents summary statistics for the extent and frequency of their use. This table omits Google, the market institution that many subjects used to discover these online resources, but we also recorded the number of Google searches each subject made (reported in Table 4 below), excluding those for any specific provider's website. The most extensively employed institution, Whistleout.com.au, used by all but two online subjects, typically dominated the top of the first page of results in our subjects’ Google searches. This was significant, since subjects commonly did not even to scroll fully to the bottom of the first page of Google search results and only one subject ever ventured beyond the first page.
Summary Statistics for the Use of Market Institutions (MIs) by the Online Sample: Average (standard deviation) [range]

a Number of online market institutions used, excluding Google.
b Number of Google searches excluding those for specific provider websites.
c The maximum time of 60m20s denotes the fact that subject 36 made no use of online market institutions and took 60m20s to complete his session.
Table 3 reveals considerable variation between the online subjects in the sets of market institutions they used and the times at which they used them. For example, while on average they spent 21% of their time at Whistleout.com.au some barely visited and others spent nearly three-quarters of their time there. This variation makes it possible to study the relationship between error sizes and subjects’ use of the market institutions at their disposal.
Table 4 summarizes our measures of the use of market institutions, broken down into the categories of plans chosen by the online sample. Apart from a large difference in error size, there are no obvious differences; if anything, those choosing postpaid appeared to use market institutions more, though, as explained under H3, they used them poorly. In what follows, we focus on whether the use of online market institutions reduced the size of subjects’ errors where subjects adhered to the remit and recommend a prepaid option: the results presented in Table 5, which reports correlations among these measures, use only the data for the 17 online subjects who recommended a prepaid option. For our statistical analysis of H6–H11 we use the nonparametric Spearman's rank correlation statistic (rho), which is suitable for small samples like ours.
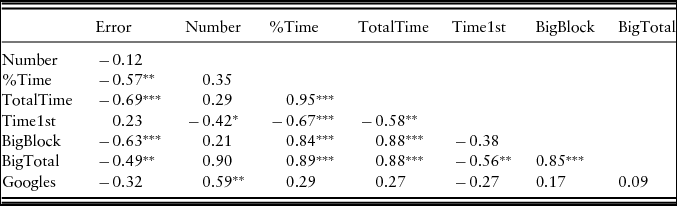
Correlation Coefficients for Use of Market Institutions Among Online Subjects Recommending a Prepaid Option

Notes: n = 17; Table reports Spearman's rank correlation coefficient (ρ); significance of the correlations noted by *p<0.10, **p<0.05, ***p<0.01.
Our hypotheses, and the thinking behind them, are as follows:
H6: The size of error in an online subject's recommendation is an inverse function of the number of online market institutions employed in making the recommendation.
On average, subjects visited three market institutions, although this number ranged from 0 to a maximum of 6. By using a wider range of market institutions, subjects would have more chance of discovering potentially relevant options and be able to limit their risks of being ‘phished’ if comparison sites succumbed to conflicts of interest when presenting search results and recommendations. However, as shown in Table 5, while the correlation between Number and Error is negative, the relationship is weak (ρ = −0.12, p = 0.63). This result is not particularly surprising given the dominance of Whistleout.com.au, as evident in Table 3. Although this site had imperfections, as already explained, it was far more comprehensive than its rivals. It is hard to see how subjects who supplemented this site's services with those of other sites would readily achieve better results than those who concentrated on using this site carefully. Thus, just visiting more institutions is not necessarily beneficial; rather it may be that intensity of use matters, which we explore next.
H7: The size of error in an online subject's recommendation is an inverse function of the total time spent using online market institutions in making the recommendation.
If the market institutions are working efficiently in this context, the more that subjects rely upon them, the smaller is their risk of making errors due to being confused by the service providers’ websites. We consider the effects of both the percentage of total time spent using market institutions (%Time) and the total time spent using market institutions (TotalTime), since spending more time using online market institutions might result in better recommendations being achieved despite a reduction in total time on the task.
On average, subjects spent 27% of their time using market institutions. The only two subjects to complete the task in less than 40 minutes were also the only two who spent more than half their time using market institutions (subject 31, 77% and subject 32, 56%). Unsurprisingly, the two time measures are very highly correlated (ρ = 0.95, p<0.0001). The correlation between Error and %Time is significantly negative (ρ = −0.57, p = 0.02), as well as for TotalTime (ρ = −0.69, p = 0.002). Thus, more time spent using market institutions is associated with better decisions.
H8: The size of error is an inverse function of the time it takes for subjects to start using market institutions rather than trying to work on a recommendation in a self-reliant way by gathering and processing information from providers’ websites.
The more that subjects tried to be self-reliant, the more they risked not discovering cheaper options and/or being confused by the information that providers present. Table 3 reports that half of the subjects found Whistleout within the first two minutes of beginning the task, and on average subjects visited their first market institution within 11 minutes (refer to Table 4). But some subjects took much longer and indeed one never visited any (and in this case we recorded his Time1st as the total time on the task). As reported in Table 5, while the correlation between Time1st and Error is positive, the relationship is not statistically significant (ρ = 0.23, p = 0.38). It remains insignificant (ρ = 0.16, p = 0.56) if the subject who never visited any market institutions is excluded.
H9: The size of error in an online subject's recommendation is an inverse function of the biggest single block of time spent using an online market institution's resources.
Although market institutions exist to help consumers deal with complex choice problems, they, too, may be complicated. Consumers may need to spend time with any comparison site in order to discover what it offers (such as a search engine or calculator) and how best to use it. Spending an unbroken period at a comparison site may also promote a clearer sense of relative value for money offered by providers if it allows them to be compared within a uniform framework. The biggest (continuous) block of time spent at one site on average was around 5 minutes but this ranged from 0 to nearly 16 minutes. As shown in Table 5, there is a strong negative correlation between BigBlock and Error (ρ = −0.63, p = 0.007), thus supporting H9.
H10: The size of error in an online subject's recommendation is an inverse function of the total amount of time spent using the resources of the online market institution most used by that subject.
This is a variation on H9 but acknowledges the possibility that repeatedly visiting a particular comparison site may also enhance a subject's capacity to use it effectively; for example, they may arrive at a previously unnoticed part of it on returning via a different Google search. As shown in Table 4, subjects spent on average around 10 minutes visiting the market institution they used the most. The correlation between BigTotal and Error is significantly negative (ρ = −0.49, p = 0.05) thus supporting H10. Intense use of market institutions is correlated with better decisions. This is the only finding that is overturned if TPG is not classified as prepaid for the online treatment: if we consider only the 15 subjects that chose prepaid excluding TPG then the correlation with BigTotal becomes insignificant (ρ = −0.37, p = 0.17).
H11: The size of error in an online subject's recommendation is an inverse function of the total number of Google searches that they make (excluding the use of Google as a means to find specific providers’ websites).
Subjects who made more Google searches increased their chances of discovering more market institutions and pages on market institutions’ websites. This could reduce their risk of oversight and thereby improve the quality of their recommendations. Subjects on average made four Google searches, ranging from 1 to 10. However, while in the correct direction, the relationship between Googles and Error is not significant (ρ = −0.32, p = 0.21). This finding is consistent with the result for H6 regarding the number of institutions used. As one would expect, Number and Googles are strongly positively correlated (ρ = 0.59, p = 0.01), supporting this explanation.
In summary, we find a strong relationship between more intensive use of market institutions and the quality of recommendations by subjects who recommended prepaid plans. However, if we use data for all 20 online subjects (i.e. including those who recommended a postpaid option), then there are no significant correlations between usage of market institutions and error size. More intensive online market institution use did not compensate for not knowing how to calculate correctly the costs of using mobile phone services or the ways the online market institutions were categorizing different kinds of service plans. This implies that a minimum level of consumer understanding is needed for market institutions to be effective.
5. Conclusion
By tracking the pathways that subjects in offline and online environments took in trying to find the best mobile phone service plan to serve a specific remit, we have shown the significance of online market institutions in this context. Access to these institutions made a profound difference to the recommendation-forming process and the quality of the recommendations. Although the offline subjects did not have to uncover the set of service providers or sources of information about the plans being offered, they struggled to filter and apply the mass of information at their disposal. They typically considered the products of many more providers than their online counterparts did, but on average made inferior recommendations. The online subjects began without any information about what was available, but rapidly discovered details of a useful subset of mobile phone plans, in a form that simplified the process of comparison. The sooner they started using comparison sites rather than relying on the websites of providers, the more time they spent with comparison sites, and the longer their biggest single block of time on any of these sites, the better their recommendation was likely to be – so long as they did not end up taking a path to making the wrong kind of recommendation due to a combination of their own cognitive shortcomings and weaknesses in the designs of the comparison sites they were using.
Although access to online resources resulted in recommendations that were on average better, it did not result in a higher rate of success in identifying the best option. However, our results probably understate the beneficial impact that access to market institutions has on the quality of choice in this context, for the online subjects did not seek inputs from their social networks, such as their Facebook friends, despite not being barred from doing so. They thus did not get the pleasurable social experience that is often part of the process of using these networks en route to choice. It must also be remembered that market institutions will evolve under competitive pressure, and social networks will embody more expertise as time passes. Hence, so long as providers’ skills in ‘phishing for phools’ have not grown more rapidly than the expertise being applied to market institutions, MACs of mobile phone connection service plans are likely to be even more efficient than SRCs now than they were at the time we ran the online sessions in our experiment.
In addition to emphasizing the time-specificity of the study, we note that some hypotheses from our study's context might not apply in other contexts. For example, in trying to find the best hatchback car, spending more time on comparison sites may not yield any benefits after, say, the first 20 minutes, for there is a far smaller range of products and there may be considerable consensus among expert product testers. Indeed, with such a product, it might take next to no time to obtain a summary view from a knowledgeable Facebook friend who has recently visited the relevant sites.
Our study also shows that the benefits of being able to make MACs are a joint product of the quality of the market institutions and how decision makers use them. The bounded rationality of consumers can undermine the gains to be had from MACs. The capacity of market institutions to help consumers sidestep provider-induced information overload will be limited if these institutions cram too much information on their webpages rather than using more pages, linked via clear menu systems tailored to the needs of particular kinds of users. Consumers under time pressure have to limit the number of online searches they undertake and how far they dig into search results, and their choices of Internet search terms can affect which online institutions they discover and the benefits they derive from them.
The issue of choosing efficient search terms is part of a more basic lesson from our study: effective strategies for managing information overload need to be underpinned by relevant knowledge of the area in question, so that appropriate information can be sought from market institutions and used appropriately. Relevant knowledge includes knowing how relevant market institutions can be used and how to judge their quality. The shortcomings of market institutions would matter far less, and the benefits of making MACs would be far greater, if consumers could be educated more (possibly via the market institutions themselves) about the key issues they need to understand in order to make good choices in the context in question.
Supplementary material
To view supplementary material for this article, please visit https://doi.org/10.1017/S174413741700011X
Acknowledgements
This research would not have been possible without financial support from the Australian Research Council (via Discovery Grant DP1093840). This research has been approved by the Behavioural and Social Sciences Ethical Review Committee at the University of Queensland. We are also grateful to three anonymous referees for their comments on the original version of this paper, though the usual disclaimer applies.