Introduction
One approach to treat blindness associated with outer retinal degenerative disorders such as retinitis pigmentosa, Usher’s syndrome, and age-related macular degeneration is to develop a multielectrode prosthetic device that will bypass the missing outer retinal elements (e.g., photoreceptors) and electrically stimulate remaining inner retinal elements (e.g., bipolar and ganglion cells) in a patterned manner. Indeed, such devices have been developed and implanted in human subjects (Yanai et al., Reference Yanai, Weiland, Mahadevappa, Greenberg, Fine and Humayun2007; Besch et al., Reference Besch, Sachs, Szurman, Gulicher, Wilke, Reinert, Zrenner, Bartz-Schmidt and Gekeler2008). Subjects report that retinal stimulation evokes the perception of phosphenes. There has been a great deal of effort in recent years to design, test, and implant various visual prostheses. These efforts were directed primarily at finding safe and effective stimuli, that is, stimuli that will pass an electrophysiological or psychophysical threshold without causing significant damage to the delicate retinal tissue. In vitro experiments with extracellular electrophysiological recordings in isolated retina preparations from a variety of species showed that neuronal activity can be evoked by electrical stimulation (Knighton, Reference Knighton1975a,Reference Knightonb; Humayun et al., Reference Humayun, Propst, de Juan, McCormick and Hickingbotham1994; Greenberg, Reference Greenberg1998; Grumet et al., Reference Grumet, Wyatt and Rizzo2000; Margalit et al., Reference Margalit, Maia, Weiland, Greenberg, Fujii, Torres, Piyathaisere, O’Hearn, Liu, Lazzi, Dagnelie, Scribner, de Juan and Humayun2002; Margalit & Thoreson, Reference Margalit and Thoreson2006). The main goal of early studies was to delineate electrode shapes and pulse parameters for safe and effective electrical stimulation in controlled settings and not to determine underlying mechanisms. More recent studies have begun to examine electrophysiological mechanisms during retinal electrical stimulation. In retinal ganglion cells (RGCs) and visual cortex neurons, epiretinal stimulation evokes both early (≤10 ms poststimulation) and late responses. Late responses are preferentially evoked by longer pulse durations and blocked by inhibiting neurotransmitter release with cadmium or postsynaptic glutamate receptor antagonists (Stett et al., Reference Stett, Barth, Weiss, Haemmerle and Zrenner2000; Jensen et al., Reference Jensen, Ziv and Rizzo2005a; Chen et al., Reference Chen, Mahadevappa, Roizenblatt, Weiland and Humayun2006; Fried et al., Reference Fried, Hsueh and Werblin2006; Margalit & Thoreson, Reference Margalit and Thoreson2006; Shah et al., Reference Shah, Montezuma and Rizzo2006). Direct retinal ganglion cell stimulation thus appeared to be responsible for the early response, while the late response required glutamate release from bipolar cells presynaptic to ganglion cells. Some subretinal electrical stimulation studies reported synaptically mediating spikes occurring <10 ms after stimulus onset (Jensen & Rizzo, Reference Jensen and Rizzo2008; Tsai et al., Reference Tsai, Morley, Suaning and Lovell2009), but other work reported direct activation at 5–10 ms poststimulus (Sekirnjak et al., Reference Sekirnjak, Hottowy, Sher, Dabrowski, Litke and Chichilnisky2006). In voltage-clamped RGCs from amphibian retina, late synaptic currents evoked by epiretinal stimulation were blocked by using glutamatergic blockers, suggesting that they are not related to direct activation of the ganglion cell. They were also blocked by inhibition of GABA or glycine receptors, suggesting that they involve release of glutamate from bipolar cells, which in turn stimulates release of GABA and/or glycine from amacrine cells (Margalit & Thoreson, Reference Margalit and Thoreson2006). Mouse retina is a well-studied neural tissue and has the advantage of providing well-characterized animal models for inherited retinal degeneration. In the present study, we therefore examined whether the same inner retinal circuits are activated by epiretinal stimulation in mouse retina.
It has been suggested that utilizing the inherent signal processing capabilities of the retina by engaging the inner retinal circuitry may provide better visual performance with prosthetic devices than stimulation of ganglion cells alone (Greenberg, Reference Greenberg1998; Jensen et al., Reference Jensen, Ziv and Rizzo2005b; Margalit & Thoreson, Reference Margalit and Thoreson2006; Shah et al., Reference Shah, Montezuma and Rizzo2006). In contrast instead, Fried et al. (Reference Fried, Hsueh and Werblin2006) found that stimulation patterns that activated only ganglion cells accurately replicated natural light responses at stimulation rates up to 250 Hz, suggesting that it is not necessary to activate inner retinal neurons to achieve effective performance. Furthermore, the retinal reorganization that accompanies retinal degeneration is likely to alter the responses of bipolar and amacrine cells to epiretinal stimulation, limiting the benefits that might be obtained by engaging the retinal circuitry with long stimulus pulses (Jones & Marc, Reference Jones and Marc2005). Of particular concern, it has been hypothesized that generation of synaptic responses in ganglion cells by epiretinal stimulation may originate from modulation of glutamate release evoked from photoreceptors (Humayun et al., Reference Humayun, Propst, de Juan, McCormick and Hickingbotham1994; Margalit & Thoreson, Reference Margalit and Thoreson2006). If so, photoreceptor degeneration would limit the ability of prosthetic devices to engage the retinal circuitry. Consistent with this hypothesis, the present study shows that slow synaptic currents evoked by epiretinal stimulation in voltage-clamped RGCs were almost completely absent following degeneration of photoreceptors in rd1 mouse retina. Furthermore, epiretinal stimulation evoked intracellular calcium changes visualized by confocal microscopy in photoreceptor terminals of normal mouse retina. Together, the present results suggest that epiretinal stimulation can activate photoreceptor cells and bipolar cells contributing to the release of GABA and glycine from amacrine cells. The scarcity of synaptic responses in older rd mice suggests that for the treatment of retinal degeneration, it is more fruitful to design implants that target individual RGCs than the retinal circuitry.
Materials and methods
Retinal preparations
We used both whole-mount and slice preparations for experiments with normal and rd mice retinas. We encountered difficulties removing the thick inner limiting membrane and nerve fiber layer from retinal whole-mount preparations of rd mice due to the friable nature of the retina. Several mechanical methods were attempted unsuccessfully to overcome these difficulties, including the use of various vitreoretinal surgical tools [25-gauge disposable forceps (Alcon, Mississagua, Ontario, Canada) and 25-gauge Tano diamond dusted scraper (Synergetics, O’Fallon, MO)]. Finally, one of us (N.B.) developed a technique to expose ganglion cells for recording using two glass pipettes, which were lowered to the level of the nerve fiber layer and then advanced toward each other to penetrate and gently peel apart the inner limiting membrane/nerve fiber layers from opposite sides.
Normal (C57BL6J) and rd (C3HHej) mice, ages 5–75 weeks, were used for these experiments. Mice were handled humanely according to the guidelines of the Association for Research in Vision and Ophthalmology and protocols approved by the Institutional Animal Care and Use Committee at the University of Nebraska Medical Center. The rd mice are homozygous for the retinal degeneration 1 mutation (Pde6brd1), which causes blindness by weaning age. The average age of rd mice used for these experiments was 1 year. Mice were anaesthetized with an intraperitoneal injection of a combination of Ketamine HCl (60 mg/kg; Parke Davis, Morris Plains, NJ) and Xylazine HCl (8 mg/kg; Phoenix Pharmaceutical, Inc, St Joseph, MO) and an eye was enucleated from each mouse. The eye was transferred into a chamber containing heated oxygenated Ames’ medium. The anterior segment was dissected under a surgical microscope, with care taken to limit retinal mechanical stress. To maintain light responses, dissection was performed under infrared illumination. After enucleation, mice were euthanized by CO2 asphyxiation. Flat-mount–isolated retinas were placed vitreal side up on a piece of filter paper (Type AAWP, 0.8-μm pores; Millipore, Bedford, MA). A small hole was cut in the center of the filter paper to allow light to pass through the retina from the microscope condenser below. Slice preparation was similar to the method developed by Werblin (Reference Werblin1978) and described in detail by Wu (Reference Wu1987). For slices, the eyecup was cut into thirds and a section was placed vitreal side down on a piece of filter paper (2 × 5 mm, Type AAWP, 0.8-μm pores; Millipore). After the retina adhered to the filter paper, it was isolated under chilled Ames’ medium. The retina and filter paper were cut into 125-μm slices using a razor blade (#121-6; Ted Pella Inc., Redding, CA) tissue chopper (Stoelting, Wood Dale, IL). Retinal slices were rotated 90 deg to permit viewing of the retinal layers when placed under a water immersion objective (40×, 0.7 Numerical Aperture) and viewed on an upright fixed stage microscope (Olympus BHWI, Tokyo, Japan). Heated (32–33°C) and oxygenated Ames’ medium was delivered to the perfusion chamber at a rate of 1 ml/min using a single-pass gravity-feed perfusion system. The solution was continuously bubbled with 5% CO2/95% O2 (pH 7.4). Drugs were bath applied.
Whole-cell recording
Patch pipettes were pulled on a PP-830 vertical puller (Narishige USA, East Meadow, NY) from borosilicate glass pipettes [1.2 mm outer diameter (OD), 0.9 mm inner diameter, with internal filament; World Precision Instruments, Sarasota, FL] and had tips of ~1 μm OD with resistance values of 8–14 MΩ. The pipette electrolyte solution contained: 120 mM KCH3SO4; 3 mM NaCl, 20 mM HEPES; 3 mM MgCl2; 1 mM CaCl2; 3 mM EGTA; 2 mM glucose; 1 mM MgATP; 0.5 mM GTP (pH 7.2; 310 ± 5 mOsm). Ganglion cells were voltage clamped at a steady holding potential of −70 mV. Current–voltage relationships were measured using a series of 150 ms voltage steps. The passive input resistance averaged ~1.5 GΩ in mice ganglion cells. Consistent with this high input resistance, charging curves in these cells could typically be fit by single exponentials, indicating that they are relatively isopotential and thus amenable to voltage clamp. The reference silver chloride electrode was placed 1 cm from the preparation in the bath. Currents were acquired using a Digidata 1322A interfaces (Molecular Devices, Foster City, CA) with PClamp software (Molecular Devices).
Electrical stimulation
Stimulating electrodes were fabricated from glass micropipettes used for patch clamp recording. Glass electrodes were easier to manipulate than disk metal electrodes. The pipette was filled with extracellular medium and placed at the ganglion cell side, without penetrating the nerve fiber layer, 10–20 μm from the cell body of the recorded cell. Electrode diameters ranged from 17 to 66 μm. Varying electrode tip diameter had little effect on impedance, which was typically ~1 MΩ.
Stimulus waveforms included a single biphasic or monophasic (cathodic) pulse (A-M Systems, Model 2100, Sequim, WA or A.M.P.I., Master 8, Jerusalem, Israel). Although charge-balanced biphasic waveforms have been shown to be the safest method for neuronal stimulation, this was not a critical issue for our short-term experiments, and thus, monophasic cathodic stimuli were commonly used. Bubbles were not observed at the tip of the stimulating electrode during these experiments, suggesting that stimulus voltages did not exceed the water window. Water window is the restriction of electrode polarization below a level that will cause water electrolysis at the electrode–electrolyte interface (Cogan et al., Reference Cogan, Guzelian, Agnew, Yuen and McCreery2004).
Cell identification
Cells were classified as ganglion cells based on their presence in the ganglion cell layer and the presence of prominent fast inward sodium currents. Many cells in the mouse RGC layer (59%) are displaced amacrine cells (Jeon et al., Reference Jeon, Strettoi and Masland1998). It is thus likely that some of the cells we classified as ganglion cells were displaced amacrine cells. ON, OFF, and ON–OFF cell subtypes were classified by the light responses evoked by a bright white light-emitting diode (Pang et al., Reference Pang, Gao and Wu2002).
Ca2+ imaging
Retinal slices were incubated with 10 μM Fluo4-AM dissolved in 0.5 ml Hibernate-A solution (Brain Bits LLC, Sringfield, IL) for ~1 h at room temperature in darkness. Confocal images were acquired using a laser confocal scanhead (Perkin Elmer Ultraview LCI) equipped with a cooled CCD camera (Orca ER, Hamamatsu Photonics, Hamamatsu City, Japan.) and mounted to a fixed stage upright microscope (Nikon E600 FN, Nikon Corporation, Tokyo, Japan). Excitation and emission were controlled by a Sutter Lambda 10-2 filter wheel and controller. Images were acquired and analyzed using UltraView Imaging Suite software. Contrast and brightness were enhanced for illustrations using Adobe Photoshop.
Unless otherwise stated, chemicals were obtained from Sigma-Aldrich (St Louis, MO). The criterion for statistical significance was chosen to be P < 0.05 and evaluated using GraphPad Prism 4.0. Variability is reported as standard deviation (s.d.).
Results
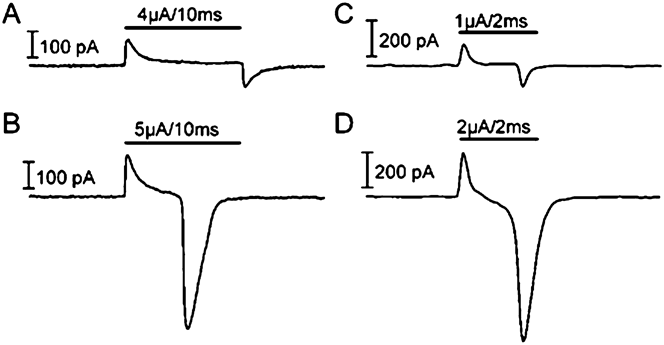
Whole-cell recordings were obtained from RGCs in flat-mount normal and rd mouse retina, as previously described (Thoreson & Miller, Reference Thoreson and Miller1993). Cathodic or bipolar pulses evoked large transient inward currents in voltage-clamped ganglion cells arising from the activation of fast voltage-gated Na+ channels (Fig. 1).
Recording traces from normal (A and B) and rd (C and D) RGCs during electrical stimulation. Subthreshold stimuli are seen in (A) and (C) for normal and rd RGCs, respectively. Threshold stimuli are shown in (B) and (D) for normal and rd RGCs, respectively.

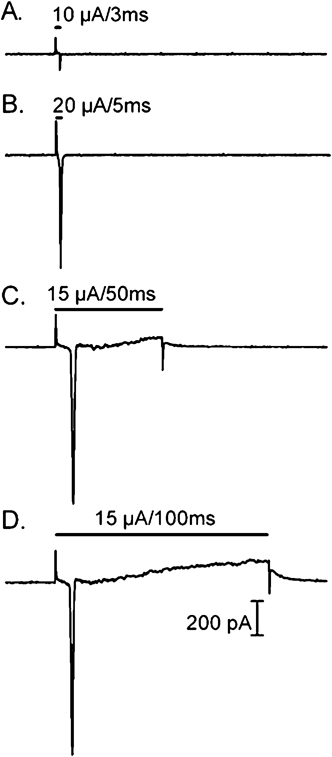
Eighty-seven ganglion cells were recorded from normal mouse retina: 7 OFF cells, 24 ON cells, 18 ON/OFF cell, and 38 cells with unknown light response properties. We observed transient inward action potential currents evoked by pulses as short as 0.3 ms. In all but two cells, suprathreshold charge evoked a single spike even when using quite long stimulus pulses suggesting a single site of spike initiation (Fig. 2). Fried et al. (Reference Fried, Hsueh and Werblin2006) reported that synaptic inputs can generate multiple spikes in some cells, but synaptically mediated depolarization (unlike the depolarization generated by local injection of cathodal current) is prevented by voltage clamping the ganglion cell.
Recording traces from normal mouse RGCs during electrical stimulation. Although stimulus duration was increased from 3 (2A) to 5 (2B), to 50 (2C), to 100 (2D) ms, only a single spike was evoked.

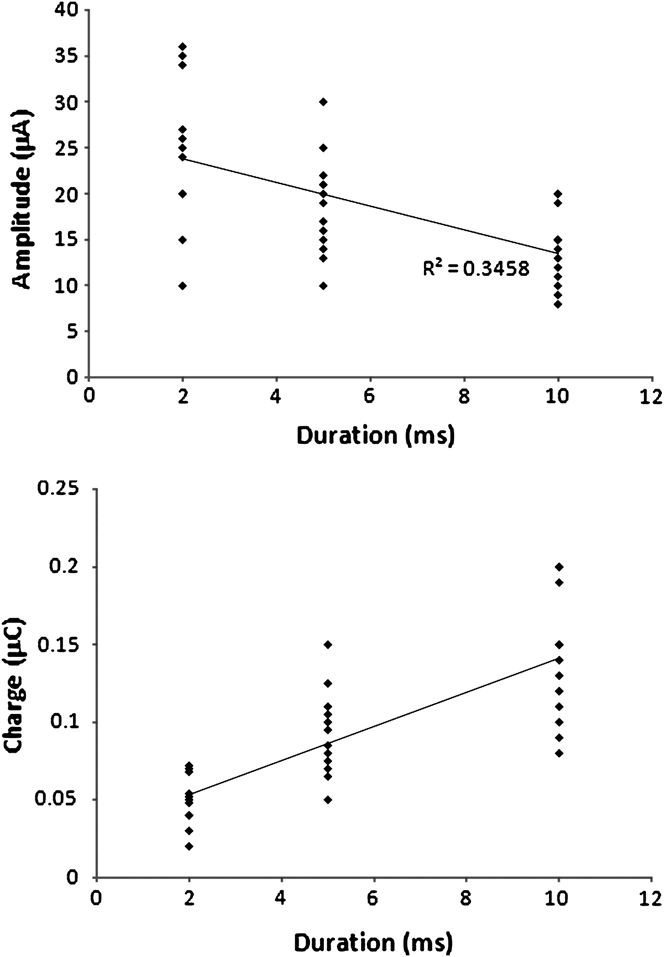
The current threshold required to evoke spikes in ganglion cells from the normal mouse flat-mount preparation averaged 13.7 ± 11.5 μA (s.d., N = 87). The average charge transfer required was 0.043 ± 0.055 μC. The threshold for electrical stimulation depended on both stimulus amplitude and duration. Increasing the stimulus duration reduced the amplitude needed to evoke a response (Fig. 3A). However, comparable to findings of Suzuki et al. (Reference Suzuki, Humayun, Weiland, Chen, Margalit, Piyathaisere and de Juan2004), we found that the charge per pulse increased with longer stimulus duration (Fig. 3B). Thus, our findings suggest that shorter pulses were more efficient at evoking responses than longer pulses since the overall charge transfer required to evoke a response decreased with shorter stimuli (Fig. 3B). There was a statistically significant difference in the charge threshold needed for short and long stimuli. The average charge required was 0.049 μC for 2 ms stimuli versus 0.139 μC for 10 ms stimuli (P < 0.00001, unpaired Student’s t-test). Although they were able to use shorter stimuli than ours because of the smaller electrodes that they used, Sekirnjak et al. (Reference Sekirnjak, Hottowy, Sher, Dabrowski, Litke and Chichilnisky2006) also found that shorter pulses were more efficient at evoking responses than longer pulses since the overall charge transfer required to evoke a response decreased with shorter stimuli.
Amplitude and charge threshold as a function of stimulus duration. (A) The threshold amplitude diminished with longer stimulus duration (N = 36). Spike-evoking stimuli from cells recorded in a normal flat-mount preparation are shown as diamonds. The trend line of this function is shown as well. (B) Charge threshold increased with longer stimulus duration.

Retinal slices have a lower resistive barrier between the stimulating electrode and nearby retinal neurons than flat-mount retinas, but there are also more pathways for current leakage around slices. Compared to whole-mount retina, ganglion cells in the mouse retinal slice preparation required significantly higher currents to evoke spikes (current threshold = 36.1 ± 4.53 μA, charge threshold = 0.20 ± 0.03 μC, P < 0.0001, N = 18). This contrasts with results from salamander retina in which thresholds did not differ significantly between the two preparations (Margalit & Thoreson, Reference Margalit and Thoreson2006).
Synaptic currents
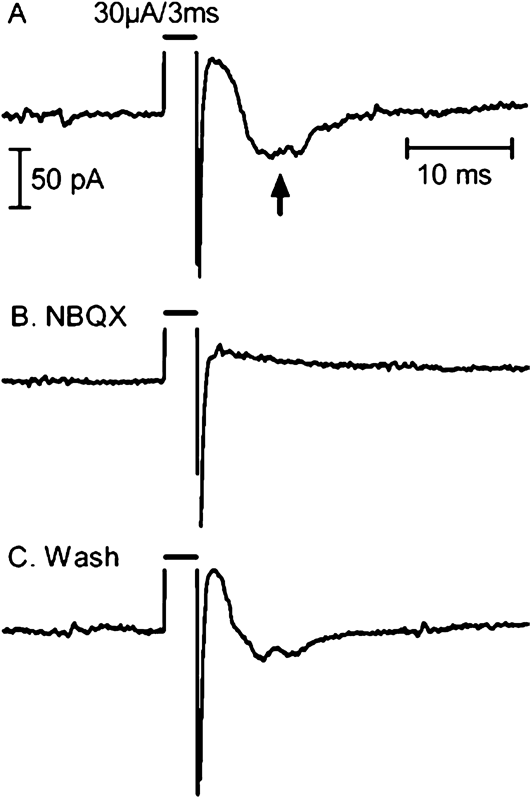
In addition to spikes evoked by brief stimuli, cathodic pulses could evoke sustained inward currents that appeared synaptic in origin (Fig. 4A, arrow). We defined the sustained inward current as an inward current that was clearly visible above baseline noise level in at least three repetitions of the electrical stimulus under the same experimental conditions. Sustained currents were seen in 43% of the cells (N = 38/87). Sustained synaptically mediated currents were observed less often in mouse retina than salamander retina (Margalit & Thoreson, Reference Margalit and Thoreson2006). The average stimulation current (21.7 ± 11.5 μA, N = 38) and charge (0.053 ± 0.04 μC) thresholds for sustained responses were higher than action potential threshold.
Effects of the AMPA and kainate receptors antagonist, NBQX (10 μM), on slow synaptic currents evoked by electrical stimulation. (A) In control conditions, an inward postsynaptic current was evoked following the stimulus pulse (arrow). A small brief inward current likely due to an action potential in distal dendrites was seen within the electrical stimulation artifact. (B) In the presence of NBQX, the postsynaptic current was eliminated, but the action potential was still present. (C) The postsynaptic current recovered after washout of NBQX.

Studies on the origins of similar sustained currents in salamander RGCs suggested that they involved the presynaptic activation of bipolar and amacrine cells (Margalit & Thoreson, Reference Margalit and Thoreson2006). To test whether glutamate release from bipolar cells is required for sustained responses in mouse RGCs, we applied the AMPA/Kainate (KA). receptors antagonist, NBQX (10 μM). In 9 of 10 cells, NBQX diminished or eliminated responses to retinal electrical stimulation (Fig. 4B). NBQX washout restored the sustained currents (Fig. 4C).
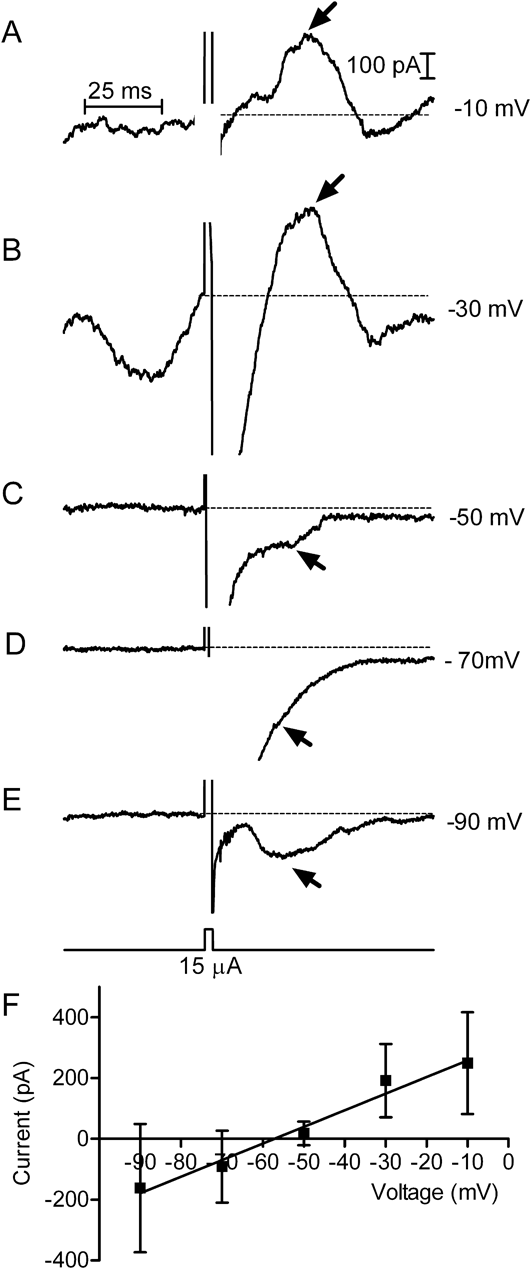
Although the effects of NBQX suggest that glutamate release is required for sustained responses, the reversal potential for slower delayed currents was close to values predicted for ECl, suggesting that inhibitory GABAergic and/or glycinergic currents were largely responsible for these sustained responses, as found in salamander retina (Margalit & Thoreson, Reference Margalit and Thoreson2006). The reversal potential of sustained responses was evaluated by applying stimulus pulses while holding the ganglion cell at different potentials. The membrane potential of the cell was stepped from −70 to the test potential 500 ms before application of the stimulus pulse to allow time for voltage-dependent currents to stabilize. In the example shown in Fig. 5A–5E, slow currents evoked by epiretinal stimulation (arrows) reversed polarity somewhat above −50 mV. Currents were measured relative to the baseline current level just before the stimulus pulse. Linear regression analysis of stimulation-evoked currents measured from 15 cells at holding potentials from −90 to −10 mV indicates a reversal potential of −57 mV, close to the predicted value of ECl (−62 mV, Fig. 5F).
(A–E) Reversal potential of synaptic currents in normal mouse RGCs. The voltage step was applied 500 ms before the stimulus pulse (3 ms, 15 μA) to allow time for voltage-dependent currents to stabilize. The baseline activity in (B) reflects calcium current contributions at this test potential. We measured the peak amplitude of slow synaptic currents attained ≥20 ms after the stimulus pulse (arrows) relative to the baseline current level just before the stimulus (dashed line). Synaptic currents reversed above −50 mV in this example. (F) Linear regression on currents measured at holding potentials between −90 and −10 mV reversed around −57 mV, close to ECl of −62 mV.

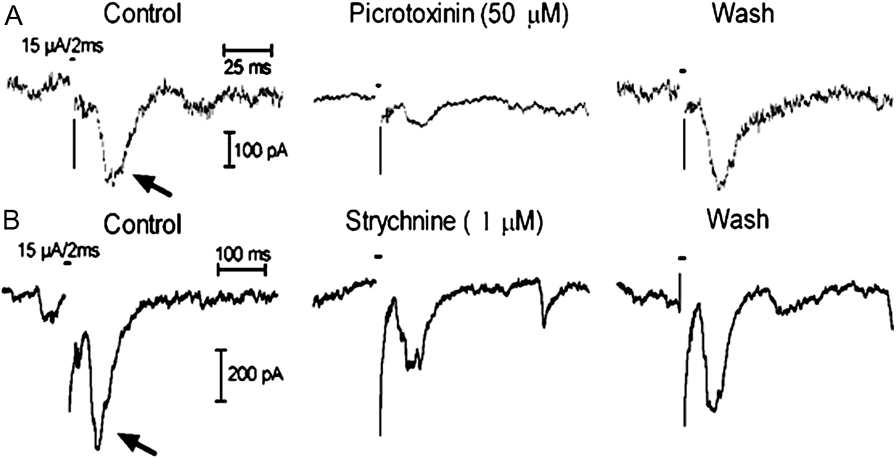
Because they showed a chloride dependence, we examined the role of glycine and GABA receptors in generating sustained responses to electrical stimulation by testing the effects of a glycinergic antagonist strychnine (1 μM) and GABAa/c antagonist picrotoxinin (50 μM). Fig. 6 shows an example in which both picrotoxinin and strychnine inhibited synaptic responses (arrows) in the same cell. Postsynaptic response amplitude either decreased (N = 6; Fig. 6A) or remained the same (N = 6) in the presence of picrotoxinin. Similarly, strychnine caused either inhibition (N = 7; Fig. 6B) or no change (N = 1). In those cells in which we tested both picrotoxinin and strychnine, we found that either strychnine alone (N = 1) or both compounds (N = 6) inhibited synaptic responses. These results suggest that synaptic currents involve contributions from glycine and GABAa/c receptors.
Effects of GABAa/c antagonist, picrotoxinin [50 μM, (A)] and glycine antagonist, strychnine [1 μM, (B)], on synaptic currents (arrows) evoked by electrical stimulation in a normal mouse retinal ganglion cell. Each set of three traces was obtained from the same cell and shows recordings obtained before, during, and after application of a single pharmacological agent.

ON versus OFF ganglion cell responses
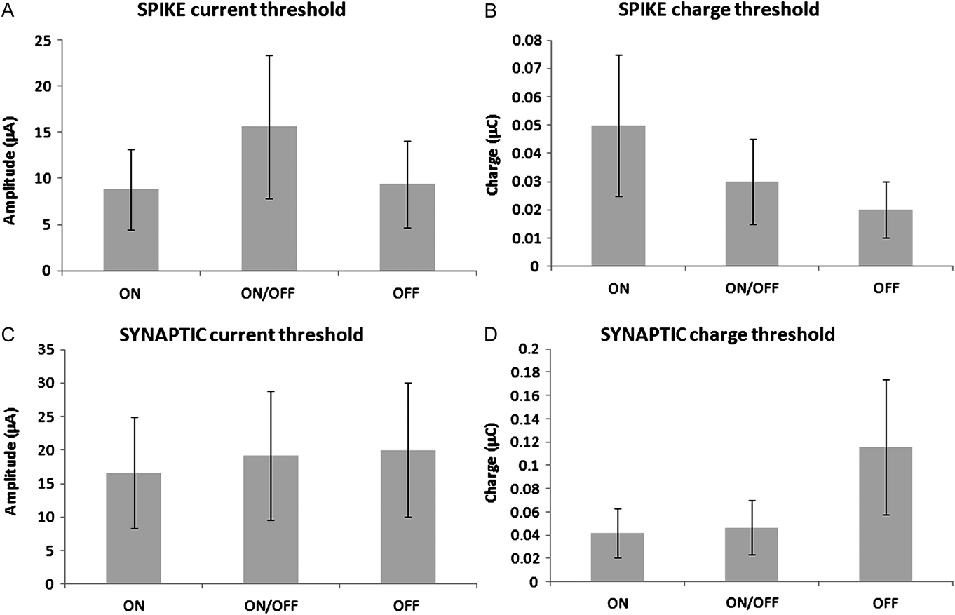
ON ganglion cells have dendrites that ramify closer to the inner (vitreal) surface of the retina than OFF cells. The threshold for activation of ON ganglion cells by subretinal stimulation in rabbit retina was lower than OFF cell threshold (Jensen & Rizzo, Reference Jensen and Rizzo2006). However, this difference was not observed in mouse retina (Jensen & Rizzo, Reference Jensen and Rizzo2009). We compared the sustained (synaptic) and spike response threshold for epiretinal stimulation in ON and OFF ganglion cells (Table 1 and Fig. 7). For spike threshold, we observed no differences between ON (N = 18), ON/OFF (N = 7), or OFF (N = 4) ganglion cells for current amplitude threshold or charge per pulse (P = 0.42). For synaptic response threshold, there was a trend toward lower current (t-test comparing current threshold for ON vs. OFF ganglion cells: P = 0.3) and lower charge amplitude, but it did not attain statistical significance (t-test comparing charge threshold for ON vs. ON/OFF and OFF ganglion cells: P = 0.18).
Average sustained (synaptic) and brief (spike) response threshold stimuli in ON, ON/OFF, and OFF RGCs, in normal mice flat-mount and slice preparations. (A) Spike current threshold (in microamperes). (B). Spike charge threshold (in microcoulombs). (C) Synaptic current threshold (in microamperes). (D). Synaptic charge threshold (in microcoulombs).

Presents the amplitude (in microamperes) and charge (in microcoulombs) threshold for different types of ganglion cells

The standard deviation (s.d.) and the number of sampled cells (N) are shown in parentheses for each cell type.
Comparison with rd mice
Retinal prosthetic devices are designed for use in restoring vision in retinas following photoreceptor degeneration. However, the physiological and morphological changes accompanying retinal degeneration can cause retinal cell responses to electrical stimulation to change. For example, it has been hypothesized that responses to electrical stimulation that activate synaptic inputs to ganglion cells originate in photoreceptors (Humayun et al., Reference Humayun, Propst, de Juan, McCormick and Hickingbotham1994; Margalit & Thoreson, Reference Margalit and Thoreson2006), which disappear during retinal degeneration. We examined responses to epiretinal stimulation in RGCs from flat-mount retinas of relatively old rd mice (~1 year). Unlike younger mice, we did not observe spontaneous current oscillations during whole-cell voltage clamp (Margolis et al., Reference Margolis, Newkirk, Euler and Detwiler2008). Compared to the 38% of ganglion cells in normal retina that exhibited sustained postsynaptic currents, no such currents were seen in 29 ganglion cells from flat-mount retinas from rd mouse. Synaptic responses to epiretinal stimulation were occasionally seen in ganglion cells (2/14 or 14%) from retinal slices of younger 1- to 3-month-old rd mice. The rarity of synaptic responses suggests that a strategy of engaging the inner retinal circuitry during epiretinal stimulation is unlikely to be very helpful in visual processing, at least for the form of retinal degeneration present in rd mouse, and especially in older animals with presumably more extensive retinal damage. These results contrast with the findings by Ye and Goo (Reference Ye and Goo2007b), who found a slow wave component that they attributed to synaptic responses in the same type of rd mouse.
Ye and Goo (Reference Ye and Goo2007a) also reported that lower charge was required to evoke responses during epiretinal stimulation of RGCs in rd mice compared to normal mice . By contrast, other groups have found higher stimulus thresholds in rd mice (Suzuki et al., Reference Suzuki, Humayun, Weiland, Chen, Margalit, Piyathaisere and de Juan2004; O’Hearn et al., Reference O’Hearn, Sadda, Weiland, Maia, Margalit and Humayun2006; Jensen & Rizzo, Reference Jensen and Rizzo2008). We found that the current threshold required to evoke spikes in ganglion cells from the rd mouse retina averaged 30.0 ± 2.94 μA with pulse duration of 2.4 ± 0.45 ms. Both the current amplitude (P < 0.0001) threshold and charge per pulse (0.08 ± 0.05 μC, P < 0.01) were significantly higher for ganglion cells from rd mice than normal mice (normal: 13.7 μA, 0.043 μC).
Peeling away the nerve fiber layer to expose the ganglion cells decreased the threshold for stimulation of ganglion cells in rd mice. The retinas of rd mice are quite friable but with experience we were better able to expose the ganglion cell and thereby obtained progressively lower thresholds. The average charge threshold thus declined from 0.11 μC (N = 8) during our first experiments with rd flat-mount retina to 0.07 μC (N = 21) during our later experiments. In addition to improving access for the patch electrode, better exposure of the soma allowed the simulating electrode to approach the ganglion cell more closely. This supports the suggestion that penetrating electrodes may require lower currents to evoke responses in degenerate retinas than surface electrodes.
Calcium imaging
The small number of cells exhibiting synaptic currents in rd mice suggests that intact photoreceptors may be required for the activation of inner retinal neurons during epiretinal stimulation. To test whether photoreceptors can be directly activated by epiretinal stimulation, we loaded retinal slices with the calcium-sensitive dye, Fluo4-AM, and visualized individual rod cell bodies and terminals by confocal microscopy. As illustrated in Fig. 8, we found that terminals of rods in the outer plexiform layer (OPL) could be activated by stimulation pulses applied to the epiretinal surface. The image in Fig. 8A shows a single confocal section obtained prior to the stimulus pulse, and Fig. 8B shows the same section immediately after the pulse. Cells were considered responsive if a visible increase in fluorescence was observed immediately after the stimulus. Fig. 8C plots the change in Fluo4 fluorescence measured in four different cells at 200 ms intervals. In the retinal slice illustrated in Fig. 8, two terminals in the OPL showed increased Ca2+ responses to stimulation (regions 1 and 3). One of these terminals (region 1) is shown at higher magnification in the inset (arrow). The retinal slice illustrated in Fig. 8 also showed a response from a cell body in the proximal outer nuclear layer (ONL), presumably a rod (region 2). Fig. 8 also shows a fluorescence increase in a faint Fluo4-loaded cell in the proximal inner nuclear layer (INL), presumably an amacrine cell (region 4). Only a few cells showed fluorescence changes in response to stimulation and in many slices (26/37); fluorescence increases were not observed in any cell. Calcium changes were seen more often in the OPL (27 cells) than in the ONL (2 cells), INL (2 cells), or IPL (5 cells). The electrical stimulation threshold for Ca2+ increases in the inner (13.5 ± 1.2 μA) and outer (12.8 ± 2.2 μA) retinas were similar to one another (P = 0.46) consistent with the hypothesis that activation of photoreceptors contributes to synaptic currents recorded from inner retinal neurons.
Epiretinal stimulation evoked calcium responses in the outer and inner retina. (A) Single confocal section of Fluo4-loaded retinal slice obtained prior to stimulation. (B) Same retinal section visualized immediately after stimulation with a 16 μA, 200 ms current pulse applied at the vitreal surface of the slice. The inset shows calcium changes magnified in a small region of the outer plexiform layer (OPL). (C) Graph of Fluo4 fluorescence changes in four regions shown by the circles in (A). Regions 1 and 3 show changes in the OPL, region 2 shows a region in the outer nuclear layer (ONL), and region 4 shows a faintly fluorescent cell in the inner nuclear layer (INL). In this experiment, no changes were observed in the inner plexiform layer (IPL). Scale bar = 10 μm.

Discussion
We found that brief epiretinal stimulation pulses as short as 0.3 ms stimulated fast sodium currents and action potentials in ganglion cells. The short latency to these responses suggest that they are due to the direction activation of Na+ channels in RGCs, which are concentrated in a small region (“the sodium band”) of the proximal axon (Fried et al., Reference Fried, Lasker, Desai, Eddington and Rizzo2009). Stimuli longer than 2 ms were able to evoke more sustained currents arising from synaptic inputs in normal mice ganglion cells. These findings are consistent with earlier studies showing that electrical stimulation of the retina evokes both short (<10 ms) and long latency (>50 ms) responses from visual cortex (Chen et al., Reference Chen, Mahadevappa, Roizenblatt, Weiland and Humayun2006). Shorter electrical pulses appear to target RGCs and their axons, whereas longer pulse durations target deeper cellular elements, which have longer chronaxies than ganglion cells (Greenberg, Reference Greenberg1998). The chronaxie of a neuron is defined as a pulse width for which the threshold current is twice the rheobase current (Ranck, Reference Ranck1975). The rheobase is the minimum threshold current below which an action potential cannot be elicited regardless of pulse duration. This current level can be interpreted as a “leakage” current that can pass through the tissue without inducing depolarization (Greenberg, Reference Greenberg1998). Activation of ganglion cells exhibited a lower threshold than more distal neurons. This phenomenon may be related to a shorter distance between the target cell and the stimulating electrode. The distance of the stimulating electrode from the sodium band of the ganglion cell’s axon is also important (Fried et al., Reference Fried, Lasker, Desai, Eddington and Rizzo2009). One implication of these phenomena is that electrical stimulation of the retina, especially in retinitis pigmentosa patients, which are likely to have diminished inner retinal responses, will typically elicit action potentials in ganglion cells long before synaptic activity is initiated. Together with the finding that rd mice exhibited few synaptic responses, this result suggests that it may be more profitable to concentrate on ganglion cell stimulation rather than stimulation of the retinal circuitry. However, this conclusion is based on our experiments in severely degenerated retina. The results may be different in younger rd mice. Our results also suggest that it is better to use shorter stimuli for another reason. The total charge per pulse is lower when using short versus long stimuli. It is possible that some of the charge of longer stimuli is “wasted” and not utilized for the depolarization of the cell.
Earlier studies show that long latency responses evoked in visual cortex, but not short latency responses, were inhibited by blocking presynaptic release with cadmium or blocking postsynaptic receptors with glutamate antagonists, GABA antagonists, and glycine antagonists (Chen et al., Reference Chen, Mahadevappa, Roizenblatt, Weiland and Humayun2006). Other studies showed that synaptic currents, but not spiking activity, in RGCs were inhibited by the same blocking agents (Stett et al., Reference Stett, Barth, Weiss, Haemmerle and Zrenner2000; Jensen et al., Reference Jensen, Ziv and Rizzo2005a; Fried et al., Reference Fried, Hsueh and Werblin2006; Margalit & Thoreson, Reference Margalit and Thoreson2006; Shah et al., Reference Shah, Montezuma and Rizzo2006). Thus, cortically evoked long latency responses involve retinal synaptic circuitry, whereas cortically evoked short latency responses largely represent the direct responses of RGCs to stimulation. Consistent with earlier results, we found that the AMPA/KA receptor antagonist NBQX abolished slower stimulation-evoked synaptic currents in voltage-clamped ganglion cells, indicating that they require glutamate receptor activation. Similar to findings in amphibian retina (Margalit & Thoreson, Reference Margalit and Thoreson2006), synaptic responses in ganglion cells exhibited a chloride-dependent reversal potential and could be inhibited by strychnine and/or picrotoxinin, suggesting that they also involve GABA and glycine receptors (Margalit & Thoreson, Reference Margalit and Thoreson2006). Picrotoxinin and other GABAa/c antagonists can also act at glycine receptors (Wang & Slaughter, Reference Wang and Slaughter2005). However, the finding that synaptic currents were inhibited by strychnine but not picrotoxinin in one cell suggests at least some selectivity between these compounds in this preparation.
Consistent with activation of inner retinal circuits, epiretinal stimulation also stimulated occasional Ca2+ increases in the IPL and INL of mouse retina. The frequency of calcium increases in these layers was surprisingly low, given the frequency of synaptic currents observed during electrophysiological recording (38%). One possible explanation for this is that the increase in synaptic inhibition accompanying retinal stimulation dominated excitatory stimulation of calcium increases in the inner retina. Taken together, our results suggest that long-duration epiretinal stimulation promotes release of glutamate from bipolar cell terminals. Some of this glutamate is likely to act directly on ganglion cells but much of it acts on amacrine cells to stimulate release of GABA and/or glycine.
Although GABA levels are enhanced in rd mouse retina (Murashima et al., Reference Murashima, Ishikawa and Kato1990; Yazulla et al., Reference Yazulla, Studholme and Pinto1997), we observed very few synaptic responses in rd mice. This suggests that intact photoreceptors may be important for the activation of inner retinal circuits during epiretinal stimulation, although reduced synaptic responses may also involve retinal reorganization and a disruption of the inner retinal circuitry (Jones & Marc, Reference Jones and Marc2005). Consistent with involvement of photoreceptors in sustained responses, we observed stimulation-induced calcium increases in individual rod terminals.
In contrast with the present results showing diminished synaptic currents in rd mice, extracellular recordings from RGCs and visual cortex of rd1 mouse retina showed that retinal stimulation evoked long latency bursts, suggesting that photoreceptor are not required for these responses (Chen et al., Reference Chen, Mahadevappa, Roizenblatt, Weiland and Humayun2006; Jensen & Rizzo, Reference Jensen and Rizzo2008). It is possible that these long latency bursts involve different mechanisms than the synaptic currents recorded from voltage-clamped ganglion cells. However, another possible factor may be that we studied relatively old mice (~1 year) that are likely to exhibit a more severely disrupted inner retina (Jones & Marc, Reference Jones and Marc2005). Consistent with this possibility, we observed synaptic currents more often in retinal slices prepared from younger (1- to 3-month-old) mice. RGCs from relatively young rd mice show spontaneous oscillating bursting activity that diminishes with age (Margolis et al., Reference Margolis, Newkirk, Euler and Detwiler2008; Stasheff, Reference Stasheff2008). Consistent with diminished inner retinal activity, we did not observe these membrane oscillations in older mice, although we have observed them in young rd mice (unpublished observations). The scarcity of inner retinal responses suggests that, at least for older individuals, it is better to target RGCs directly than use stimuli to engage the inner retinal circuitry.
One goal of our study was to examine possible differences in stimulation parameters for ON and OFF ganglion cells. In ON ganglion cells, spikes would presumably produce a perception of light and the converse would be true in OFF ganglion cells. The OFF bipolar cell terminals that provide excitatory synaptic input into OFF ganglion cell dendrites ramify in the more distal half of the IPL layer, whereas ON bipolar cell terminals and ON ganglion cell dendrites are localized to the vitreal half of the IPL. Thus, we hypothesized that ON bipolar cell terminals should be more readily stimulated than OFF bipolar cell terminals and that synaptic thresholds might differ in ON and OFF ganglion cells. Spike threshold might also differ if synaptic inputs from bipolar and amacrine cells strongly influence the thresholds for spike generation. With subretinal stimulation of rabbit retina, threshold currents for cathodal current pulses in OFF RGCs were higher than threshold currents for anodal current pulses. For ON RGCs, threshold currents for cathodal and anodal current pulses were nearly identical and similar to threshold currents of OFF RGCs to anodal stimulation (Jensen & Rizzo, Reference Jensen and Rizzo2006). However, these differences were not observed in mouse retina (Jensen & Rizzo, Reference Jensen and Rizzo2009). In our studies using epiretinal stimulation, we noted a trend for the cathodal current and charge amplitude threshold to be lower for synaptic responses of ON cells compared to OFF ganglion cells. However, this trend did not attain statistical significance, perhaps because of the small sample of pure OFF-type cells. We found no indication for different thresholds in relation to action potentials in ON and OFF ganglion cells. Given that synaptic responses were greatly diminished in rd mouse retinas and the activation thresholds for short latency action potentials did not differ in ON and OFF ganglion cells, it seems unlikely that it will be possible to selectively target ON versus OFF cells during stimulation with retinal prosthetic devices.
Summary
The results show that brief pulses of cathodic or biphasic epiretinal stimulation have a higher probability of activating action potentials in ganglion cells, whereas longer pulses have a higher probability of evoking sustained synaptic currents in a subpopulation of cells. Synaptic currents in ganglion cells involve the stimulation-evoked release of glutamate from bipolar cell terminals, which in turn evokes release of GABA and glycine from amacrine cells. These results are similar to findings in amphibian retina (Margalit & Thoreson, Reference Margalit and Thoreson2006). Because the fundamental structure of the retina is conserved across vertebrate species, it seems likely that epiretinal stimulation will also engage fundamentally similar mechanisms in human retina, although differences in cell size, electrode properties, and electrode distance from target cells are likely to alter the optimal stimulation parameters. While healthy mammalian (including human) retina may be expected to respond similarly to stimulation, the retinal circuitry undergoes significant remodeling during retinal degeneration. Furthermore, we present evidence that photoreceptor inputs are important for long latency synaptic responses in RGCs. Following retinal degeneration, long latency synaptic responses to epiretinal stimulation are greatly diminished. This finding supports the idea that directly targeting RGCs will be more profitable than targeting inner retinal circuitry with prosthetic devices implanted in individual with retinitis pigmentosa or other retinal degenerative diseases.
Acknowledgments
This study was supported by a Veterans Administration Merit Review (C6583R), unrestricted grant from Research to Prevent Blindness, and NEI (EY10546). The authors have no proprietary interests in the materials discussed. This work was done through the VA Nebraska-Western Iowa Health Care System and is based upon work supported by the Department of Veterans Affairs, Veterans Health Administration, Office of Research and Development, Rehabilitation Research and Development Science.