


Introduction
The need for conservation efforts for marine mammals has been recognised since the early 1960s. However, detailed knowledge of the conservation status of many species, particularly subspecies and populations, remains limited, with 10% of all cetacean species classified as ‘data deficient’ (Braulik et al., Reference Braulik, Taylor, Minton, Notarbartolo di Sciara, Collins, Rojas-Bracho, Crespo, Ponnampalam, Double and Reeves2023). This is partly due to challenges in studying cetaceans, including the difficulty of accessing offshore and pelagic populations, low abundance, low fecundity, and large home range. Distinguishing populations based on morphological, behavioural (e.g., prey specialisation), cultural, or ecological differences remains challenging (e.g., Sveegaard et al., Reference Sveegaard, Galatius, Dietz, Kyhn, Koblitz, Amundin, Nabe-nielsen, Sinding, Andersen and Teilmann2015; IUCN Cetacean Specialist Group, 2022). From a conservation perspective, understanding genetic boundaries between populations and potential gene flow is as crucial as other population characteristics for informing effective management strategies. Genetic data are frequently used to determine whether samples from different locations belong to the same population or exhibit genetic differentiation, as geographic separation alone is often insufficient to assess the degree of isolation (Beerli and Palczewski, Reference Beerli and Palczewski2010).
Many marine mammal species, despite inhabiting seemingly boundary-free open waters, exhibit some degree of population structure (Hoelzel, Reference Hoelzel, Würsig, Thewissen and Kovacs2018). In coastal cetaceans, genetic differentiation has been linked to habitat complexity (e.g., estuaries or bays versus open coastline; Möller et al., Reference Möller, Wiszniewski, Allen and Beheregaray2007) as well as resource or habitat specialisation (e.g., Krützen et al., Reference Krützen, Kreicker, MacLeod, Learmonth, Kopps, Walsham and Allen2014; Louis et al., Reference Louis, Fontaine, Spitz, Schlund, Dabin, Deaville, Caurant, Cherel, Guinet and Simon-Bouhet2014; Giménez et al., Reference Giménez, Cañadas, Ramírez, Afán, García-tiscar, Fernández-Maldonado, Castillo and de Stephanis2018). While isolation-by-distance drives genetic differences at larger spatial scales (e.g., Allen et al., Reference Allen, Bryant, Kraus, Loneragan, Kopps, Brown, Gerber and Krützen2016; Parra et al., Reference Parra, Cagnazzi, Jedensjö, Ackermann, Frere, Seddon, Nikolic and Krützen2018), fine-scale genetic differentiation can also arise due to behavioural factors such as social structure and local philopatry (e.g., Wiszniewski et al., Reference Wiszniewski, Allen and Möller2009; Andrews et al., Reference Andrews, Karczmarski, Au, Rickards, Vanderlip, Bowen, Grau and Toonen2010; Kopps et al., Reference Kopps, Ackermann, Sherwin, Allen, Bejder and Krützen2014; Van Cise et al., Reference Van Cise, Martien, Mahaffy, Baird, Webster, Fowler, Oleson and Morin2017).
The population structure of Risso’s dolphins (Grampus griseus) remains relatively understudied. This species occurs in temperate and tropical waters worldwide, primarily inhabiting deeper offshore environments, though it can also be observed in coastal areas. In the eastern North Atlantic, Risso’s dolphins have been recorded in several locations, including the Mediterranean Sea, the coasts of Spain, Portugal, France, and the British Isles, Norway, and the Faroe Islands (Jefferson et al., Reference Jefferson, Weir, Anderson, Balance, Kenney and Kiszka2014; Hartman et al., Reference Hartman, Chen, Hodgins, Ames, van der Harst and Jefferson2025).
In British waters, Risso’s dolphins are found in shelf-edge waters off the Western and Northern Isles of Scotland, the Irish and Celtic Seas, and the western English Channel (Evans et al., Reference Evans, Anderwald and Baines2003; de Boer et al., Reference de Boer, Clark, Leopold, Simmonds and Reijnders2013; Weir et al., Reference Weir, Hodgins, Dolman and Walters2019). Despite their wide distribution, they are not considered particularly abundant in the region. Large-scale cetacean abundance surveys conducted in European Atlantic waters in 1994, 2005, 2016, and 2022 yielded few sightings in earlier years, preventing abundance estimates (SCANS I, II, III, and IV; Hammond et al., Reference Hammond, Lacey, Gilles, Viquerat, Börjesson, Herr, Macleod, Ridoux, Santos, Scheidat, Teilmann, Vingada and Øien2017; Gilles et al., Reference Gilles, Authier, Ramirez-martinez, Araújo, Blanchard, Carlström, Eira, Dorémus, Fernández-Maldonado, Geelhoed, Kyhn, Laran, Nachtsheim, Panigada, Pigeault, Sequeira, Sveegaard, Taylor, Owen, Saavedra, Vázquez-bonales, Unger and Hammond2023). However, the 2016 survey estimated 13,584 individuals across European shelf waters, with 8,687 in the waters of the United Kingdom (UK) (Hammond et al., Reference Hammond, Lacey, Gilles, Viquerat, Börjesson, Herr, Macleod, Ridoux, Santos, Scheidat, Teilmann, Vingada and Øien2017; IAMMWG, 2022). The 2022 survey produced a similar overall estimate (13,854 individuals) but did not provide a specific estimate for UK waters (Gilles et al., Reference Gilles, Authier, Ramirez-martinez, Araújo, Blanchard, Carlström, Eira, Dorémus, Fernández-Maldonado, Geelhoed, Kyhn, Laran, Nachtsheim, Panigada, Pigeault, Sequeira, Sveegaard, Taylor, Owen, Saavedra, Vázquez-bonales, Unger and Hammond2023). These surveys do not generate data that allows determination of sub-populations, and no separate regional abundance estimates have been made, nor is there any information on population trends at a resolution relevant to conservation and management. Consequently, all Risso’s dolphins in UK waters are currently considered part of a single Management Unit (MU) (IAMMWG, 2023).
At a smaller scale, photo-identification catalogues indicate site fidelity in certain regions of Scottish waters (Weir et al., Reference Weir, Hodgins, Dolman and Walters2019; Hodgins et al., Reference Hodgins, Steel, Dyke, Walters, Dolman, Hall, Neave-webb, Evans, Bird, Robinson, Marwood, Foubister, Harrop, Knight and Munro2024), suggesting that individuals may have relatively restricted home ranges, though the extent of population connectivity remains unclear. Gaspari et al. (Reference Gaspari, Airoldi and Hoelzel2007) found that Risso’s dolphins in British waters are genetically distinct from and less genetically diverse than those in the Mediterranean, leading to the recommendation that the British population should be managed separately from the ‘European stock’. As it remains uncertain whether Risso’s dolphins in British waters form a single, panmictic population or exhibit genetic substructure, this study used samples collected through decades of UK stranding network efforts to investigate their population structure and genetic connectivity using autosomal markers. Additionally, we analysed mitochondrial DNA (mtDNA) haplotypes in a global context to assess their phylogeographic placement.
Materials and methods
Study area, sampling, and DNA extraction
The samples were collected from deceased stranded animals between 1992 and 2016 in England and Wales by the Cetacean Strandings Investigation Programme (CSIP) and in Scotland by the Scottish Marine Animal Stranding Scheme (Figure 1; Supplementary Information S1). All cetacean necropsies (including tissue sampling) were conducted using standardised procedures (Kuiken and Hartman, Reference Kuiken and Hartman1991). A 4 cm2 portion of epidermal tissue was taken from each of the stranded animals and stored frozen at −20°C before proceeding to DNA extraction. Genomic DNA was extracted using the Gentra Puregene DNA Purification Kit/DNeasy® Blood and Tissue Kit (Qiagen, Hilden, Germany) following the manufacturer’s suggested procedures.
Sampling locations and distribution of mitochondrial DNA (mtDNA) haplotypes of our British samples. Pie charts show the sampling size and haplotype compositions in three predefined geographic regions (UK_East, UK_West, and UK_South), delineated by dashed lines (6°W and 55°N).

Figure 1 Long description
The map of the UK illustrates haplotype distribution across three regions: UK West, UK East and UK South. Each region is represented by a pie chart showing the proportion of different haplotypes. The legend identifies haplotypes as HapA, HapB, HapC, HapD, HapE, HapF and Unknown, using distinct symbols. Sampling sizes are indicated by pie chart segments, with sizes of 25, 16 and 9. UK West shows a large proportion of HapA, while UK East has a more diverse distribution. UK South has a smaller sampling size with a notable presence of HapA and Hap_B. Symbols on the map indicate sampling locations, with stars and circles marking different haplotypes. The map includes latitude and longitude lines, a scale bar of 200 km and a compass for orientation.
Population structure based on autosomal data
We amplified 16 autosomal microsatellite loci – Tur4_66, Tur4_87, Tur4_91, Tur4_98, Tur4_105, Tur4_108, Tur4_111, Tur4_117, Tur4_128, Tur4_138, Tur4_141, Tur4_E12, Tur4_D8, Tur4_F10, MK6, and D22 (Nater et al., Reference Nater, Kopps and Krützen2009) – in three multiplex Polymerase Chain Reactions (PCRs). Due to poor sample quality, each PCR was repeated at least three times, and each microsatellite locus was run at least twice to ensure accuracy. A locus was only considered homozygous if the same allele was observed in all three independent PCRs. PCR fragments were sized by an ABI 3730 DNA sequencer (Applied Biosystems) and analysed with GeneMapper v4.0 (Applied Biosystems). Samples with 10 or more loci genotyped were retained for further analyses.
To assess population structure, we used STRUCTURE v2.3.4 (Pritchard et al., Reference Pritchard, Stephens and Donnelly2000), an unsupervised clustering approach that minimises departures from Hardy–Weinberg Equilibrium (HWE) by assigning samples into k clusters without using sampling location as prior information. We tested k values from 1 to 6, allowing for correlated allele frequencies and different FST values among subpopulations. Each run consisted of a 100,000-step burn-in followed by 500,000 MCMC iterations, with five independent replicates per k. STRUCTURE results were visualised using Structure Harvester (Earl and VonHoldt, Reference Earl and VonHoldt2012).
For frequency-based approaches, we divided samples into three geographic regions based roughly on their collection locations: ‘South’ (south of 55°N, including the west coast of England and Wales), ‘West’ (west of 6°W and north of 55°N, including the west coast of Scotland, Outer Hebrides, and islands off the western Scottish coast), and ‘East’ (east of 6°W, including the north and east coast of Scotland, Orkney, and the Shetland Islands) (Figure 1).
To estimate genetic diversity within these three regions, we calculated the number of alleles per locus (Na), the effective number of alleles per locus (Ne), the number of private alleles, and observed and expected heterozygosity using GenAlEx v6.503 (Peakall and Smouse, Reference Peakall and Smouse2006). Tests for HWE deviations and linkage disequilibrium (LD) between loci pairs were conducted in GENEPOP v4.2 (Rousset, Reference Rousset2008). Genetic differentiation among the three regions was assessed using Analysis of Molecular Variance (AMOVA) in Arlequin v3.5.2.2 (Excoffier and Lischer, Reference Excoffier and Lischer2010), with pairwise FST values and Slatkin’s genetic distances estimated. Significance was determined via 1,000 permutations.
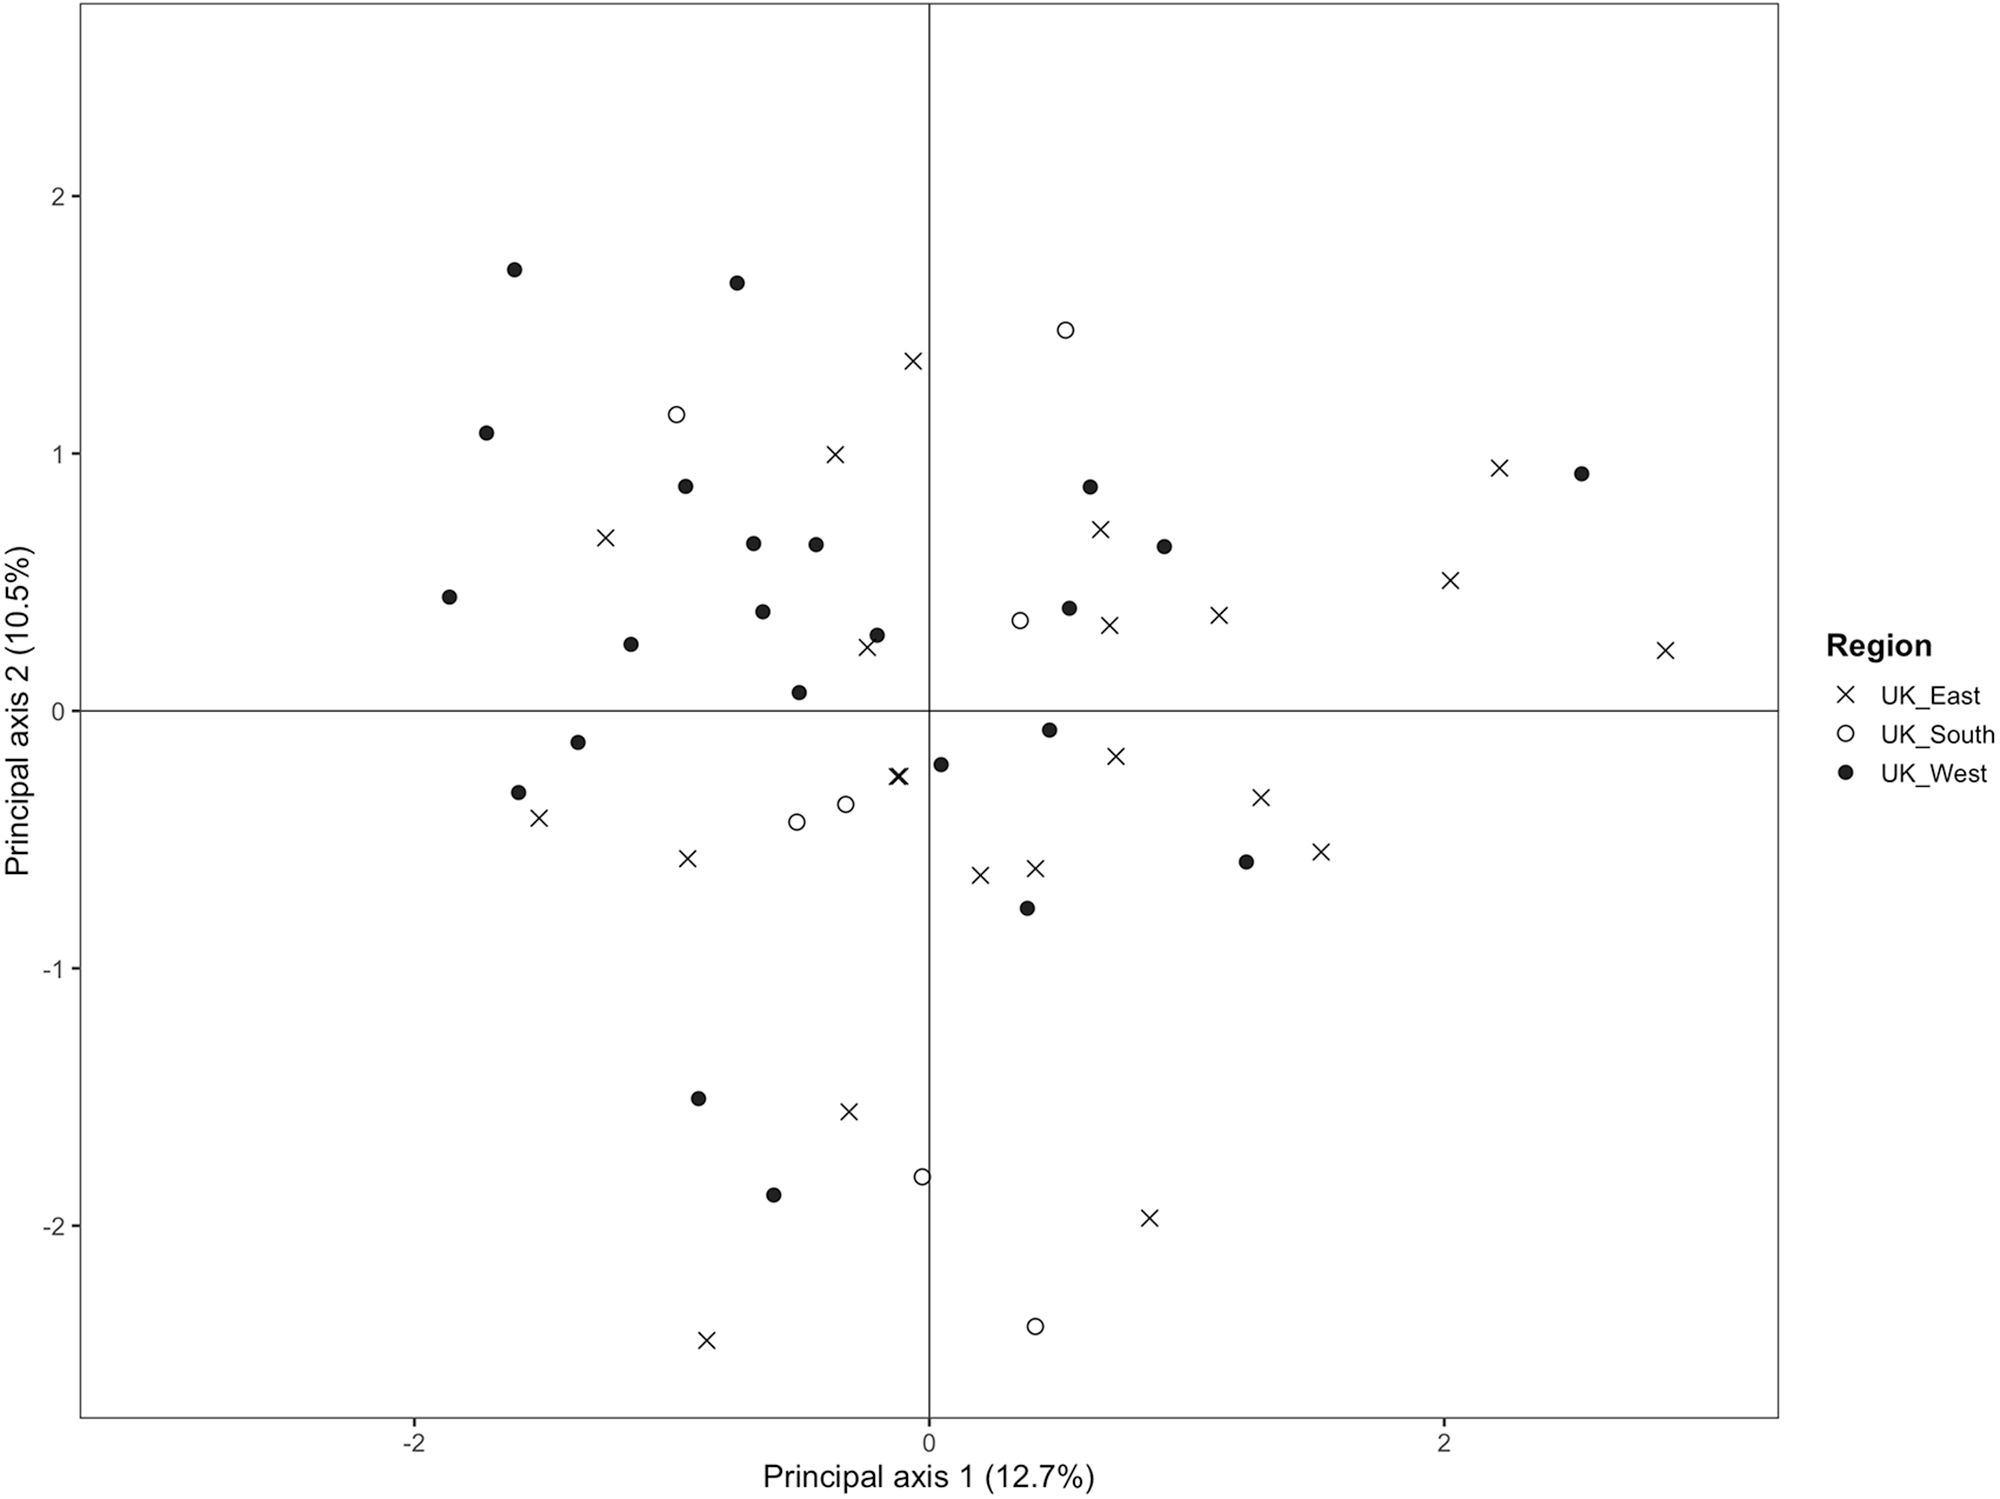
To infer migration rates per generation, we used BayesAss v3.0.3 (Wilson and Rannala, Reference Wilson and Rannala2003), which applies the Markov Chain Monte Carlo (MCMC) algorithm to estimate the posterior probability distribution of migrants between populations. Five independent runs of 10,000,000 generations were performed, each with a burn-in of 1,000,000 generations. Mixing parameters (m = 0.1, a = 0.6, f = 0.4) were adjusted to ensure optimal MCMC acceptance rates. Finally, we conducted a Principal Component Analysis (PCA) using the ade4 package in R v3.3.1 (Dray and Dufour, Reference Dray and Dufour2007; R Core Team, 2016) to visualise population structure.
Population structure based on mtDNA data
We amplified the hypervariable region of mtDNA (the proline transfer RNA gene and part of the hypervariable region I of the control region) using standard PCR with primers dlp1.5 and dlp5 (Dalebout et al, Reference Dalebout, Van Helden, Van Waerebeek and Baker1998). PCR products were purified using a purification column (Qiagen, Hilden, Germany) and subsequently sequenced using the dlp1.5 primer with the ABI BigDye® Terminator v3.1 Cycle Sequencing Kit (Applied Biosystems). Sequencing was performed on an ABI 3730 DNA Analyser (Applied Biosystems). We quality-checked the sequencing reads using SeqMan Pro (LASERGENE v14, DNASTAR), where we also aligned and trimmed sequences before exporting the data as a FASTA file for further analysis. Haplotypes were inferred, pairwise population FST values (for the three assigned geographic regions; Figure 1) were estimated, and an AMOVA was conducted using the R package pegas (Paradis, Reference Paradis2010).
Phylogenetic analysis
To examine the relationships among all British haplotypes and place them in a global context, we incorporated published sequences from the North Pacific (Japan, Taiwan, the Philippines, Mexico, and the USA; GenBank accession numbers MH176356–MH176410; Chen et al., Reference Chen, Nishida, Chou, Tajima, Yang, Isobe, Yamada, Hartman and Hoelzel2018), the South Pacific (Chile; GenBank accession numbers OQ924496–OQ924497; Kraft et al., Reference Kraft, Rodríguez, Olavarría, Poulin and Pérez-álvarez2023), the Mediterranean Sea (Italy, Israel, and Spain; GenBank accession numbers DQ668035–DQ668047; Gaspari et al., Reference Gaspari, Airoldi and Hoelzel2007), and the North Atlantic (Azores and previously reported British sequences; GenBank accession numbers DQ668048–DQ668050 and MH176411–MH176424; Gaspari et al., Reference Gaspari, Airoldi and Hoelzel2007; Chen et al., Reference Chen, Nishida, Chou, Tajima, Yang, Isobe, Yamada, Hartman and Hoelzel2018). A sequence from a false killer whale (Pseudorca crassidens), a closely related species to Risso’s dolphin, was included as an outgroup (GenBank accession number HM060332).
All mtDNA sequences were aligned and trimmed to generate consensus sequences using Unipro UGENE v35.1 (Okonechnikov et al., Reference Okonechnikov, Golosova and Fursov2012). Haplotype relationships were visualised using a median-joining network constructed in POPART (Leigh and Bryant, Reference Leigh and Bryant2015). Bayesian phylogenetic inference was conducted in MrBayes v3.2.6 (Ronquist et al., Reference Ronquist, Teslenko, van Der Mark, Ayres, Darling, Höhna, Larget, Liu, Suchard and Huelsenbeck2012) under the GTR + I + Γ substitution model, which incorporates gamma-distributed rate variation and a proportion of invariable sites. Two independent MCMC runs were performed with sampling every 100 generations and continued until the average standard deviation of split frequencies fell below 0.01, indicating convergence.
Results
Genomic DNA of 72 Risso’s dolphins stranded in the British Isles between 1992 and 2016 was used in this study. Among them, 52 individuals were used for autosomal microsatellite and 60 individuals for mtDNA analyses (Supplementary Information S1). The analyses of both autosomal and mtDNA data suggested no genetic structure or phylogenetic differentiation among Risso’s dolphins in British waters. On a larger scale, our analysis suggested some geographic structure in a worldwide context based on mtDNA, as all six haplotypes found formed a well-supported distinct clade separated from the other Risso’s haplotypes analysed.
Autosomal data analysis
Of the 16 microsatellite loci analysed, 1 deviated from HWE (Tur4_E12), and 4 were monomorphic (Tur4_98, Tur4_105, Tur4_111, Tur4_138; Table 1). The mean number of effective alleles per locus and unbiased heterozygosity were both relatively low, indicating reduced genetic diversity in British Risso’s dolphins compared to other populations (e.g., Chen et al., Reference Chen, Nishida, Chou, Tajima, Yang, Isobe, Yamada, Hartman and Hoelzel2018).
Heterozygosity estimates and fixation indices for 16 microsatellite loci

Table 1 Long description
The table reports genetic diversity metrics per microsatellite locus, including sample size, allele counts, heterozygosity measures, and a fixation index. Sample sizes per locus range from 38 to 52 individuals, averaging about 49. Four loci are monomorphic (Tur4_105, Tur4_111, Tur4_98, Tur4_138), indicating no allele variation at those markers. Among polymorphic loci, allele counts range from 2 to 8, with the highest effective allele numbers at D22 (about 4.42) and Tur4_108 (about 4.15). Observed heterozygosity spans from about 0.10 (Tur4_66) to about 0.77 (Tur4_F10), while expected heterozygosity ranges from about 0.09 (Tur4_66) to about 0.77 (D22). The mean observed and expected heterozygosity are both about 0.34, and the mean fixation index is close to zero (about minus 0.01), suggesting little overall deviation from random mating across loci. Individual loci vary, with the largest positive fixation index at Tur4_E12 (about 0.33) and several negative values indicating higher observed than expected heterozygosity at those loci. Means and standard deviations summarize across loci and should be interpreted with the presence of monomorphic markers and differing sample sizes in mind.
N, number of individuals; Na, number of alleles; Ne, effective number of alleles; Ho, observed heterozygosity; He, expected heterozygosity; uHe, unbiased expected heterozygosity; F, fixation index; SD, standard deviation.
STRUCTURE analysis identified a single genetic cluster as the most likely population structure scenario (Figure 2), suggesting the absence of autosomal genetic structure in our data set.
Results of the STRUCTURE analysis. The left panel shows assignment probabilities for five runs with K = 2–6. The right panel displays ΔK (top) and Prob(K) (bottom) for K = 1–6 across independent runs.

Figure 2 Long description
The image A showing cluster membership bar plots labeled K equals 2, K equals 3, K equals 4, K equals 5 and K equals 6. Each plot is divided into three labeled groups: East, South and West. Each group contains many thin vertical bars. Each bar is split into stacked segments representing membership proportions across clusters, with the number of segments increasing from K equals 2 to K equals 6. The image B showing a line plot with x-axis label K and y-axis label Delta K. The x-axis range is 1 to 6. The y-axis range is 0.0 to 3.0. Labeled plotted values are 0.09 at K equals 2, 3.06 at K equals 3, 2.78 at K equals 4 and 0.9 at K equals 5. The highest labeled value is 3.06 at K equals 3. The image C showing an error bar plot with x-axis label K and y-axis label Mean LnP(K). The x-axis range is 1 to 6. The y-axis range is negative 1000 to negative 970. Points with vertical error bars are plotted at K equals 1, K equals 2, K equals 3, K equals 4, K equals 5 and K equals 6. Across the three images, the cluster membership bar plots vary by K and the two K-based plots provide Delta K and Mean LnP(K) values across K.
Similarly, frequency-based approaches, including AMOVA (Table 2) and PCA (Figure 3), yielded results consistent with the STRUCTURE analysis. When individuals were grouped into three regional assignments based on geographic criteria, no genetic differentiation was detected.
Analysis of molecular variance (AMOVA) based on autosomal microsatellite data, with variance components estimated among three geographic regions (UK_West, UK_East, and UK_South; see Figure 1)

Table 2 Long description
AMOVA results partition genetic variation from autosomal microsatellite data into differences among three regions, among individuals within regions, and within individuals. The within-individual component dominates, with a variance component of 0.90 and 108.02 percent of the total variation. Differences among regions are minimal, with sum of squares 1.61, variance component 0.00, and 0.14 percent of variation. Variation among individuals within regions is negative, with sum of squares 37.59, variance component minus 0.07, and minus 8.17 percent, which can occur due to sampling error or estimation and is typically interpreted as effectively zero. Totals are 103 degrees of freedom, sum of squares 86.20, and total variance component 0.84.
Principal component analysis (PCA) of microsatellite data for all samples collected from three geographic regions in British waters (UK_West, UK_East, and UK_South; see Figure 1).

BayesAss analysis further supported the absence of genetic structure. The estimated fractions of individuals in the destination ‘population’ identified as migrants per generation, although not direct Nm estimates, were consistently high (Table 3), aligning with findings from all previous analyses.
Recent migration rates (±SD) among the three geographic regions, as estimated using BayesAss

Table 3 Long description
The table reports estimated recent migration rates between three regions, with a standard deviation shown for each estimate. Rows indicate the destination region and columns indicate the source region. Staying within the same region is highest in all cases: UK_South from UK_South is 0.71 with plus or minus 0.04, UK_West from UK_West is 0.72 with plus or minus 0.07, and UK_East from UK_East is 0.76 with plus or minus 0.08. Between-region migration into UK_South is low, at 0.04 from UK_West and 0.06 from UK_East. Migration into UK_West is higher, especially from UK_East at 0.23, compared with 0.11 from UK_South. Migration into UK_East is 0.18 from UK_South and 0.18 from UK_West. Overall, within-region retention dominates, and the strongest directional exchange is from UK_East to UK_West, while uncertainty is moderate and should be considered when comparing close values.
Mitochondrial DNA analyses
Sequencing a 433 bp mtDNA sequence from 60 individuals revealed 6 haplotypes within the British Risso’s dolphin population (Supplementary Information S2). Two haplotypes (Haplotypes A and C) were dominant across all three geographic regions in the British Isles (Figure 1, Table 4). Overall haplotype diversity was 0.528, and nucleotide diversity was 0.002; both were lower than reported for populations in the North Pacific, the Azores, and the Mediterranean Sea (Gaspari et al., Reference Gaspari, Airoldi and Hoelzel2007; Chen et al., Reference Chen, Nishida, Chou, Tajima, Yang, Isobe, Yamada, Hartman and Hoelzel2018). AMOVA results indicated that genetic variation among geographic regions within the British Isles was not statistically significant (FST = 0.031, p = 0.168; Table 5). This aligns with the haplotype distribution pattern shown in Figure 1, which exhibits no clear geographic structure.
Haplotype distribution, haplotype diversity (h), and nucleotide diversity (π) of the British population, based on 433-bp mtDNA sequences generated in this study

Table 4 Long description
The table reports counts of six mitochondrial haplotypes (A to F) by UK region, plus haplotype diversity and nucleotide diversity with their variances, based on 433 base pair sequences. Overall (60 samples), haplotype C is most common with 39, followed by A with 14; B, E, and F are rare (1, 2, and 1), and D occurs 3 times. In the East (25 samples), C accounts for 18 and diversity is 0.48, with nucleotide diversity about 0.00263. In the West (28 samples), haplotypes are more evenly spread (A 10, C 15, plus single counts of D, E, and F), giving the highest haplotype diversity at 0.60 and nucleotide diversity about 0.00224. The South (7 samples) is least diverse, with only A 1 and C 6, haplotype diversity 0.29, and nucleotide diversity about 0.00066. Variances are provided for both diversity measures, and the small southern sample size may limit how confidently its lower diversity can be generalized.
Analysis of molecular variance (AMOVA) based on 433-bp mitochondrial DNA sequences from three geographic regions in British waters

Table 5 Long description
The table reports an analysis of molecular variance for 433 base pair mitochondrial DNA sequences grouped into three geographic regions in British waters. Variation is partitioned into differences among regions and differences within regions. Most variation is within regions, accounting for 96.87 percent, with a sum of squares of 27.17 and a variance component of 0.48. Variation among regions is small at 3.13 percent, with a sum of squares of 1.51 and a variance component of 0.02. Overall totals are 28.68 for sum of squares and 0.49 for variance components, with no total percentage listed. These results indicate weak regional differentiation relative to within-region diversity, but the table does not provide significance testing or confidence intervals.
For the global haplotype distribution analysis, a 368 bp consensus mtDNA sequence from 275 individuals identified 82 unique haplotypes (Supplementary Information S3). The six British haplotypes (Haplotypes A–F) retained their identity after sequence truncation and were designated as Haplotypes LXXVII–LXXXII. All six were endemic to the British Isles. In the median-joining network analysis, these haplotypes formed a closely connected cluster at the periphery of the network, except for Haplotype LXXX (i.e., Haplotype D), which was five mutational steps away from the main British cluster, separated by haplotypes found in the Azores (Figure 4).
Median–joining haplotype network showing the relationships among 82 mtDNA haplotypes from global Risso's dolphin populations, based on 368 bp consensus sequences from this study and published literature. Each circle represents a unique haplotype, with its size proportional to the number of individuals sharing that haplotype. The colour shading indicates the proportion of each population represented within a haplotype. Hatch marks along the connecting lines represent the number of mutational steps separating haplotypes, while solid circles denote missing intermediate haplotypes. The six haplotypes found in British waters (Haplotypes A–F) correspond to Haplotypes LXXVII–LXXXII, respectively.

Figure 4 Long description
The diagram is a median-joining network illustrating haplotype relationships and distributions across various regions. Nodes are represented by circles of varying sizes and colors, each corresponding to a specific haplotype. The size of each circle indicates the frequency of the haplotype, while the color represents the geographic region, as indicated by the legend in the bottom right corner. The regions include Azores, British Isles and others, each assigned a distinct color. Lines connecting the nodes represent mutational steps between haplotypes. The network is complex, with multiple interconnected nodes forming clusters. Some nodes are isolated, while others are part of larger clusters, indicating varying degrees of genetic relatedness. The largest node, located in the upper left, is orange and labeled with multiple identifiers, indicating a high frequency of that haplotype in the Azores. Other notable clusters are spread throughout the network, with colors such as pink, blue and yellow, each corresponding to different regions. The diagram visually represents the genetic diversity and distribution of haplotypes across the studied regions.
The phylogenetic analysis further supported the findings from mtDNA haplotype variance apportionment. British haplotypes appeared randomly distributed with respect to their geographic origin and proportion. However, British samples formed a distinct clade that grouped within a subset of samples from the Azores (Supplementary Information S4).
Discussion
The lack of population genetic structure
With the inclusion of samples from additional stranded individuals, a wider sampling range, and higher resolution of genetic data (i.e., more microsatellite loci screened), our analysis confirms the absence of genetic structure in Risso’s dolphins in British waters, as previously suggested (Gaspari et al., Reference Gaspari, Airoldi and Hoelzel2007). The relatively low polymorphism observed across several loci may limit the resolution for detecting weak genetic differentiation, but we believe this pattern reflects the true genetic status of this population rather than a methodological constraint. Most loci used here were originally developed for bottlenose dolphins (Tursiops spp.), and only one locus (D22) has previously been validated for Risso’s dolphin (Chen et al., Reference Chen, Nishida, Chou, Tajima, Yang, Isobe, Yamada, Hartman and Hoelzel2018), where it was also found to be polymorphic. Consistent with our findings, Gaspari et al. (Reference Gaspari, Airoldi and Hoelzel2007) reported lower allelic richness in British waters than in the Mediterranean population for seven out of eight loci. Our study includes 11 polymorphic loci, which was more than the number screened by Gaspari et al. (Reference Gaspari, Airoldi and Hoelzel2007), supporting the view that the British Isles Risso’s dolphin population is likely characterised by genuinely low genetic diversity rather than by insufficient marker informativeness.
The lack of population genetic structure has also been reported in Risso’s dolphins sampled from an even more extended geographic region, i.e., between Japan and Taiwan (Chen et al., Reference Chen, Nishida, Chou, Tajima, Yang, Isobe, Yamada, Hartman and Hoelzel2018), and in the Mediterranean Sea (Gaspari et al., Reference Gaspari, Airoldi and Hoelzel2007), suggesting that a lack of genetic differentiation may be a general characteristic of this species. This could be attributed to the species’ extensive movement capabilities or large individual home ranges (Wells et al., Reference Wells, Manire, Byrd, Smith, Gannon, Fauquier and Mullin2009; Rone et al., Reference Rone, Sweeney, Falcone, Watwood and Schorr2022; Hodgins et al., Reference Hodgins, Steel, Dyke, Walters, Dolman, Hall, Neave-webb, Evans, Bird, Robinson, Marwood, Foubister, Harrop, Knight and Munro2024). Additionally, it may indicate an absence of mating preference based on genetic, social, or ecological traits, in contrast to species such as sperm whales (Physeter macrocephalus) and coastal common bottlenose dolphins (Tursiops truncatus) (Alexander et al., Reference Alexander, Steel, Hoekzema, Mesnick, Engelhaupt, Kerr and Baker2016; Louis et al., Reference Louis, Simon-Bouhet, Viricel, Lucas, Gally, Cherel and Guinet2018).
Yet, the lack of sufficient time to accumulate genetic variation among geographically isolated groups could also result in an insignificant genetic pattern. As the major part of the British Isles and its coastlines was covered by the British–Irish Ice Sheet during the Last Glacial Maximum, the dolphins could only access their current habitat after 16 ka BP, when ice sheets had sufficiently retreated (Clark et al., Reference Clark, Hughes, Greenwood, Jordan and Sejrup2012). Long generation time also affects a species’ molecular evolution rate (Ho et al., Reference Ho, Lanfear, Bromham, Phillips, Soubrier, Rodrigo and Cooper2011), and it appears to be applicable to most marine mammals, including Risso’s dolphins (sexually mature at 10 years, maximum longevity to 30–40 years; Hartman et al., Reference Hartman, Chen, Hodgins, Ames, van der Harst and Jefferson2025). The same rationale can be reasonably applied to explain the weak population structure found in other cetacean species inhabiting the same region, including the short-beaked common dolphins (Delphinus delphis) (Mirimin et al., Reference Mirimin, Westgate, Rogan, Rosel, Read, Coughlan and Cross2009), Atlantic white-sided dolphins (Lagenorhynchus acutus) (Gose et al., Reference Gose, Humble, Brownlow, Mikkelsen, Loftus, Wall, Rogan, ten Doeschate, Davison and Ogden2023) and harbour porpoises (Phocoena phocoena) (Fontaine et al., Reference Fontaine, Thatcher, Ray, Piry, Brownlow, Davison and Goodman2017). However, the genetic structure detected in coastal common bottlenose dolphins (Nykänen et al., Reference Nykänen, Louis, Dillane, Alfonsi, Berrow, O’brien and Gaggiotti2019) and harbour seals (Phoca vitulina) (Olsen et al., Reference Olsen, Islas, Graves, Onoufriou, Vincent, Brasseur and Hall2017) in British waters is likely a result of multiple waves of immigration from adjacent allopatrically differentiated populations. The monophyletic origin of Risso’s dolphins in British waters shown in this study suggests that the settlement to their current habitat was likely a one-off immigration/radiation event.
The uniqueness of this British lineage
Our findings, well aligned with Gaspari et al. (Reference Gaspari, Airoldi and Hoelzel2007), indicate that Risso’s dolphins in British waters descend from a unique lineage. Our data further indicate a close genetic affinity between British and Azores populations, implying a shared ancestry among Risso’s dolphins in the Northeast Atlantic Ocean. However, the endemic nature of all British haplotypes suggests incomplete lineage sorting within the species’ mtDNA phylogeny. It is noteworthy that Risso’s dolphins in British waters are distinct in their ecology as well. Risso’s dolphins are typically regarded as an oceanic species occupying waters along the continental shelf and slope, 200–1,000 m deep (Jefferson et al., Reference Jefferson, Weir, Anderson, Balance, Kenney and Kiszka2014; Hartman et al., Reference Hartman, Chen, Hodgins, Ames, van der Harst and Jefferson2025). In contrast, in British waters, Risso’s dolphins inhabit (if not reside in) much shallower (<20 m) and nearshore waters (Reid et al., Reference Reid, Evans and Northridge2003; de Boer et al., Reference de Boer, Clark, Leopold, Simmonds and Reijnders2013; Weir et al., Reference Weir, Hodgins, Dolman and Walters2019; Hodgins et al., Reference Hodgins, Steel, Dyke, Walters, Dolman, Hall, Neave-webb, Evans, Bird, Robinson, Marwood, Foubister, Harrop, Knight and Munro2024). The species is generally confined to tropical and temperate waters between 45° latitude north and south, but the warming influence from the Gulf Stream likely makes the British Isles (including the Northern Isles, ∼60°N) the world’s northernmost area where Risso’s dolphins can be consistently and regularly seen (Jefferson et al., Reference Jefferson, Weir, Anderson, Balance, Kenney and Kiszka2014; Weir et al., Reference Weir, Hodgins, Dolman and Walters2019; Hodgins et al., Reference Hodgins, Steel, Dyke, Walters, Dolman, Hall, Neave-webb, Evans, Bird, Robinson, Marwood, Foubister, Harrop, Knight and Munro2024). Risso’s dolphins are considered to be mostly teuthophageous with a mixed diet of squid and octopus (Luna et al., Reference Luna, Sánchez, Chicote and Gazo2022; Hartman et al., Reference Hartman, Chen, Hodgins, Ames, van der Harst and Jefferson2025); however, in British waters, by far the most important species in their diet is the octopus (Eledone cirrhosa) (Clarke and Pascoe, Reference Clarke and Pascoe1985; Reid et al., Reference Reid, Evans and Northridge2003; MacLeod et al., Reference MacLeod, Santos, Burns, Brownlow and Pierce2014).
This unique lineage exhibits lower genetic diversity compared to populations in the Mediterranean Sea, the Azores, or the North Pacific (Gaspari et al., Reference Gaspari, Airoldi and Hoelzel2007; Chen et al., Reference Chen, Nishida, Chou, Tajima, Yang, Isobe, Yamada, Hartman and Hoelzel2018; Hartman et al., Reference Hartman, Chen, Van Der Harst, Moura, Jahnke, Pilot, Vilela and Hoelzel2023). This may result from insufficient time for novel genotypes to emerge. Further genetic analyses are needed to assess the influence of evolutionary processes (e.g., genetic drift, founder effects, and natural selection) on genetic diversity and ecology. Although we are unable to establish a link between the ecological and evolutionary significance of these dolphins with the present dataset, these lines of ecological and genetic distinctiveness should sufficiently support the classification of the dolphins in British waters as an evolutionary significant unit (ESU; Moritz, Reference Moritz1994; Palsbøll et al., Reference Palsbøll, Berube and Allendorf2007).
Conservation considerations
When considering genetic data alone, based on our results, the data suggest that there is only one MU for British Risso’s dolphins. However, the fact that no significant genetic differences are found in a population sampled across a wide area such as the North Atlantic does not mean that there is no further behavioural/cultural sub-structuring within the population. From a management perspective, it may be prudent to split rather than lump MUs on the basis of partial evidence such as spatial gaps in range, or lack of interchange of individual animals where reasonable sample sizes exist (Evans and Teilmann, Reference Evans and Teilmann2009). The identification of dispersal patterns and isolated populations such as the British population, which is found at the edge of the species’ range, is a fundamental pre-requisite for developing effective conservation strategies (Gaspari et al., Reference Gaspari, Airoldi and Hoelzel2007). Such structure, if detected, might lead to conservation ramifications in terms of ‘management units’, defined as ‘demographically independent populations whose population dynamics depend largely on local birth and death rates rather than on immigration’ (Palsbøll et al., Reference Palsbøll, Berube and Allendorf2007). Combined with photo-identification data, genetic analysis can help to determine if this is an appropriate scale for management of pressures.
Risso’s dolphins in the Mediterranean have been recognised as a sub-population, currently assessed as Endangered (Lanfredi et al., Reference Lanfredi, Arcangeli, David, Holcer, Rosso and Natoli2021), based on long-term studies which indicate that Risso’s Dolphins in the Mediterranean are genetically differentiated from those in the eastern Atlantic and genetic characteristics of animals sampled were variable but suggestive of intra-basin structuring (Gaspari et al., Reference Gaspari, Airoldi and Hoelzel2007). In the Ligurian–Corso–Provençal basin, a core group of individuals exhibiting a degree of site fidelity is present during the summer months (Airoldi et al., Reference Airoldi, Bendinoni, Azzellini, Fadda, Profice, Evans and Ridoux2005). A high rate of site-based residency has been observed off the Isle of Lewis, Western Isles, suggesting site-preferential behaviour by at least one population of Risso’s dolphins (Weir et al., Reference Weir, Hodgins, Dolman and Walters2019). A wider geographical analysis involving two independent photo-identification catalogue-matching projects (Hill, Reference HillIn Press; Langford, Reference LangfordIn Press) found multiple matches of individuals between the south-west of England, Wales and the Isle of Man, but no matches were made to a catalogue from Scotland. A more recent analysis, specifically on Risso’s dolphins in Scottish waters, found less than 3% of matches between individuals photo-identified on the west and northern coasts (Hodgins, Reference Hodgins2025).
Current UK conservation policies categorise Risso’s dolphins under a single MU, despite habitat-specific threats across the coastline. Conservation measures are further complicated by the devolution of nature conservation policies, which results in regional decision-making without coordination at the national level. Additionally, Risso’s dolphins have relatively sensitive hearing (11–100 kHz) compared to other odontocetes (Mooney et al., Reference Mooney, Yamato and Branstetter2012, Reference Mooney, Yang, Yu, Ketten and Jen2015), making them more vulnerable to underwater noise pollution. As the dolphins in this region feed on octopus, their dependence on healthy seabed habitats is presumable. Yet, the impact of marine developments and fisheries in critical habitats remains unknown. Existing monitoring is insufficient for robust population assessments, threat evaluation, or impact mitigation, necessitating urgent research efforts.
Further steps
To determine whether this British population of Risso’s dolphins is truly endemic to the waters, further genetic sampling from adjacent regions with presumably similar habitat settings (i.e., Celtic Sea, south-western English Channel, and the Bay of Biscay; Reid et al., Reference Reid, Evans and Northridge2003; Jefferson et al., Reference Jefferson, Weir, Anderson, Balance, Kenney and Kiszka2014) is crucially needed. Advanced molecular techniques, such as restriction site-associated DNA sequencing or whole-genome sequencing, could provide higher-resolution insights into population structure, demography and gene flow. Comparative genomics and transcriptomics could also help assess potential evolutionary adaptations (Cammen et al., Reference Cammen, Andrews, Carroll, Foote, Humble, Khudyakov, Louis, McGowen, Olsen and Van Cise2016). The emerging environmental DNA (eDNA) monitoring technique can be implemented in various locations around the British Isles to further aid the monitoring of the species (Foote et al., Reference Foote, Thomsen, Sveegaard, Wahlberg, Kielgast, Kyhn, Salling, Galatius, Orlando, Thomas and Gilbert2012). For instance, the targeted collection of eDNA samples from strata within Southeast Alaska was key for elevating the statistical power of the Southeast Alaska harbour porpoise mtDNA dataset, with findings indicating limited dispersal between neighbouring strata within coastal and inland waters and providing evidence supporting a population boundary and site fidelity (Parsons et al., Reference Parsons, May, Gold, Dahlheim, Gabriele, Straley, Moran, Goetz, Zerbini, Park and Morin2025). Basic life history data on Risso’s dolphins are scant, and there is an urgent need for improved funding and resources to enable additional necropsies of stranded Risso’s in a suitable condition within northeast Atlantic stranding networks, or the collection of fresh samples through authorised remote biopsy sampling programs (Noren and Mocklin, Reference Noren and Mocklin2012).
Government decision-making processes across devolved administrations are not always effectively connected, and for conservation efforts to be successful, collaboration is required. A multidisciplinary study could investigate population structure and, as appropriate, further define MUs, based on available biological data to include morphology and acoustic data, in addition to genetics. Additionally, robust baseline surveillance monitoring is required throughout British waters to assess population size and trends. Localised surveys in known critical habitat, e.g., the North East Lewis MPA, should be continued to understand individual and group habitat preferences. Once relevant genetic autosomal analysis has been undertaken, if appropriate and sufficient evidence is gathered, a call for potential sub-population status to be recognised as such by the IUCN would be warranted, in line with recent changes to the status listing of the Mediterranean population of Risso’s dolphin.
Supplementary material
The supplementary material for this article can be found at https://doi.org/10.1017/S0025315426101386.
Acknowledgements
Samples were collected in Scotland under the aegis of the Scottish Marine Animal Strandings Scheme (SMASS), which is funded by the Scottish Government. Samples from England and Wales were collected under the aegis of the Cetacean Strandings Investigation Programme, which is co-funded by the Department for Environment, Food and Rural Affairs (DEFRA) and the Welsh Government. The authors are grateful to the veterinary pathologists and strandings responders who collected samples and data for both programmes. In particular, we thank James Barnett and the staff of the Veterinary Laboratories Agency (VLA) Polwhele (now the Animal and Plant Health Agency, APHA), as well as the volunteers of the Cornwall Wildlife Trust Marine Strandings Network.
Author contributions
Study design and manuscript writing: N.K.H. and M.K.; data analysis, interpretation, and manuscript writing: I.C.; lab work and data analysis: M.R.B. and V.K.; and field sample collection and contribution of insights: M.T.I.t.D., S.J.D., N.J.D., R.D., R.P., and K.H. All authors contributed to manuscript revisions. N.K.H. and I.C. contributed equally to this work.
Declaration of interest
The authors declare none.
Data availability statement
Sample information, sequence variation tables for UK regional mtDNA haplotypes (A–F) and global mtDNA haplotypes (I–LXXXII), and a Bayesian phylogenetic tree inferred by the mtDNA haplotypes are provided in the supplementary materials (Supplementary Information S1, S2, S3, and S4, respectively). The mtDNA sequences generated in this study are available in the GenBank repository under accession numbers PV877452–PV877511.
Ethics and approach
All tissue samples used for genetic analyses were obtained from individuals that were found dead stranded along the UK coast, or that live-stranded and subsequently died during the stranding event. Samples were collected by national stranding networks under appropriate national licenses: Natural England class licence CL01; NatureScot Licence number 187976; and Natural Resources Wales licence to possess and transport dead specimens and/or derivatives of wild plant and animal species listed on Annex IV and II(b) of the Habitats Directive for scientific or educational purposes. Laboratory analyses were conducted at the University of Zurich, and the international transfer of samples complied with all relevant regulations, including national and international permits issued under the Department for Environment, Food and Rural Affairs (DEFRA) and the Convention on International Trade in Endangered Species of Wild Fauna and Flora (CITES).
Funding statement
This work was supported by the Countryside Council for Wales and Natural Resources Wales (grant numbers FC 73-01-91, FC 73-02-193, FC 73-02-273) and NatureScot (Project #501058 for WDC); the National Science and Technology Council, Taiwan (I.C., grant numbers NSTC112-2621-B-003-003, 114-2621-B-003-006); and National Taiwan Normal University (I.C., grant number Higher Education Sprout Project #112000104); the Georges and Antoine Claraz-Schenkung (M.K.) and the University of Zurich.




 Open access

