





Impact statement
We introduce a novel method for monitoring human heart rate without requiring line-of-sight or wearable devices. By detecting and filtering for the vibrations caused by heartbeats in the participants’ surroundings, we can sense heart rate with an average accuracy within 10 bpm at a distance up to 2 m with minimal calibration data required for new users. This breakthrough can enable room-scale ubiquitous heart rate monitoring even for subjects who cannot or will not wear and maintain on-body devices otherwise required for such monitoring. Additionally, our framework for filtering and detecting semi-periodic low-signal-to-noise ratio (SNR) vibration signals can be applied more broadly for sensing other small signals such as vital signs and fine mechanical oscillations.
1. Introduction
Heart rate is one of the most common biomarkers for human health monitoring. This is especially true in home environments, where other, more comprehensive health monitoring is less available. Changes in heart rate serve as an early warning sign for a wide range of health abnormalities across all the human body’s systems. For example, the heart rate increases after illness or injury to supply energy and nutrients for recovery. Resting heart rate is particularly important for assessing individuals’ overall health and potential for cardiovascular disease (Fox et al., Reference Fox, Borer, Camm, Danchin, Ferrari, Lopez, Steg, Tardif, Tavazzi, Tendera and Null2007).
Conventional methods of heart rate monitoring commonly require direct contact with a person’s body. Direct body contact is problematic for many participants, however, due to the inconveniences or discomfort from worn devices and can sometimes lead to skin irritation or injuries (Farivar et al., Reference Farivar, Abouzahra and Ghasemaghaei2020). Additionally, the need to charge and maintain these devices can lead to inconsistent use and abandonment, especially in vulnerable populations whose health needs monitoring the most (Farivar et al., Reference Farivar, Abouzahra and Ghasemaghaei2020; Fuller et al., Reference Fuller, Colwell, Low, Orychock, Tobin, Simango, Buote, Heerden, Luan, Cullen, Slade and Taylor2020; Moore et al., Reference Moore, O’Shea, Kenny, Barton, Tedesco, Sica, Crowe, Alamäki, Condell, Nordström and Timmons2021). These drawbacks make such methods insufficient for truly ubiquitous heart rate monitoring.
To improve ubiquity, other methods sense heart rate indirectly, using computer vision or radio frequency (RF) sensing. These approaches use ancillary effects of heartbeats (e.g., body motion and blood flow) to sense them without contact. However, these approaches often require a well-calibrated room and/or specific postures of the participants while introducing privacy or spectrum usage challenges (Chen et al., Reference Chen, Cheng, Song, Liu, Ward and Wang2019; Zhang et al., Reference Zhang, Yang, Yue, Lim and Wang2023; Sharma et al., Reference Sharma, Mishra, Jha and Seneviratne2024).
Structural vibrations have shown promise for many types of human sensing tasks, including occupant localization, gait monitoring, heartbeat detection, and so on (Hu et al., Reference Hu, Sezgin, Lin, Zhang, Noh and Pan2019; Mirshekari et al., Reference Mirshekari, Fagert, Pan, Zhang and Noh2020; Codling et al., Reference Codling, Cohen, Kalivarapu, Noh and Zhang2022; Codling et al., Reference Codling, Shulkin, Dong, Zhang, Latapie, Noh and Zhang2023; Dong and Noh, Reference Dong and Noh2024). Like other indirect sensing modalities, the structural vibration approach uses ancillary effects of heartbeats (i.e., movement and sound) to detect them, avoiding the need for direct body contact with the sensor. The vibration modality is particularly advantageous for in-home sensing, as it avoids many of the line-of-sight and perceived privacy challenges of other indirect sensing methods. However, because of structures’ effects on heartbeat vibrations, such vibrations are challenging to sense and generally require sensors directly next to the participant, limiting scalability and thus ubiquity.
In this article, we present FloorPulse, a system for sensing heart rate indirectly through heartbeat-induced structural (e.g., chair and floor) vibrations. The main contributions of FloorPulse consist of:
-
• The first system to use floor vibrations for accurately monitoring human heart rate.
-
• A framework for sensor design to enable sensing of heartbeat vibrations and other low SNR vibration signals at a distance on the order of 2 m away.
-
• Our algorithmic framework for identifying heartbeat-induced vibrations based on periodicity and signal confidence.
FloorPulse’s key insight is that the human body generates a small wave of pressure and sound with each heartbeat. These waves propagate through the structure the person is in contact with (e.g., a chair) and then through the floor. FloorPulse detects and interprets the small floor vibrations to measure the heart rate. To address the extremely low amplitude of the heartbeat-induced floor vibrations compared to noise (i.e., low SNR), we present a highly sensitive vibration sensor system and heartbeat pattern modeling to identify these tiny vibrations among other body motions and ambient noise. Furthermore, we also present an estimation metric, named Signal Confidence, for the quality of heart rate extraction, allowing FloorPulse to detect occasional overwhelming noise or a lack of detectable heartbeats.
The rest of the article will be organized as follows: We will briefly discuss the conceptual underpinnings of heartbeat-induced structural vibrations in Section 2, before describing FloorPulse’s system design in Section 3. Section 4 will detail sensor design principles for room-scale heartbeat-induced vibration sensing, followed by FloorPulse’s vibration feature processing framework in Section 5. Next, we will evaluate FloorPulse in a real home environment in Section 6, with some further discussion and analysis in Section 7. Finally, we will summarize some related work in Section 8 before concluding with Section 9.
2. Physical insights of heartbeat-induced floor vibrations
FloorPulse relies on the vibrations produced by human heartbeats, similar to a ballistocardiogram (Sadek et al., Reference Sadek, Biswas and Abdulrazak2019) or seismocardiogram (Castiglioni et al., Reference Castiglioni, Faini, Parati and Di Rienzo2007; Ha et al., Reference Ha, Assana and Adib2020). These same vibrations are those heard as sounds by medical professionals during auscultation with a stethoscope (Castiglioni et al., Reference Castiglioni, Faini, Parati and Di Rienzo2007; Ismail et al., Reference Ismail, Siddiqi and Akram2018). However, unlike these past approaches, which rely on sensors directly contacting the participant’s body, FloorPulse detects these vibrations indirectly as they propagate through the chair and floor in order to detect the participant’s heart rate.
Each time the heart beats, a pulse of pressure propagates through the body, accompanied by vibration (i.e., the “heart sounds”) from the motion of cardiac valves and muscle. The pressure and vibrations then travel through the body and press on any surface or structure the person is touching. Previous works have shown that these vibrations can be detected in the immediately adjacent structures (e.g., seat and bed) to monitor the participant’s vital signs (Codling et al., Reference Codling, Cohen, Kalivarapu, Noh and Zhang2022; Codling et al., Reference Codling, Shulkin, Dong, Zhang, Latapie, Noh and Zhang2023; Dong et al., Reference Dong, Codling, Rohrer, Miles, Sharma, Brown-Brandl, Zhang and Noh2023).
FloorPulse’s particular case concerns seated participants in home environments. As shown in Figure 1, the vibration within the body transfers to the chair through the lower body, then propagates through the chair and into the floor, changing with distance and each transition between structures. The distance and heterogeneous structures between the person and sensor introduce unique challenges not present in existing heart rate monitoring approaches.
Vibration signal propagation path, showing how the signal travels from the heart, through the chair, and then is dispersed through the floor. An example pulse signal is plotted at each of four potential sensing locations: near the heart, on the chair seat, on the floor adjacent to the chair, and a distance away on the floor. The signal is degraded and attenuated more as the pulse gets farther from the heart.
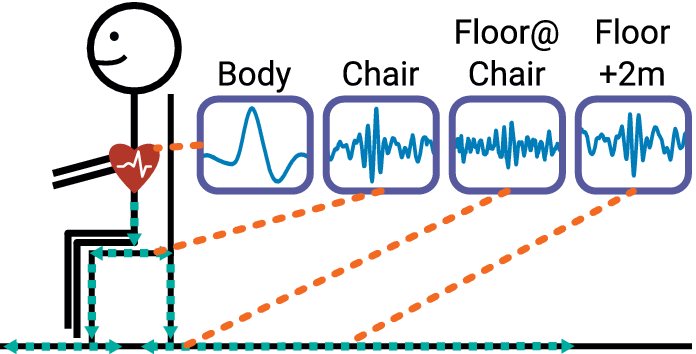
Figure 1. Long description
A stick figure sits on a chair with a red heart icon on the chest. A teal dashed line indicates the signal path moving down the torso, through the chair seat and legs, and then outward along the floor. Four line graphs in purple boxes show the signal at different points.
* The first graph, labeled Body, shows a clean, high-amplitude pulse wave originating from the heart.
* The second graph, labeled Chair, shows a signal with increased high-frequency noise and reduced amplitude.
* The third graph, labeled Floor at Chair, shows further degradation with a lower signal-to-noise ratio.
* The fourth graph, labeled Floor plus 2 m, shows the most attenuated signal with significant dispersion and low amplitude.
Orange dashed lines connect the heart, chair seat, floor base, and a distant floor point to their respective signal plots.
While heartbeats do produce structural vibrations, these vibrations are difficult to detect, especially in a home environment with a mixture of ambient noises. There are many other sources of vibration present in homes, including nearby appliances, HVAC systems, and even other people. Most of these other vibrations are significantly stronger than those from heartbeats, so they often drown out the heartbeat signal. Additionally, the small amplitude of heartbeat vibrations (and subsequent low SNR) makes it difficult to differentiate between heartbeats and other sources of small impulsive noise—e.g., smartphone taps or distant footsteps. Finally, the heterogeneous nature of physical structures makes modeling heartbeat vibrations at the sensor generally infeasible, as they distort the signals while propagating through the structures.
The challenge of low SNR encompasses both heartbeat characteristics and structural effects. Once in the chair or floor structure, heartbeat vibrations are so small as to be generally imperceptible by human touch. Farther from the participant, the amplitude decreases even further: on flat surfaces, such as the chair seat or floor, the heartbeat vibration amplitude decreases roughly with the square of the distance—that is, quadratic loss. For the human body or chair legs, where the vibration is contained and guided, the decrease is approximately linear. As the amplitude decreases further, the other challenges of detecting and identifying heartbeats are exacerbated further.
Heartbeat vibrations are difficult to model because of the variation in both people and structures. Within the body, the vibrations from heartbeats are well studied (Ismail et al., Reference Ismail, Siddiqi and Akram2018), but still vary significantly between people. Additionally, typical chair and floor materials, such as wood, plastics, and concrete, are all heterogeneous and dispersive media (Mirshekari et al., Reference Mirshekari, Pan, Zhang, Noh and Lynch2016). This means that heartbeat vibrations become corrupted as they propagate through the floor, and do so inconsistently at different locations.
In order to detect heart rate from floor vibrations in home environments with different people at varying distances, we define the following goals for FloorPulse:
-
1. Detect heartbeat-induced floor vibrations despite low SNR, addressed in Section 4, and structural effects, addressed in Section 3.2.
-
2. Identify periodic heartbeat patterns to reduce interference from similar impulsive vibrations, addressed in Section 5.1.
-
3. Evaluate heartbeat measurement to know when heart rate can be accurately detected, addressed in Section 5.2.
3. FloorPulse system overview
FloorPulse is the first system capable of measuring heart rate from indirect floor vibrations. As seen in Figure 2, our system includes a low-noise sensing front-end, intermediary filtering, and finally processing vibration-specific features to extract the heart rate and estimate sensing quality. The primary contributions delineated in Figure 2 will be addressed in more depth in Sections 4 and 5. This section, on the other hand, will outline the system as a whole and detail the filtering approach employed between the sensing front-end and estimation back-end.
Overall system diagram from signal capture by hardware to heart rate, inter-beat interval calculation, and signal confidence estimation. Details on the methodology behind the “Heartbeat Vibration Hardware” can be found in Section 4, while information on the “Vibration Feature Processing” modules can be found in Section 5. The intermediary filter stages will be detailed in Sections 3.1 and 3.3.
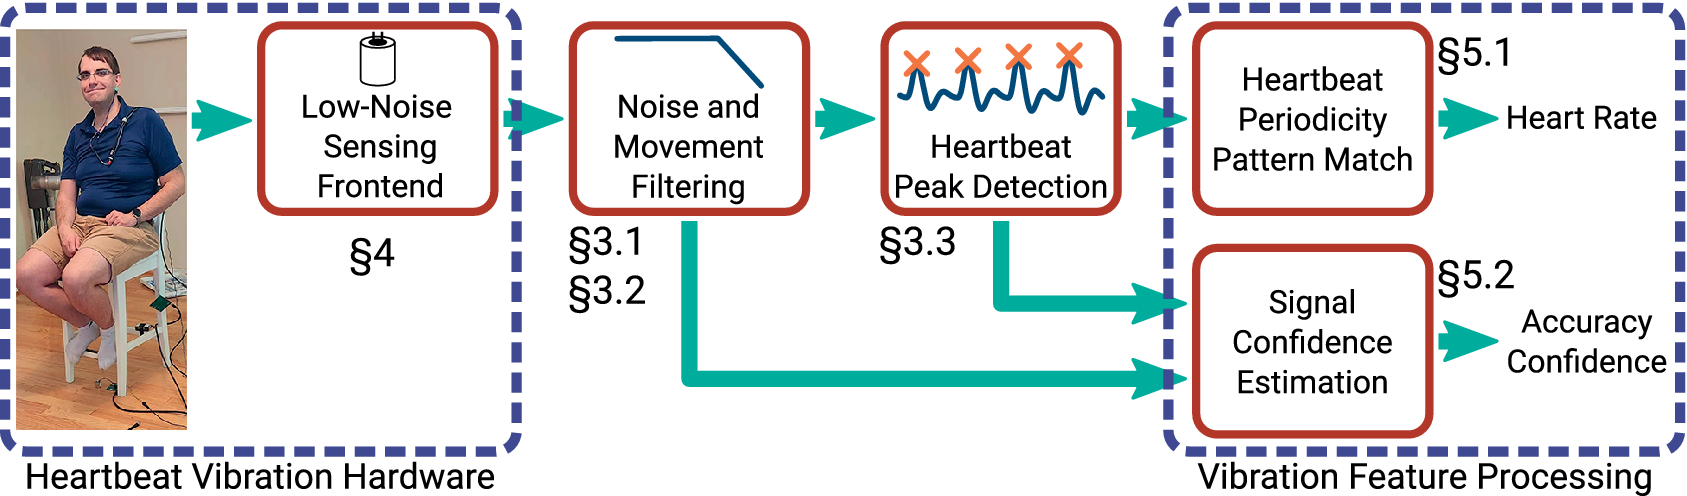
Figure 2. Long description
The flowchart begins on the left with a photo of a person sitting on a chair equipped with sensors, labeled Heartbeat Vibration Hardware. This section includes a box for Low-Noise Sensing Frontend marked with section symbol 4. An arrow points right to Noise and Movement Filtering, marked with section symbols 3.1 and 3.2, which shows a low-pass filter icon. From here, the main path continues right to Heartbeat Peak Detection, marked with section symbol 3.3, showing a waveform with orange X marks on peaks. A secondary path from the filtering stage and a path from the peak detection stage both feed into the final section on the right, labeled Vibration Feature Processing. This final section contains two stacked boxes. The top box is Heartbeat Periodicity Pattern Match, marked with section symbol 5.1, which outputs Heart Rate. The bottom box is Signal Confidence Estimation, marked with section symbol 5.2, which outputs Accuracy Confidence.
FloorPulse uses geophones as its core sensing element, similar to previous work with structural vibrations (Codling et al., Reference Codling, Bonde, Dong, Cao, Sangpetch, Sangpetch, Noh and Zhang2021; Dong et al., Reference Dong, Codling, Rohrer, Miles, Sharma, Brown-Brandl, Zhang and Noh2023). The geophones convert the vertical velocity of the surface they are mounted on, in this case the chair seat or floor, into an electrical voltage. Our meter-scale vibration sensing front-end, detailed in Section 4, amplifies and digitizes this voltage to allow for a sensing range on the order of 2 m. The increased noise resilience and adjustable amplification provided by this sensing hardware enable detecting heartbeat-induced vibrations, which previously would have been hidden by ambient noise. The later signal processing stages, described later in this section, further address this challenge by emphasizing and detecting vibrations similar to those induced by heartbeats.
Some types of vibration noise will still disrupt the heartbeat peak detection, so we handle these via the vibration feature processing techniques described in Section 5. For example, many other person motions, such as touchscreen taps or distant footsteps, induce lower-energy impulsive vibrations, which present a similar structural vibration response to heartbeats. However, because heartbeats are semi-periodic, such motion events will be out-of-sync with the pattern of heartbeat events. Therefore, we identify the heart rate by finding a best-fitting pattern of periodic peaks as detailed in Section 5.1, ignoring many such external vibration events. Background noise from body movement and mechanical vibration also sometimes drowns out the heartbeat signal. To avoid reporting inaccurate heart rates during such times, we use time and frequency features from the vibration signal and heartbeat-like peak detection to estimate the heartbeat detection accuracy. We use this estimate to determine when accurate heart rate detection is feasible, allowing FloorPulse to ignore periods of time when ambient noise inhibits heartbeat detection.
3.1. Noise and movement filtering
Once FloorPulse has measured the floor’s motion induced by heartbeats, we use a series of software filters to emphasize heartbeat-like vibrations in the collected data, similar to established heartbeat detection methods (Pan and Tompkins, Reference Pan and Tompkins1985). Figure 3 shows the results of each of these stages on some of our collected heartbeat vibration data. This first plot shows the raw vibration as recorded from the sensing front-end, followed by a low-pass filter at 400 Hz to remove excess high-frequency electrical noise that was observed in the raw signal’s spectrogram. We then apply a wavelet transform, correlating the vibration signal with a series of wavelet “templates,” which emphasize heartbeat-like impulsive signals spread out by structural dispersion. We discuss the wavelet filter in more detail in Section 3.2.
Vibration data collected by FloorPulse as it is processed by the conventional signal processing stages. The shaded regions indicate the approximate location of a detected heartbeat in the data.
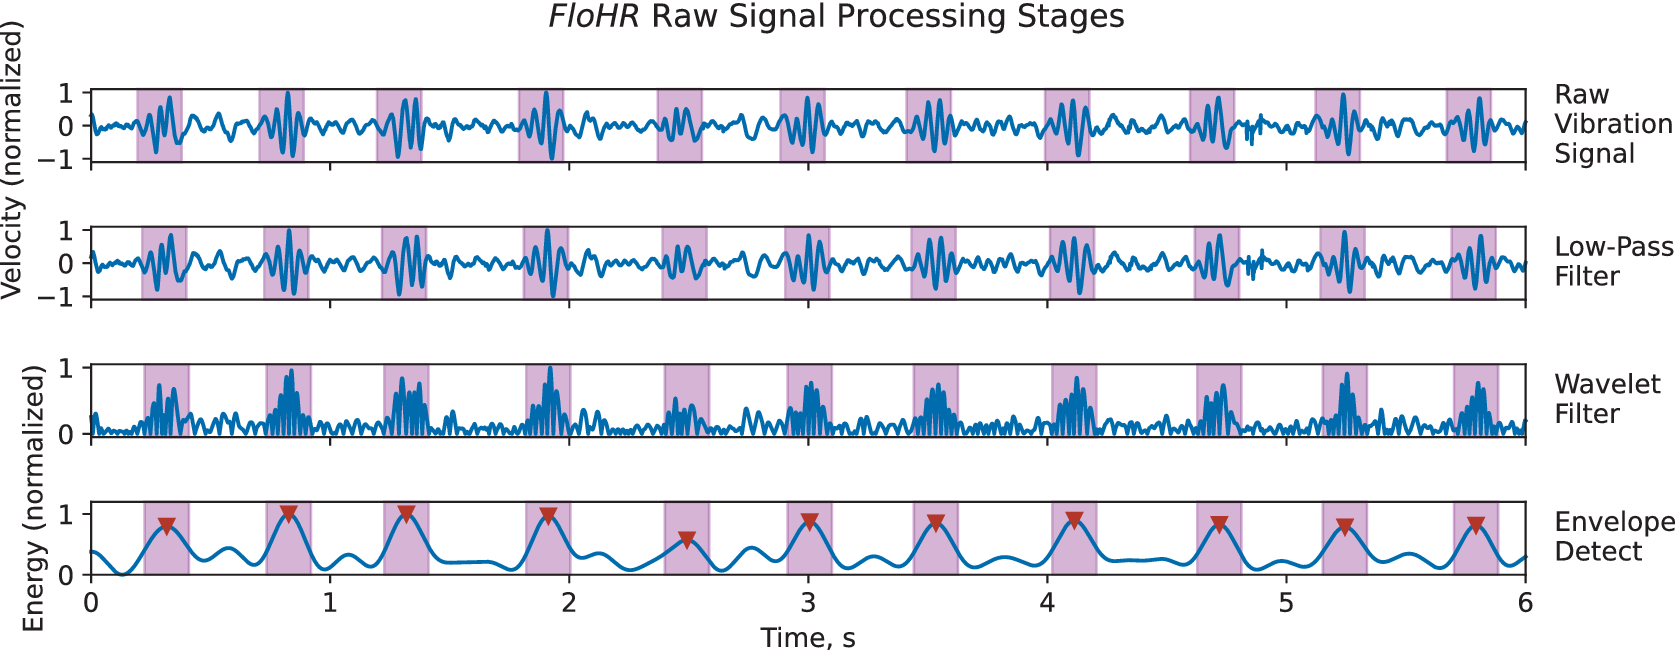
Figure 3. Long description
The graph consists of four vertically stacked panels sharing a common x-axis labeled Time, s, ranging from 0 to 6.
1. The top panel, Raw Vibration Signal, shows a fluctuating blue waveform on a y-axis of Velocity normalized from -1 to 1. Ten purple shaded regions highlight periodic high-amplitude bursts.
2. The second panel, Low-Pass Filter, shows a smoothed version of the raw signal with high-frequency noise reduced, maintaining the same y-axis and shaded regions.
3. The third panel, Wavelet Filter, shows the signal rectified to positive values only, with a y-axis from 0 to 1. The periodic bursts within the shaded regions appear as distinct, dense clusters of peaks.
4. The bottom panel, Envelope Detect, shows a smooth blue curve representing the signal energy on a y-axis of Energy normalized from 0 to 1. Red downward-pointing triangles mark the peak of each curve within the ten purple shaded regions, indicating successful heartbeat detection at approximately 0.4, 0.8, 1.3, 1.9, 2.5, 3.0, 3.5, 4.1, 4.7, 5.2, and 5.8 seconds.
Since heartbeat vibrations vary so much between individuals and locations, the wavelet filter is insufficient on its own to prepare the vibration signal for peak detection. This can be seen in the third plot of Figure 3 as each heartbeat “peak” is composed of a series of signal ripples. In order to merge these ripples back into a single peak (similar to the in-body pulse shown in Figure 1), we apply an envelope detector to the wavelet-filtered signal. The envelope detector’s final low-pass stage is tuned to 300 bpm—1.5 times the conventional maximum adult heart rate of 200 bpm (Association For The Advancement Of Medical Instrumentation, 2022), allowing for particularly vigorous heart rates. The resulting signal is shown in the last plot of Figure 3.
3.2. Wavelet filtering for heartbeat vibrations in dispersive structures
The floor and chair structures in which FloorPulse senses heartbeats are both heterogeneous and dispersive, which corrupts the heartbeat signal as it propagates from person to sensor. The heterogeneity means that signal attenuation, already a challenging issue due to the small SNR, is additionally dependent on structural parameters and the location of person and sensor on the structure (Mirshekari et al., Reference Mirshekari, Pan, Fagert, Schooler, Zhang and Noh2018). Such attenuation is frequency-selective, as the structure vibrates more or less readily at some frequencies depending on the composition and arrangement of structural materials. Meanwhile, dispersion spreads the heartbeat pulses in time as different frequency components travel at different propagation velocities (Mirshekari et al., Reference Mirshekari, Pan, Fagert, Schooler, Zhang and Noh2018). To emphasize structural heartbeat vibrations, we need to reduce the impact of these two effects and filter out other sources of vibration.
Our basic solution for emphasizing heartbeat-induced vibrations is to create a filter based on the response of the floor and chair structures to heartbeat stimulus. In our testing environment, detailed in Section 6, we found that the vibration response was concentrated in the 7–54 Hz range, starting near the resonant frequency of the floor. With that characterization, we applied a simple band-pass filter to reduce the amplitude of vibrations from other sources. However, this filter fails to account for the dispersion effect since it ignores the phase changes of different frequencies. This leads to decreased filter specificity, and the result is shown in Figure 4, where the simple band-pass filter yields a median heart rate error above 60 bpm. Since a typical adult’s resting heart rate is in the range of 50–100 bpm (Spodick, Reference Spodick1992), such inaccuracy would yield a largely useless monitoring system.
A box plot comparing heartbeat vibration filtering methods at three vibration sensor locations. The naive band-pass filter shows inconsistent and degraded heart rate accuracy compared to the wavelet filter bank, despite both spanning the same frequency range.
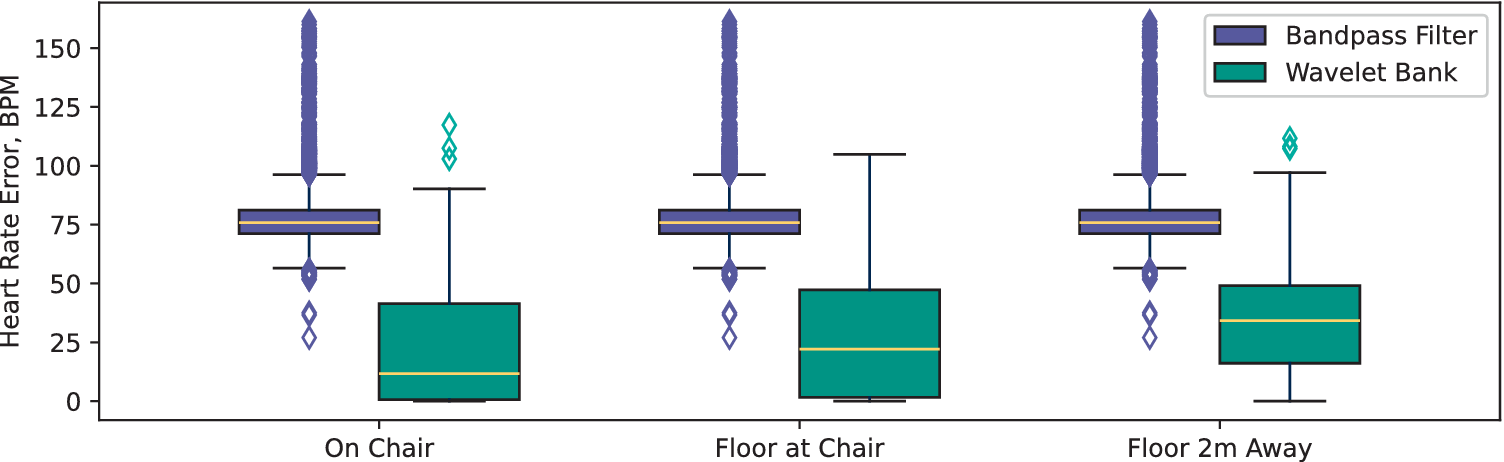
Figure 4. Long description
The y-axis is labeled Heart Rate Error, B P M, ranging from 0 to 150. The x-axis lists three locations: On Chair, Floor at Chair, and Floor 2m Away. A legend in the top right identifies purple boxes as Bandpass Filter and teal boxes as Wavelet Bank.
* At the On Chair location, the Bandpass Filter has a narrow interquartile range centered around 75 B P M with a dense vertical line of outliers extending to 150. The Wavelet Bank shows a much lower median near 12 B P M with a wider box and fewer outliers.
* At the Floor at Chair location, the Bandpass Filter remains consistent with a median near 75 B P M and high outlier density. The Wavelet Bank median rises slightly to approximately 22 B P M.
* At the Floor 2m Away location, the Bandpass Filter maintains its 75 B P M median and high outlier profile. The Wavelet Bank median increases to roughly 35 B P M, showing a larger spread but remaining significantly lower in error than the Bandpass Filter.
While a matched filter would be ideal for emphasizing small signals like heartbeats (Xue et al., Reference Xue, Hu and Tompkins1992), creating one is impractical due to the complex variations from both the person and structural properties. Within the body, the frequency content of pulses is determined by biological factors such as the size and stiffness of various heart structures. Once in the surrounding structure, this varied signal is then convolved with the structure’s attenuation function, which itself depends on material composition, stiffness, and arrangement. Creating matched filters for heartbeat vibration detection would thus require detailed characterization in order to create a “template” for each person’s heartbeats at each sensor location.
Many heartbeat-sensing algorithms use wavelets as a general template for detecting heartbeat signals, which are resilient to dispersion because of each wavelet’s narrow bandwidth. In particular, most algorithms use the Ricker or Mexican Hat wavelet (Smaoui et al., Reference Smaoui, Young and Abid2017) for its similarity to the QRS complex found in electrocardiogram (ECG) signals (Pan and Tompkins, Reference Pan and Tompkins1985; Sörnmo and Laguna, Reference Sörnmo and Laguna2006). However, the oscillatory signal we measure in floor vibration, shown in Figure 3, suggests the need for a wavelet which encompasses both the initial heartbeat pulse from the body and the elastic rebound of the chair and floor material. In order to include both while preserving the desirable frequency-domain features of the Ricker wavelet (Smaoui et al., Reference Smaoui, Young and Abid2017), we use the integral of the Ricker wavelet, which is a first-order Gaussian derivative wavelet. This choice converts the wavelet filter from a simple denoising technique to a simplified model of the heartbeat vibrations as they are present in the chair and floor structures.
To allow for variation between individual people, FloorPulse combines a bank of wavelet filters instead of using a single wavelet scale. While this wavelet filter bank still requires some characterization of the chair and floor structure, this wavelet approach reduces the calibration requirements since just a few seconds of vibration data paired with ground truth are needed to determine the frequency range of the structure’s response to heartbeat vibrations. This structural characterization determines the range of frequencies the structure will respond with, whereas the frequency variations between individuals determine which frequencies within that band are excited by the subject’s heartbeat signal. By applying multiple narrowband wavelet filters, we both resist dispersion effects and account for the varied attenuation by allowing for frequency differences between individuals. We sum the responses to each of these filters to generalize the heartbeat vibration model across different subjects before continuing with our processing and heart rate detection algorithms.
Our final wavelet filter bank spans the frequency range determined by structural characterization. We use 10 wavelets linearly spaced in scale to cover the 7–54 Hz range in which our testing room (see Section 6.1) responded most strongly to heartbeat vibrations. Compared with the band-pass filter in Figure 4, we see a significant improvement in median heart rate error when using this wavelet filtering approach. We attribute this improvement to the decreased dispersion sensitivity and attenuation specificity provided by the wavelet filter bank.
3.3. Heartbeat-like peak detection
After filtering to emphasize heartbeat-like vibrations as described above, FloorPulse uses a conventional peak-detection algorithm to identify heartbeat-like events. Since many types of strong impulsive vibrations are present in home environments (e.g., footsteps, doors closing, and dropped objects), we rely on the small amplitude of heartbeat-induced vibrations to separate them. We reject any heartbeat-like events over a heuristically determined threshold to avoid incorrectly treating such movements as heartbeats. A minimum peak amplitude threshold also applies, so that false heartbeats are not reported in an empty or excessively noisy room.
4. Heartbeat-induced vibration sensing hardware
FloorPulse uses a geophone-based sensor to collect the vertical movement of floor and chair structures, including vibrations caused by heartbeats. This comes with the advantages utilized by previous works (Mirshekari et al., Reference Mirshekari, Fagert, Pan, Zhang and Noh2020; Dong et al., Reference Dong, Wu, Codling, Aggarwal, Huang, Ding, Latapie, Zhang and Noh2023), including perceived privacy and high sensitivity to body motion. However, targeting heartbeats introduces new challenges due to the extremely low SNR.
Similar geophone-based systems to FloorPulse have been used previously for footsteps and activity detection, but require an expanded dynamic range to detect heartbeats. While existing hardware interfaces were capable of detecting footsteps and other gross motor movements (Mirshekari et al., Reference Mirshekari, Fagert, Pan, Zhang and Noh2020; Bonde et al., Reference Bonde, Codling, Naruethep, Dong, Siripaktanakon, Ariyadech, Sangpetch, Sangpetch, Pan, Noh and Zhang2021; Dong et al., Reference Dong, Wu, Codling, Aggarwal, Huang, Ding, Latapie, Zhang and Noh2023; Dong and Noh, Reference Dong and Noh2024), they cannot detect extremely small vibrations (e.g., heartbeats) due to limited dynamic range. To expand dynamic range, we equipped FloorPulse’s sensing front-end with an op-amp and digital potentiometer (shown in Figure 5 under “Gain Control”) to widen the range of detectable floor velocities. This allows the signal gain to be adjusted on-the-fly for different sensing tasks, effectively expanding dynamic range and thus enabling both footsteps and heartbeats to be detected with the same hardware. For evaluating FloorPulse, we set each sensor’s gain based on preliminary data collection to maximize heartbeat amplitude with minimal clipping.
Part of the PCB design for FloorPulse’s low-noise sensing front-end. The visible critical design principles are circled and labeled thus: “Ground Shielding” for via stitching around the signal path, “Noise Separation” for the separated ground planes to reduce onboard noise, and “Gain Control” for a digital potentiometer, which expands dynamic range by enabling dynamic gain.
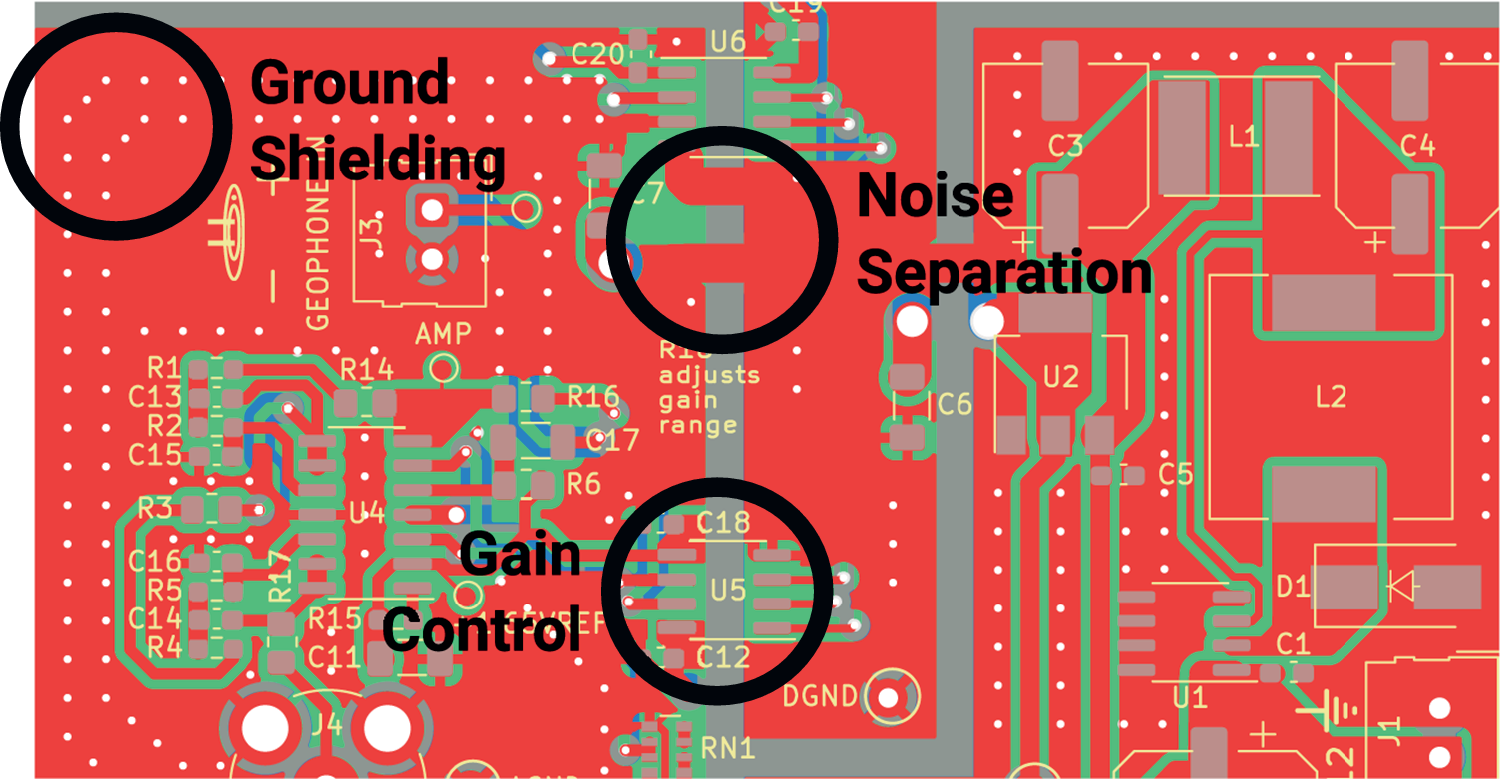
Figure 5. Long description
A technical P C B layout diagram rendered in red, green, and grey. Three specific design principles are highlighted with black circles and text labels.
* Top-Left: The label Ground Shielding points to a dense array of white via stitching dots arranged in a curved pattern around the perimeter of a signal path to provide electromagnetic protection.
* Center-Top: The label Noise Separation points to a vertical grey gap that physically divides the red ground planes, preventing electrical noise from crossing between different circuit sections. Nearby components include U 6, C 20, and C 7.
* Center-Bottom: The label Gain Control points to an integrated circuit labeled U 5, surrounded by capacitors C 18 and C 12. This digital potentiometer is positioned near text that reads R 10 adjusts gain range, indicating its role in dynamic signal amplification.
Other visible components include a dense cluster of resistors and capacitors on the left labeled R 1 through R 5 and C 11 through C 17, and a power or output section on the right featuring larger components labeled L 1, L 2, and U 2.
Electrical noise within the sensor hardware is a newly salient design concern when detecting small vibrations such as heartbeats. With stronger vibrations (e.g., from footsteps, which previous systems targeted [Mirshekari et al., Reference Mirshekari, Fagert, Pan, Zhang and Noh2020]), the vibrations are sufficiently strong to be detected above on-board noise from power supply and communication circuitry. Heartbeats, however, are not, necessitating design steps to reduce such noise. One key design choice was separating the power supply and communication components, both of which produce significant high-frequency interference, from the analog signal processing hardware. Figure 5 highlights this as “Noise Separation,” showing the carefully separated grounding planes to prevent crosstalk between analog and digital circuits.
Careful component choice plays an additional role in reducing on-board electrical noise. Digital and power conditioning components generally operate in a higher frequency range than structural vibrations, up to and including the RF domain. By carefully choosing these components, we create frequency separation between their operating noise and the vibration signals being sensed. Since the geophone’s reliability drops off around 240 Hz (Mirshekari et al., Reference Mirshekari, Fagert, Pan, Zhang and Noh2020), we ensure on-board devices remain above 2 kHz, maintaining a factor of 10 separation. This makes such noise easy to filter out in both the hardware and filtering pipeline.
To operate in a home environment, the sensors must also cope with numerous sources of ambient noise, both electrical and vibrational. Since vibration noise is digitized by the sensors alongside the heartbeat signal, most effort to account for it is performed by the digital filtering described in Sections 3.1, 3.3, 5.1, and 5.2.
For ambient electrical noise (e.g., from Wi-Fi, radio, cell phones, and unshielded appliances), the PCB design in Figure 5 uses the grounding planes to shield the critical signal path as much as possible. As part of this, as highlighted in Figure 5, these protected signal traces are surrounded by small conductor-plated holes connected to the ground planes—ground “vias” in electronics parlance. This “via-stitching” technique surrounds the sensitive signal wires with shielding similarly to a coaxial cable, thus absorbing much of the ambient electromagnetic interference (EMI).
Our resulting hardware design reveals principles for designing extremely sensitive sensing systems operating in noisy environments. To ensure optimal performance, the sensor hardware must deflect as much external electrical noise as possible while keeping onboard noise sources in check as well. Digital and power circuitry should be isolated from noise-sensitive analog components, where possible, and operate well outside the core transducer’s frequency band—~10 –240 Hz for our geophones (Mirshekari et al., Reference Mirshekari, Fagert, Pan, Zhang and Noh2020). Dynamic range can be expanded with on-the-fly adjustable amplification to allow differing magnitudes of input to be accepted.
Figure 6 shows a comparison of vibration data collected in an empty room with existing geophone interface hardware (above) and FloorPulse’s low-noise sensing front-end (below). An image of the realized sensing front-end PCB is also shown in the bottom-right of Figure 9. By implementing the sensor design principles in this section, we achieved an over 6 dB decrease in noise figure, more than quartering the effect of ambient noise. This noise reduction allows our new sensing platform to detect heartbeats that were previously below the noise floor and thus usually undetectable.
Vibration data collected by an existing geophone interface (Mirshekari et al., Reference Mirshekari, Fagert, Pan, Zhang and Noh2020 ) and FloorPulse’s updated sensor boards, respectively, with a comparison between their base noise levels. The newer board decreased uncertainty in the vibration signal by over 6 dB, including having filtered out the high-frequency spike near the 0.25 s mark.
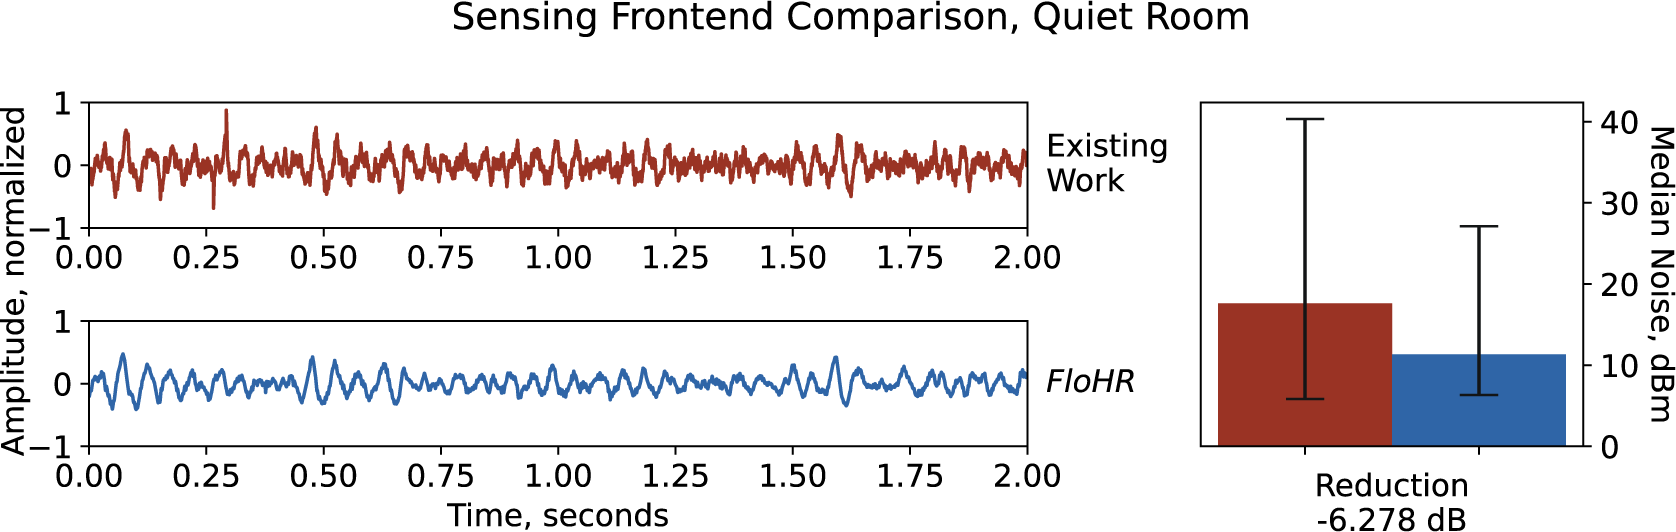
Figure 6. Long description
The figure is titled Sensing Frontend Comparison, Quiet Room.
On the left, two stacked line graphs share a common x-axis labeled Time, seconds, ranging from 0.00 to 2.00, and a y-axis labeled Amplitude, normalized, ranging from -1 to 1.
* The top graph, labeled Existing Work, shows a light red vibration signal with high-frequency jitter and a prominent downward spike near the 0.25 second mark.
* The bottom graph, labeled FloHR, shows a dark blue vibration signal that is visibly smoother and lacks the high-frequency spikes seen in the top graph.
On the right is a bar chart with a y-axis on the right side labeled Median Noise, d B m, ranging from 0 to 40.
* A light red bar representing Existing Work reaches approximately 18 d B m with a large error bar extending from roughly 5 to 40 d B m.
* A dark blue bar representing FloHR reaches approximately 12 d B m with a smaller error bar extending from roughly 6 to 28 d B m.
* Below these bars, text indicates a Reduction of -6.278 d B.
5. Heart rate and accuracy estimation by vibration signal features
Even with robust hardware and signal filtering, vibration-based heart rate monitoring is still error-prone due to environmental noise and human uncertainty. To address these potential sources of error, we broadly classify the noise that cannot be filtered out or handled by FloorPulse’s hardware or pre-filtering stages into two categories of noise:
-
• “Short-term noise” occurs within a similar time frame as a single heartbeat—that is, less than 1 s. This includes impulsive noise, such as footsteps, dropped objects, doors closing, or touchscreen taps.
-
• “Long-term noise” occurs over at least 2 s. This includes body movements (e.g., fidgeting and speaking) and mechanical vibration.
Short-term noise events produce vibrations similar in frequency content to heartbeats, which leads to false positives when detecting heartbeats. Long-term noise affects the vibration signal more broadly, changing the noise floor (i.e., minimum detectable signal) and often masking true heartbeats. Thus, long-term noise can lead to both false positives (when the noise floor is similar in amplitude to heartbeats) and false negatives (heartbeats are missed because they are drowned out by noise). To reliably detect heart rate from structural vibrations, FloorPulse must handle both of these noise types.
This section will outline FloorPulse’s vibration feature processing algorithms for handling both short- and long-term noise. Both algorithms analyze vibration data in 18-s sliding windows, determined by a combination of maximal heart rate and heart rate change over time, as described below in Section 5.1. The sliding windows overlap by ~70% (i.e., about 5 s between windows), so that each detected heartbeat is contained in three separate windows. FloorPulse segments vibration data with its detected heartbeat events into these sliding windows, including several heartbeats within each window. Within these windows, we run two algorithms to handle each type of noise:
-
• Heartbeat periodicity pattern matching: FloorPulse treats the heart rate as constant within the sliding window and finds a best-fitting pattern of perfectly periodic heartbeats that best matches the detected heartbeat peaks, reducing interference from both missed beats and false positives.
-
• Signal confidence estimation: FloorPulse evaluates the vibration data in each sliding window to estimate the accuracy of heartbeat detection.
The periodicity pattern matching algorithm primarily addresses short-term noise. For the confidence estimation, we use those estimates to accept or reject each window’s heart rate estimate, reporting only reliable heart rate measurements.
5.1. Heartbeat periodicity pattern matching
Since short-term noise appears similar to heartbeats in the vibration signal, this creates false positives, which skew heart rate estimates based on peak counts or naive inter-beat interval (IBI). Fortunately, however, heart rate stems from a semi-periodic signal. Thus, while short-term vibrations, such as phone taps and key presses, are similar to heartbeats in amplitude and frequency content, they occur out-of-sync with heartbeats. If the heart rate were known ahead of time, we could trivially differentiate heartbeats from these other vibrations by finding the events occurring at that frequency. However, since FloorPulse must detect the heart rate while also separating false-positive heartbeats, we instead use an optimization algorithm to find a best-fitting pattern of heartbeats given a fixed rate over a short time. The 18 s sliding window sets the time horizon over which FloorPulse treats heart rate as constant.
Because of biological factors, the IBI between real heartbeats is never exactly constant; thus, the beats are not perfectly periodic. Fortunately, heart rate does change relatively slowly, making it semi-periodic, particularly within a short time window. In order to accommodate the heart rate changing, which maxes out around 1 bpm/s (Baraldi et al., Reference Baraldi, Cooper, Zanconato and Armon1991), we allow a timing tolerance for each beat in the periodic pattern. Figure 7 visualizes the detected beats (marked with triangles) matching against the patterned heartbeats within the preset tolerance (plotted as shaded regions where each pattern beat occurs). The tolerance we set is based on the minimum time between heartbeats (i.e., the maximum detectable heart rate), and informs the width of the time window in which heart rate is considered constant (i.e., the width of the sliding windows).
A plot showing real vibration data with heartbeat events marked after rate pattern matching. The accepted tolerance around each heartbeat in the fixed-rate pattern is highlighted in the background (green for a true positive, orange for a false negative). Heartbeat events in the vibration data are marked in red if they match the pattern, purple otherwise.
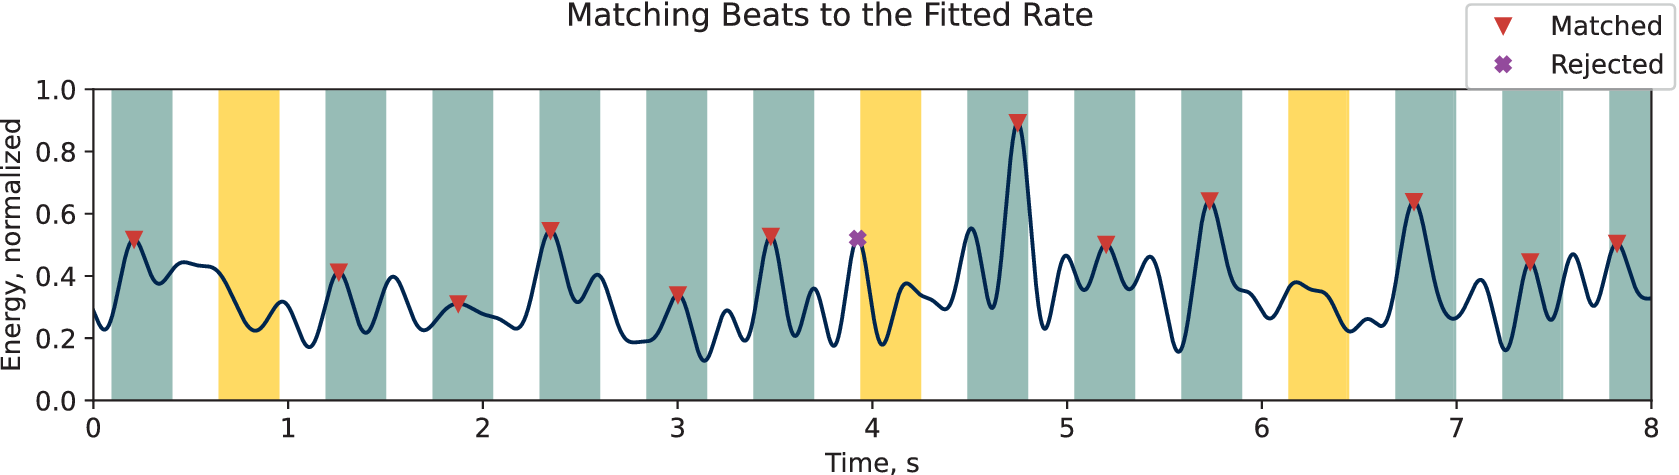
Figure 7. Long description
The line graph plots Energy, normalized on the y-axis from 0.0 to 1.0 against Time, s on the x-axis from 0 to 8.
* The data is represented by a dark blue oscillating line with various peaks of differing heights.
* Vertical background bands indicate tolerance zones. Green bands represent true positive matches where a peak falls within the expected rate. Orange bands represent false negatives where the expected rate pattern was not met by a valid peak.
* Individual heartbeat events are marked at their peaks. Red downward-pointing triangles indicate Matched beats that align with the fixed-rate pattern. A single purple X indicates a Rejected beat that falls outside the green tolerance zones, specifically occurring just before the 4 second mark.
* The highest peak occurs near 4.8 seconds, reaching an energy level of approximately 0.9 and is marked as Matched.
* A legend in the top right corner defines the red triangle as Matched and the purple X as Rejected.
FloorPulse uses a global optimization method to simultaneously estimate the heart rate and find the best-fitting pattern of detected heartbeats according to that rate. This combined pattern matching problem is non-convex because integer harmonics (e.g., double, triple, and half) of the true heart rate will have more similarity, creating local minima and necessitating global optimization. This strategy generates possible heart rates based on a predetermined algorithm, finds the best-fitting detected heartbeats with that assumed rate, then calculates a final metric based on that pattern and updates the generator accordingly. For the rate and pattern evaluation metric, we use a modified version of the standard F1 score, treating the pattern heartbeats as ground truth.
To measure the “goodness of fit” between detected heartbeats and the fixed-rate pattern, we use a modified F1 score for heartbeat detection. F1 scores are based on counts of binary labels. Each heartbeat is labeled as “true positive,” “false positive” (for the detected heartbeats), or “false negative” (for the pattern heartbeats). Due to the timing tolerance needed for semi-periodic heartbeat pattern matching, however, we found that these binary labels caused the optimization algorithm to converge inconsistently. Therefore, we regularized the pattern matching with a timing term which adds a bias toward the “true positive” detected heartbeats being closer to their corresponding ideal heartbeat time. The resulting rate fitting objective function is:

The global optimization algorithm finds the heart rate
$ r $
 (in bpm), which minimizes the negative F1 score (for heartbeats detected if the pattern were ground truth) plus the regularization term. That term is the average distance between
$ {x}_k $
 (the time a given heartbeat was detected, in seconds) and
$ {j}_k\frac{60.0}{r} $
 (the time the closest pattern heartbeat should occur, in seconds).
$ \lambda $
 is a scaling hyperparameter, which we optimized by testing this algorithm using simulated heartbeat data.
FloorPulse estimates the heart rate within each sliding window by applying a differential evolution algorithm (Bilal et al., Reference Bilal, Zaheer, Garcia-Hernandez and Abraham2020) to the previously stated objective function. The tolerance between pattern heartbeats and detected beats is set at 0.3 s, corresponding to the ANSI/AAMI/IEC standard for heart rate monitoring devices (which specifies a required maximum heart rate of 200 bpm). This tolerance determined 18 s as our sliding window size. In preliminary experiments with simulated heartbeat events, FloorPulse was able to identify the correct heart rate within <0.01 bpm average error.
5.2. Heart rate signal confidence estimation
Because heartbeat vibrations are so small, it is not always possible to accurately detect them among body movements and ambient noise. Many sources of vibration noise exist in home environments, including HVAC systems and appliances. Additionally, human body movements, such as walking and fidgeting, generate strong vibrations that will easily drown out those from heartbeats and take time to fade out. To work around these challenges, we use a confidence estimator to gauge the signal quality in each sliding window in order to know when heart rate can be accurately measured.
Since the relationship between signal characteristics and heart rate accuracy is complex and indirect, we use a regression model to form a single metric for signal confidence. To determine when heartbeats can be accurately detected, we combine standard time and frequency features with data about detected heartbeats and body movements in each signal window. The time domain features include variance and root-mean-square (RMS) power of the detected vibrations, which increase with ambient noise. For the frequency domain, we use standard features, such as the top peak frequencies, spectral centroid, roll-off frequency, and spectral flatness (Peeters, Reference Peeters2004), which will vary depending on what signals are dominating the measured vibration (i.e., whether heartbeats or other vibrations are dominant). Finally, we include the SNR and detection ratio between heartbeats and other body movements from FloorPulse’s heartbeat-like peak detection, to include information about the heartbeat detection itself.
In order to train our machine learning confidence model, we need a proxy metric to act as the training target. Using heart rate error seems intuitive at first, but is ineffective in practice because each signal window’s heart rate error is random, with a distribution dependent on the signal characteristics in that window. Instead, we use the F1 score for true heartbeat detection, which correlates with the variance of heart rate error and thus the likelihood of measuring the correct heart rate. The F1 score is calculated similarly to the rate-pattern F1 score in Section 5.1, including the same signal tolerance between detected and ground truth heartbeats. For training, we use actual ground truth heartbeat times instead of the periodic pattern heartbeat times as reference for labeling each heartbeat as “true positive” or “false positive.”
To estimate signal confidence, FloorPulse applies gradient-boosted random forest regression to every 18 s sliding window. This particular regression model is used because of its insensitivity to scale differences between input features (e.g., SNR is a ratio in dB while roll-off frequency is a frequency in Hz). Additionally, random forest models are resistant to overfitting when the input feature set is too large, which benefits FloorPulse since the optimal vibration signal features for predicting heartbeat detection accuracy are unknown. The boosted forest algorithm is implemented using scikit-learn’s GradientBoostingRegressor (Pedregosa et al., Reference Pedregosa, Varoquaux, Gramfort, Michel, Thirion, Grisel, Blondel, Prettenhofer, Weiss, Dubourg, Vanderplas, Passos, Cournapeau, Brucher, Perrot and Duchesnay2011). We finally improve FloorPulse’s overall heart rate accuracy by rejecting windows with a low predicted signal confidence, reducing the impact of long-term noise.
Because of variations in physiology (between people) and vibration propagation (between different structures and different locations in the same structure), the distribution of signal confidence scores varies between participants and sensor locations. Thus, after we train our regression model on a subset of our collected data, we use a plot similar to Figure 8 to select the ideal thresholds (i.e., the threshold that yields the minimum or desired accuracy) for each sensor and participant combination based on the training data. As can be seen, the median heart rate error generally decreases as the threshold is raised, although as the number of accepted heart rate samples nears zero, some confidence outliers (i.e., windows with higher confidence but low heart rate accuracy) become apparent. At the increased distance of 2 m away, the heartbeat vibration intensity is much lower across all participants, which leads to more such outliers and consequently degraded correlation between the signal confidence score and heart rate accuracy. Despite this, FloorPulse is able to achieve ~10 bpm error on average even with 2 m between the participant and sensor. Notably, two participants were excluded from Figure 8 because of heart conditions, which led to significantly different performance, which we discuss in Section 6.2.
Three plots used for selecting the minimum window confidence threshold, each for a different sensor location. Each plot shows median heart rate error vs the score threshold across each of our participants. For most people, the general trend is for error to slowly decrease as the threshold is raised until it reaches zero or all data is excluded. For some, there is an increase in error as the number of remaining windows nears 0 due to a few outliers with low accuracy but a higher window score. At 2 m away, such outliers are present in almost all participants’ data. Two participants (P2 and P8) are excluded because their data were significantly different from the rest.
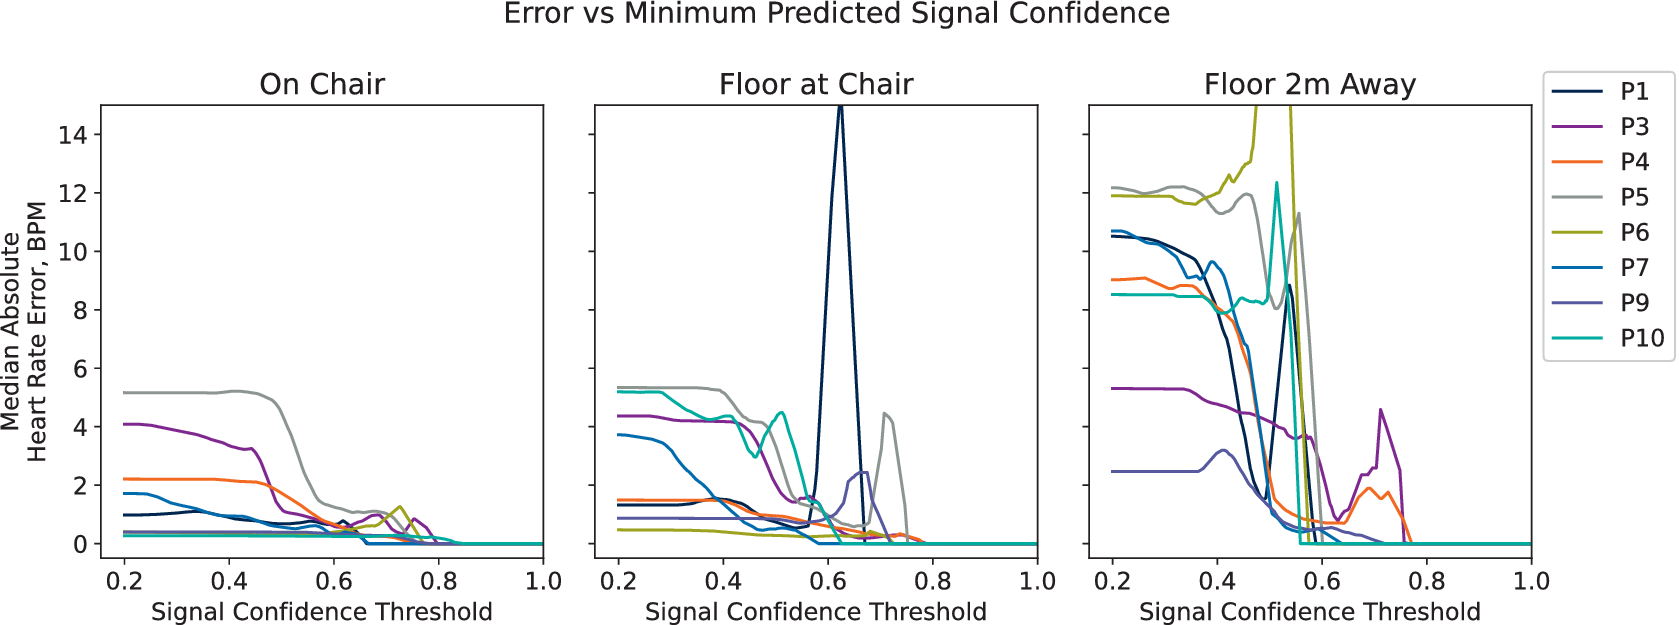
Figure 8. Long description
A three-panel line graph titled Error vs Minimum Predicted Signal Confidence. The y-axis for all panels is Median Absolute Heart Rate Error, B P M, ranging from 0 to 14. The x-axis for all panels is Signal Confidence Threshold, ranging from 0.2 to 1.0. A legend on the right identifies eight participants: P 1, P 3, P 4, P 5, P 6, P 7, P 9, and P 10.
* Left Panel (On Chair): Most participants start with an error between 0 and 5. As the threshold increases, the error for all participants trends downward, reaching near zero by a threshold of 0.8.
* Middle Panel (Floor at Chair): Similar downward trends are visible, but P 1 shows a sharp, narrow spike in error reaching 15 B P M at a threshold of approximately 0.6 before dropping back to zero. P 5 also shows a small late peak around 0.7.
* Right Panel (Floor 2 m Away): Initial error rates are higher, ranging from 2 to 12 B P M. The data is more volatile with several participants (P 6, P 7, P 10) showing sharp spikes in error between thresholds of 0.4 and 0.6 before the data lines terminate or drop to zero. P 3 and P 4 show smaller secondary peaks between 0.6 and 0.8.
6. Evaluating FloorPulse in a home environment
6.1. Experiment setup
We evaluate FloorPulse’s performance in a real home environment with 10 different participants of varying ages, heights, weights, and sexes. A hard-backed chair is placed in a hardwood-floored room as shown on the top-left of Figure 9. The hard chair and floor are used to identify a performance baseline, leaving the additional vibration damping from padded chairs and carpeted floors to be addressed in future work. While the room shown is relatively empty since it was an otherwise unused space, the rest of the home used for data collection is normally furnished and occupied, contributing realistic noise from heating, ventilation, and air conditioning (HVAC) systems, plumbing, and other occupants. Three vibration sensors are in use, shown in Figure 9 with a close-up view in the bottom-right. One sensor is placed on the participants’ chair (labeled “On Chair”), one on the floor directly beneath the chair (labeled “Floor at Chair”), and one a distance of 2 m away on the floor (labeled “Floor 2 m Away”). These three locations serve as the baseline, typical, and target distance for FloorPulse to detect heartbeats, respectively.
Photos of the in-home experiment environment. Top-left is the chair for participants to sit in. Top-right shows a researcher in that chair, pointing to the 2 m-away sensor. Bottom-left shows a profile of the researcher with the ground truth pulse sensor clipped to his ear. Bottom right shows one of the sensor front-end boards in detail. FloorPulse’s vibration sensors and ground truth devices are highlighted with arrows and circles, with dashed lines connecting the same geophone between photos.
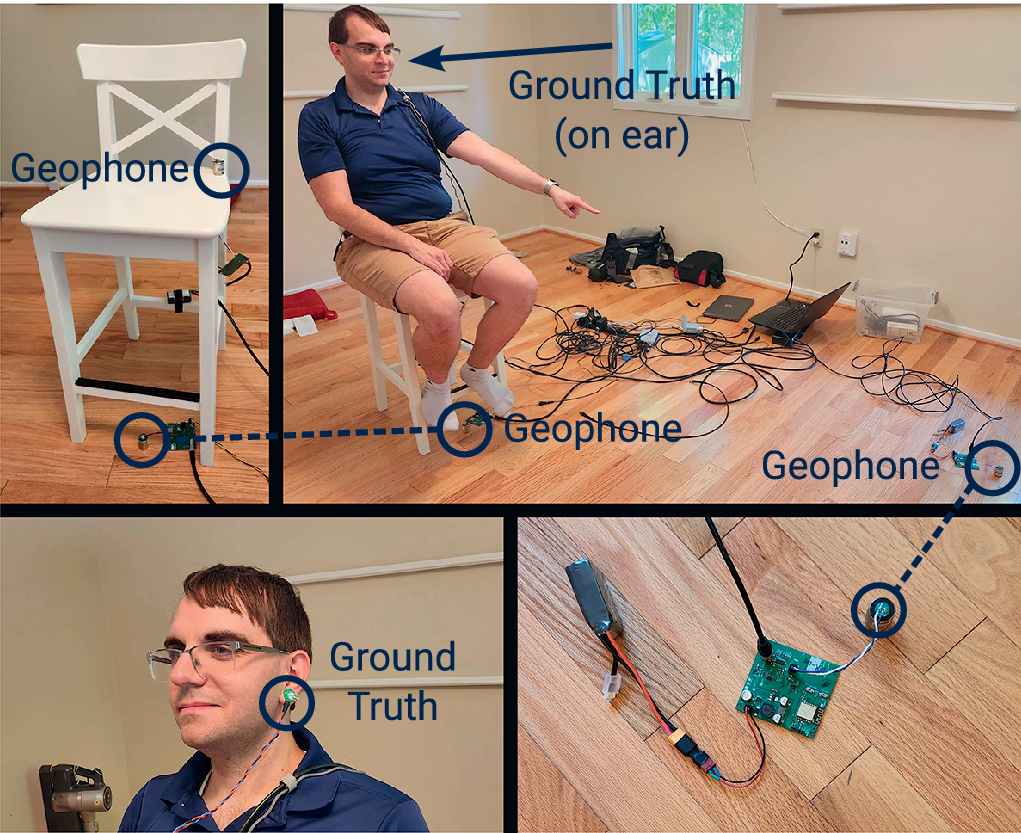
Figure 9. Long description
The four panels are organized as follows.
* Top-left panel: A white wooden chair on a hardwood floor. A blue circle highlights a Geophone attached to the backrest, and another blue circle highlights a Geophone on the floor next to the front-right leg.
* Top-right panel: A wide shot of the room. A researcher sits in the white chair, pointing toward a sensor 2 meters away. A blue arrow labeled Ground Truth on ear points to his head. A blue circle on the floor beneath the chair highlights a Geophone, connected by a dashed line to the Geophone in the first panel. A second Geophone is circled on the floor in the far right foreground.
* Bottom-left panel: A close-up profile of the researcher. A blue circle labeled Ground Truth highlights a pulse sensor clipped to his earlobe.
* Bottom-right panel: A detailed view of the sensor hardware on the floor. It shows a green circuit board connected to a battery pack and a small cylindrical Geophone. A dashed line connects this Geophone to the one in the far right of the top-right panel.
Each participant performed light exercise (e.g., jumping jacks or jogging in place) for a few minutes until their heart rate rose above normal, then rested in the chair shown in Figure 9, which has FloorPulse’s geophone sensors placed on it. For 15–20 min, depending on participant availability, we recorded vibration and ground truth heartbeat data for each participant as their heart rate slowed back to resting. Ground truth data were obtained from a hobbyist-grade optical pulse sensor (Gitman and Murphy, Reference Gitman and Murphy2023) worn on the participants’ finger or ear (shown in the bottom-left of Figure 9). While an ECG chest strap is typically the most reliable source of heartbeat timing, we found the optical sensor less burdensome on our participants, particularly given participants of varying age and gender (Zheng et al., Reference Zheng, Ha and Zhang2017). Twenty percent of the collected data was separated for training the signal confidence prediction model (see Section 5.2), proportionally taken from each participant and sensor location, with the remaining 80% used for system evaluation. IRB approval was received for all relevant data collections, and the dataset is available publicly (Codling et al., Reference Codling, Shulkin, Zhang, Gersey and Zhang2026).
6.2. Heart rate accuracy from floor and chair vibrations
We show that FloorPulse’s heart rate detection algorithm outperforms past approaches in Figure 10. The baseline approach in Figure 10 uses FloorPulse’s vibration hardware, but uses a conventional time difference and median approach to estimate the heart rate (Brüser et al., Reference Brüser, Winter and Leonhardt2013). The other two bars add FloorPulse’s vibration feature processing layers, namely the periodic heart rate pattern matching and window rejection from signal confidence estimation. Each person’s data uses an individually optimized window score threshold for each location selected using the data in Figure 8.
Mean absolute heart rate error across all 10 participants at each tested sensor location. The baseline approach consists of signal filtering and peak detection, determining the heart rate by the simple median of the IBIs. As the algorithmic components of FloorPulse are introduced, the error and its variance decrease for all three sensor locations. Dashed lines indicate typical wearable and medical device error rates, for comparison.

Figure 10. Long description
A bar chart with the Y axis labeled Mean Absolute Heart Rate Error, B P M, ranging from 0 to 25. The X axis is labeled Sensor Location with three categories from left to right: On Chair, Floor at Chair, and Floor 2 m Away.
Each category contains three bars with error whiskers:
* Red bar: Baseline: Median I B I.
* Purple bar: Rate Pattern Matching.
* Orange bar: Our Method: Rate Pattern plus Rejection.
Data trends:
* On Chair: The red bar is approximately 8 B P M, purple is slightly lower, and orange is the lowest at roughly 6 B P M.
* Floor at Chair: The red bar is approximately 10 B P M, purple is 9 B P M, and orange is 7.5 B P M.
* Floor 2 m Away: The red bar is approximately 14 B P M, purple is 12 B P M, and orange is 10 B P M.
Two horizontal dashed lines span the graph. The top line at 7 B P M is labeled Typical Wearables. The bottom line at 5 B P M is labeled Medical Standard. Error whiskers are largest for the Floor 2 m Away category and smallest for the On Chair category.
Both the average and variance of the heart rate error improve at all three sensor locations as FloorPulse is developed. On the chair and nearby on the floor, FloorPulse’s performance is on par with consumer wearable heart rate sensors, with somewhat higher error than medical devices. At 2 m away, FloorPulse still achieves an average 10 bpm heart rate error, comparable to research-grade wearable devices (Bent et al., Reference Bent, Goldstein, Kibbe and Dunn2020). For all three sensor locations, FloorPulse shows greater than 25% reduction in heart rate error compared to the baseline algorithm for measuring heart rate from floor vibrations.
To compare FloorPulse’s performance across different people, Figure 11 shows heart rate accuracy aggregated by both participant and sensor location. As expected, the average error increases as the geophone is placed farther from the participant. For some rare cases (e.g., persons P1 and P3), the error is unusually improved due to individual variations in heartbeat vibration signal content.
FloorPulse ‘s final heart rate accuracy using optimized window score thresholds for each participant and sensor location. Each bar represents a different sensor location and each group a different participant. The final grouping is averaged across all 10 participants to show the overall performance.

Figure 11. Long description
The y-axis is labeled Median Absolute Heart Rate Error, B P M, with a scale from 0 to 20. The x-axis is labeled Subject and contains 11 groups: P 1 through P 10 and a final A V G group. A legend at the top center identifies three categories: On Chair in dark blue, Floor at Chair in red, and Floor 2 m Away in purple.
Data trends from left to right:
* P 1: Errors are low, between 4 and 6 B P M.
* P 2: Shows a significant spike for Floor at Chair, reaching nearly 20 B P M, while the other two locations are around 10 B P M.
* P 3 and P 4: All errors are below 5 B P M.
* P 5 and P 6: Floor 2 m Away shows higher error than the other two locations, peaking at 11 B P M for P 6.
* P 7: Floor at Chair has the lowest error, near 1 B P M.
* P 8: Floor at Chair spikes to 14 B P M.
* P 9 and P 10: Errors are generally below 10 B P M.
* A V G: This final group is enclosed in a dashed black rectangle. On Chair has the lowest average error at approximately 5 B P M, followed by Floor at Chair at 7 B P M, and Floor 2 m Away at 7.5 B P M.
For some participants, FloorPulse is able to measure heart rate near the 5 bpm accuracy necessary for medical devices (Association For The Advancement Of Medical Instrumentation, 2022). However, specific individuals exhibit significantly degraded performance, as shown in Figures 8 and 11. This is likely due to a medical condition affecting the heart, which person P2 disclosed having soon after their data was collected. Due to this condition, the vibrations generated by their heartbeats differ in frequency content from those of healthy individuals, making the wavelet filter described in Section 3.2 less effective at emphasizing their heartbeat-induced vibrations. We suspect persons P5 and P8 have similar conditions; however, this cannot be verified due to IRB restrictions. This result suggests future avenues for improvement which we will discuss in Section 7.
Figure 12 shows FloorPulse’s accuracy over time for the 20 min recorded for one person. As seen in Figure 11, FloorPulse’s performance with person P10 closely mirrors the average across all participants, so they serve as a representative sample in Figure 12. The plotted data show those heart rate samples meeting the minimum confidence score threshold as filled points, and rejected samples with open circles. In general, the detected heart rate is distributed around the ground truth rate (i.e., the error is distributed around zero), though with sharp jumps from environmental noise events. Since the error is distributed around zero, future work could likely improve by low-pass filtering new heart rate estimates based on past samples. As expected, error in the heart rate worsens as the vibration sensor is placed farther from the participant due to decreased SNR.
Heart rate detection errors over time for one participant (person P10) for all three sensor locations. Open circles indicate time windows where the heart rate was rejected by the signal confidence estimator.

Figure 12. Long description
The multi-panel scatter plot shares a common x-axis representing Time in minutes from 0 to 20 and a common y-axis representing F l o H R minus Ground Truth Heart Rate Difference in b p m, ranging from minus 25 to 25. A legend at the top right indicates that solid dots are Accepted data and open circles are Rejected data.
* The top panel, labeled On Chair, shows data in dark blue. Most points are solid dots clustered tightly around the 0 line, indicating high accuracy. A few open circles appear near the 5 and 7 minute marks.
* The middle panel, labeled Floor at Chair, shows data in red. There is a much higher density of open circles scattered between 0 and 25 b p m. Solid dots are sparse and less centered on the 0 line compared to the top panel.
* The bottom panel, labeled Floor 2 m Away, shows data in purple. This panel has the highest concentration of open circles, filling much of the space between 0 and 25 b p m. Solid dots are scattered inconsistently, often appearing below the 0 line between 5 and 20 minutes.
While FloorPulse is designed to be robust to body movements and other environmental noise, some performance variation can be attributed to these factors. Near the 15-min mark in Figure 12, the participant became impatient and agitated, causing them to begin fidgeting. This can be observed in Figure 12 for all three sensors’ data. For the chair and nearby floor geophones, fewer signal windows are accepted by the signal scoring algorithm during that period of time, leading to more time between viable heart rate samples. For the 2 m-away sensor, these body motion vibrations are more attenuated, just as the heartbeat vibrations are, so many fewer accurate heart rate estimates were accepted during this time.
7. Discussion and future work
One significant challenge for FloorPulse is variation in heartbeats between different people, particularly those with heart troubles. As seen in Figures 8 and 11, FloorPulse exhibits significantly worse performance with some participants. Observing the raw vibration signals from those participants, many of the errors stemmed from “double-counted” heartbeats. This “double-counting” occurs when the “second heart sound” from these participants (Gordon, Reference Gordon1877) produces enough vibration to be confused as a separate heartbeat. One approach to address this challenge would be to reduce the range of possible heart rates, with the tradeoff of potentially excluding the true heart rate during rate-pattern matching. Currently, FloorPulse’s maximum and minimum permissible heart rate are determined from medical device standards (Association for the Advancement of Medical Instrumentation, 2022). To implement an approach with tighter bounds, we would need a way to estimate the range of heart rate for the participant in each time window before performing heart rate estimation.
Different types of abnormal heart rhythms are also a significant challenge, as suggested by the difficulties noted in Section 6.2. The most common heart arrhythmias in practice are bradycardia, tachycardia, and atrial fibrillation (AFib) (Spodick, Reference Spodick1992; Wyndham, Reference Wyndham2000). For bradycardia and tachycardia, characterized by an abnormally slow or fast heart rate, respectively, FloorPulse may be capable of capturing these heart rhythms but would need adequate evaluation to be certain. If the previously discussed heart rate bounds adjustment were implemented, however, there could be a conflict when working with such heart rates, even if they are within the standard bounds of 30–200 bpm (Association for the Advancement of Medical Instrumentation, 2022).
AFib poses a significant problem for future applications of FloorPulse in clinical environments, since such a heart rhythm is not strictly periodic. This lack of periodicity conflicts with the periodic heart rate pattern matching detailed in Section 5.1. Given that the definition of “heart rate” thus breaks down during AFib, however, we consider this an acceptable limitation beyond the scope of FloorPulse’s current version. This same limitation applies to other types of irregular heart rhythms, including those from artificial hearts, which do not produce a discernible heart rate. Since such cardiac abnormalities are highly important to detect for some populations, future work could use a variation of FloorPulse’s signal confidence estimation to detect such irregular heart rhythms directly from the time-frequency signal properties.
Because FloorPulse uses ambient vibrations, scaling to multiple participants in a space will require some means to separate their heartbeats. It is possible that such separation could be achieved using an individually tailored filtering approach. Currently, FloorPulse uses a structure-informed wavelet filter that is tuned to match heartbeat vibrations from healthy adults in general, as described in Section 3.2. If we replace the generic wavelet with a person-specific template, it may be possible to identify which vibrations belong to different people, as has been demonstrated in prior works with similar vibration-based health monitoring (Jia et al., Reference Jia, Bonde, Li, Xu, Wang, Zhang, Howard and Zhang2017; Fagert et al., Reference Fagert, Mirshekari, Zhang and Noh2022). These templates could be created based on a sample of recorded heartbeat vibrations for each person and adapted to the sensor’s location by modeling the vibration parameters of the structures (e.g., floor and chair) between the participant and sensor. The accuracy of heartbeat detection would then be dependent on the quality of both the person’s vibration template and the structural propagation model. In turn, this template and model would require many heartbeat samples from different participants for each structure and for several structure environments for each person. If this challenge can be mitigated or tolerated, however, this template-filtering approach may additionally help address the variations in heartbeat vibration due to medical conditions that we encountered during the evaluation in Section 6.2.
Since FloorPulse’s heartbeat detection and accuracy confidence estimation are currently tuned for each participant and sensor individually, some calibration is required for each new participant and deployment. While we have worked to reduce the calibration burden in the structural model (see Section 3.2), the tradeoff between calibration and heart rate accuracy in the confidence estimator remains to be explored more thoroughly. To demonstrate FloorPulse’s capability, we tuned the estimator for each participant, as shown in Figure 8, to achieve a high accuracy for each participant. This approach could be viable in some applications such as long-term care where the same individuals are monitored for long periods of time, but may be more problematic for more dynamic in-home monitoring scenarios. Since the confidence estimator FloorPulse uses is based on the signal properties of the vibration data, it is possible to tune it more generally per sensor or even per structure, rather than per participant. Using the existing dataset, we implemented a trial version of this general confidence estimator using a single threshold parameter at each sensor location for all participants (an average from Figure 8). The generalized method showed promising improvements in average accuracy (5 bpm instead of the 10 bpm reported in Section 6.2), but with a tradeoff in usability because several users’ data (specifically P2, P5, P6, and P8) is entirely excluded at 2 m due to low accuracy confidence. Maintaining accuracy and applicability while generalizing in this way likely requires a large corpus of training data from many participants, but could then allow for zero-shot deployment of FloorPulse without additional calibration for new participants.
While FloorPulse is designed to be adaptable to its deployment environment, this article’s evaluation is limited to a single floor in a single home environment. In FloorPulse’s current form, adapting to a new structure is relatively straightforward, but does require additional calibration data as discussed above. First, the wavelet filter can be adapted to a new structure by collecting a sample of heartbeat vibrations from a few healthy adults and tuning the wavelet filter bank to match the sample’s frequency range, as described in Section 3.2. Second, the confidence estimator can be adapted to a new structure by collecting a sample of heartbeat vibrations from a few healthy adults and tuning the estimator’s parameters to achieve high accuracy for those samples, as performed in Section 5.2. Since this calibration process may be overly burdensome for some applications, future work could explore adapting FloorPulse to new structures through model transfer approaches that leverage the structural properties of the new environment (Mirshekari et al., Reference Mirshekari, Fagert, Pan, Zhang and Noh2020; Dong et al., Reference Dong, Zhu and Noh2022; Dong et al., Reference Dong, Codling, Rohrer, Miles, Sharma, Brown-Brandl, Zhang and Noh2023) to adapt the wavelet filter and confidence estimator without requiring labeled calibration data.
8. Related work
Typical heart rate measurements involve direct body contact. Without use of a device, this can take the form of skin contact with a major blood vessel (e.g., at the neck or wrist). Devices to detect heartbeats automatically include pulse oximeters—whether standalone or as part of another wearable device (Gil et al., Reference Gil, Orini, Bailón, Vergara, Mainardi and Laguna2010; Parak and Korhonen, Reference Parak and Korhonen2014)—acoustic sensors (Castiglioni et al., Reference Castiglioni, Faini, Parati and Di Rienzo2007; Inan et al., Reference Inan, Etemadi, Wiard, Giovangrandi and Kovacs2009), and electrical contacts (Smaoui et al., Reference Smaoui, Young and Abid2017; Zheng et al., Reference Zheng, Ha and Zhang2017; Klier et al., Reference Klier, Koch, Graf, Schinköthe and Schmidt2023). While generally accurate, these devices are limited in when they will detect heart rate due to the contact requirement. Even for devices which can be worn continuously, such as smartwatches, there are still significant problems with reliability and measurement consistency, especially with sensitive populations (Farivar et al., Reference Farivar, Abouzahra and Ghasemaghaei2020).
Past work in contactless or remote heart rate measurement has most commonly used radio (Ha et al., Reference Ha, Assana and Adib2020; Ha et al., Reference Ha, Madani and Adib2021; Zhang et al., Reference Zhang, Yang, Yue, Lim and Wang2023) and computer vision (Chen et al., Reference Chen, Cheng, Song, Liu, Ward and Wang2019; Rahman et al., Reference Rahman, Cook and Taebi2023) approaches. However, these modalities commonly suffer line-of-sight challenges, limiting their application in home environments where occlusions are common. For vision-based methods, there is also a significant invasion of participant privacy that must be accounted for, while RF approaches grapple with channel bandwidth and spectrum limitations due to the shared transmission medium (Yang et al., Reference Yang, Zheng, Xiong, Liu and Ma2022; Sharma et al., Reference Sharma, Mishra, Jha and Seneviratne2024). While FloorPulse’s structural approach still requires some calibration, it is not subject to the same line-of-sight, spectrum, and perceived privacy challenges of vision and RF approaches, and thus can be more easily deployed in real-world environments.
Structural vibration sensing has shown promise for sensing human and animal activities (Hu et al., Reference Hu, Sezgin, Lin, Zhang, Noh and Pan2019; Mirshekari et al., Reference Mirshekari, Fagert, Pan, Zhang and Noh2020; Bonde et al., Reference Bonde, Codling, Naruethep, Dong, Siripaktanakon, Ariyadech, Sangpetch, Sangpetch, Pan, Noh and Zhang2021; Codling et al., Reference Codling, Bonde, Dong, Cao, Sangpetch, Sangpetch, Noh and Zhang2021; Dong et al., Reference Dong, Wu, Codling, Aggarwal, Huang, Ding, Latapie, Zhang and Noh2023; Dong et al., Reference Dong, Iammarino, Liu, Codling, Fagert, Mirshekari, Lowes, Zhang and Noh2024). This method relies on information about occupants and their activities embedded within the movement of the buildings and structures they interact with. Previous works have even extracted heart rate, respiration, and weight (Park et al., Reference Park, Cho, Balan and Ko2020; Codling et al., Reference Codling, Cohen, Kalivarapu, Noh and Zhang2022; Codling et al., Reference Codling, Shulkin, Dong, Zhang, Latapie, Noh and Zhang2023; Dong et al., Reference Dong, Codling, Rohrer, Miles, Sharma, Brown-Brandl, Zhang and Noh2023) by analyzing the physical interactions between occupants and structures. However, in all of these prior works with biorhythms, the vibration sensors are placed close to the user, and significant body contact (e.g., lying or sitting) between the participant and instrumented structure was required (Jia et al., Reference Jia, Bonde, Li, Xu, Wang, Zhang, Howard and Zhang2017; Codling et al., Reference Codling, Cohen, Kalivarapu, Noh and Zhang2022; Codling et al., Reference Codling, Shulkin, Dong, Zhang, Latapie, Noh and Zhang2023; Dong et al., Reference Dong, Codling, Rohrer, Miles, Sharma, Brown-Brandl, Zhang and Noh2023). For truly ubiquitous heart rate monitoring, FloorPulse addresses the challenges of indirectly measuring heart rate this way, namely increased sensor–participant distance and chair-to-floor transitions. Thus, FloorPulse enables heart rate sensing on the order of 2 m using the structural vibration modality while maintaining accuracy on the order of 5–10 bpm in a real home environment.
As with other heartbeat sensing methods, FloorPulse must filter the detected signals to remove noise and other artifacts. Many common methods for such filtering exist, including wavelet transforms, particle filtering, and various forms of peak-detection (Pan and Tompkins, Reference Pan and Tompkins1985; Smaoui et al., Reference Smaoui, Young and Abid2017; Fujita et al., Reference Fujita, Hiromoto and Sato2018; Van Manh et al., Reference Van Manh, Nguyen and Thang2021). Transient errors in the IBI are then obviated using median pooling and outlier detection (Brüser et al., Reference Brüser, Winter and Leonhardt2013; Ha et al., Reference Ha, Madani and Adib2021). FloorPulse builds on these algorithms, including both wavelet transformation and peak detection as described in Section 3. Additionally, FloorPulse’s unique heart rate pattern-matching approach, described in Section 5.1, is inspired by and related to the particle filter algorithm, though with some simplifying assumptions specific to the heart rate sensing task.
9. Conclusion
We have presented FloorPulse, the first system for ubiquitous heart rate monitoring using structural floor vibrations. The main challenges FloorPulse addresses are the low SNR of heartbeat vibrations, which makes them easily masked by other vibrations or electrical noise. To overcome these challenges, we developed a framework for heartbeat-induced vibration sensing hardware, which is significantly more resilient to electrical noise from both itself and the surrounding environment than existing devices. We complement this new hardware with a software filtering pipeline, diminishing the impact of body movements and ambient mechanical vibrations in the home environment.
FloorPulse’s unique heart rate detection method uses time and frequency vibration features to filter detected heartbeats by their periodicity and estimate confidence in the detected signal. FloorPulse fits detected heartbeat-like peaks to a fixed rate pattern, resiliently detecting heart rate in the presence of similar noise from phone taps or distant footsteps. These detected heart rates are then filtered against a signal confidence metric to reduce the impact of long-term vibration from body motion and mechanical sources.
Through real-world experiments with 10 people, FloorPulse achieved an overall average heart rate error around 10 bpm even when the geophone sensors are placed 2 m away. At shorter distances, FloorPulse is able to measure heart rate with similar performance to existing consumer wearable devices.
FloorPulse shows promise as a means for ubiquitous heart rate monitoring that avoids some of the pitfalls of existing sensing approaches. By using structural vibrations, it does not require a device on the participant’s body and is minimally invasive. However, FloorPulse is still functional in home environments, where most people spend the most time. From this initial work with healthy adults, we hope to eventually enable ubiquitous long-term heart rate monitoring for the most sensitive populations, including children and the elderly. Such monitoring can then serve as an early warning sign for a wide variety of potential health concerns.
Data availability statement
Our evaluation data are publicly available at https://doi.org/10.7302/8ysb-we33 (Codling et al., Reference Codling, Shulkin, Zhang, Gersey and Zhang2026). The sensor interface hardware is also open-source, and details can be found online at https://geomcu.readthedocs.io/ (Codling et al., Reference Codling, Dong, Ruiz, Bonde, Pan, Noh and Zhang2025).
Acknowledgments
The views and conclusions contained here are those of the authors and should not be interpreted as necessarily representing the official policies or endorsements, either express or implied, of any University, Corporation, or the National Science Foundation.
Author contribution
Conceptualization: J.R.C., H.L., P.Z., Y.D. Data curation: J.R.C., J.G., J.Z., P.Z. Investigation: J.R.C., J.D.S., J.Z. Methodology: J.R.C., Y.C., P.Z., Y.D. Supervision: H.L., H.Y.N., P.Z. Writing—original draft: J.R.C., J.D.S. Writing—review and editing: J.G., J.Z., H.Y.N., Y.D. All authors reviewed the final submitted draft.
Funding statement
This research was supported by grants from Cisco Systems, AiFi, Inc., and the National Science Foundation (under grant NSF-CMMI-2026699).
Competing interests
H.L. was employed by Funder Cisco Systems during the progress of this work. No other competing interests exist.
Ethical standards
The research meets all ethical guidelines, including adherence to the legal requirements of the study country. Human subjects data collection and handling were reviewed and approved by the University of Michigan IRBMED. AI writing tools were used in the creation of this manuscript for language editing and initial text generation, but all final content was generated and approved by the authors.
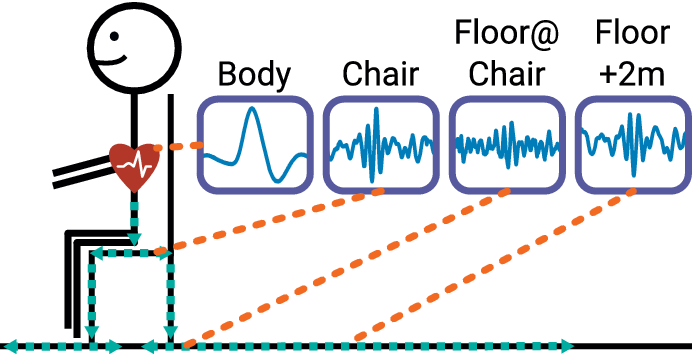

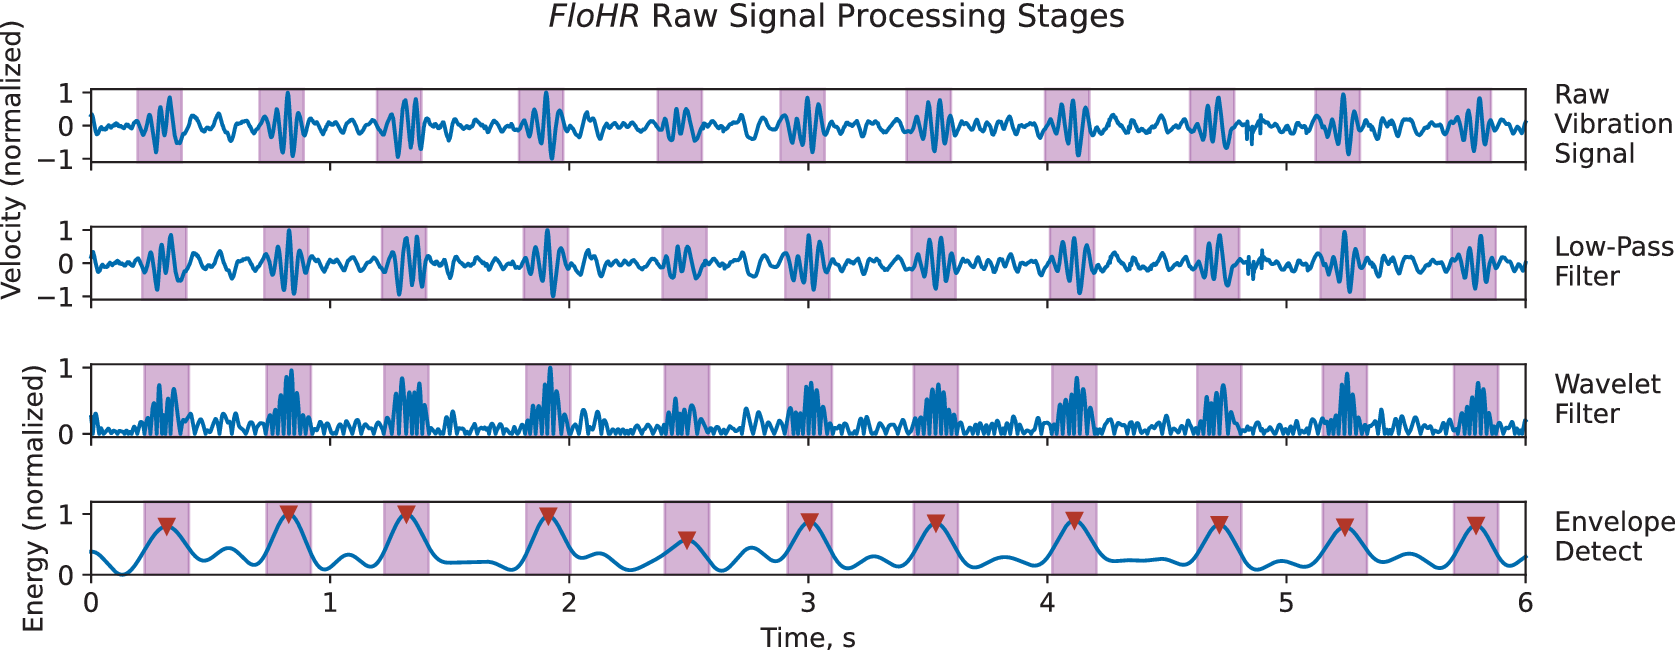
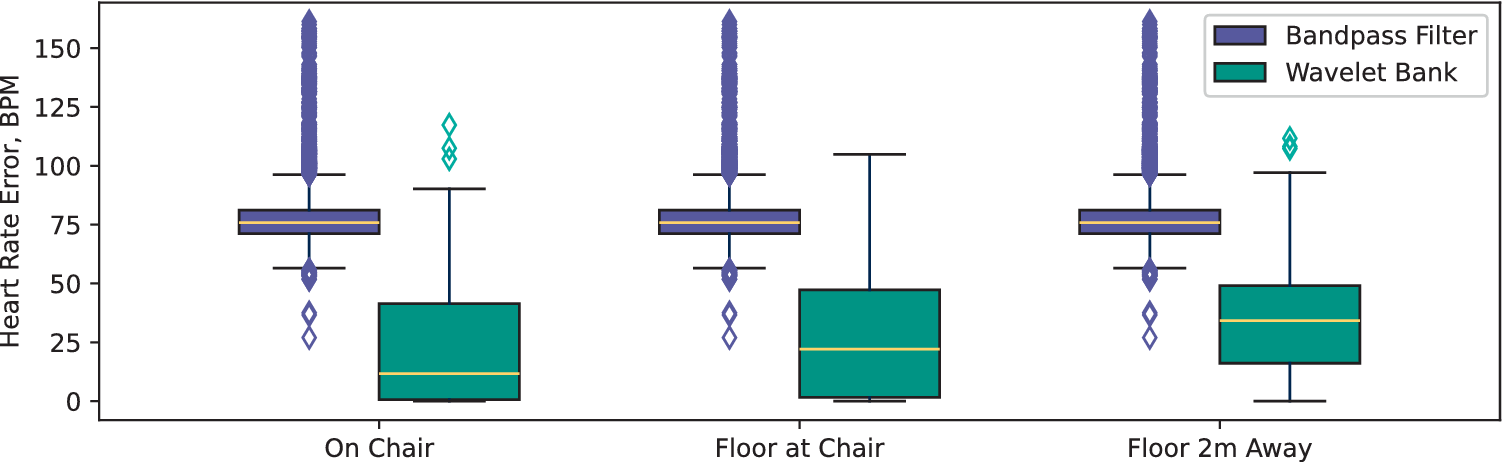
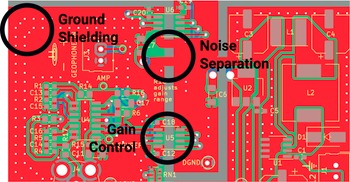
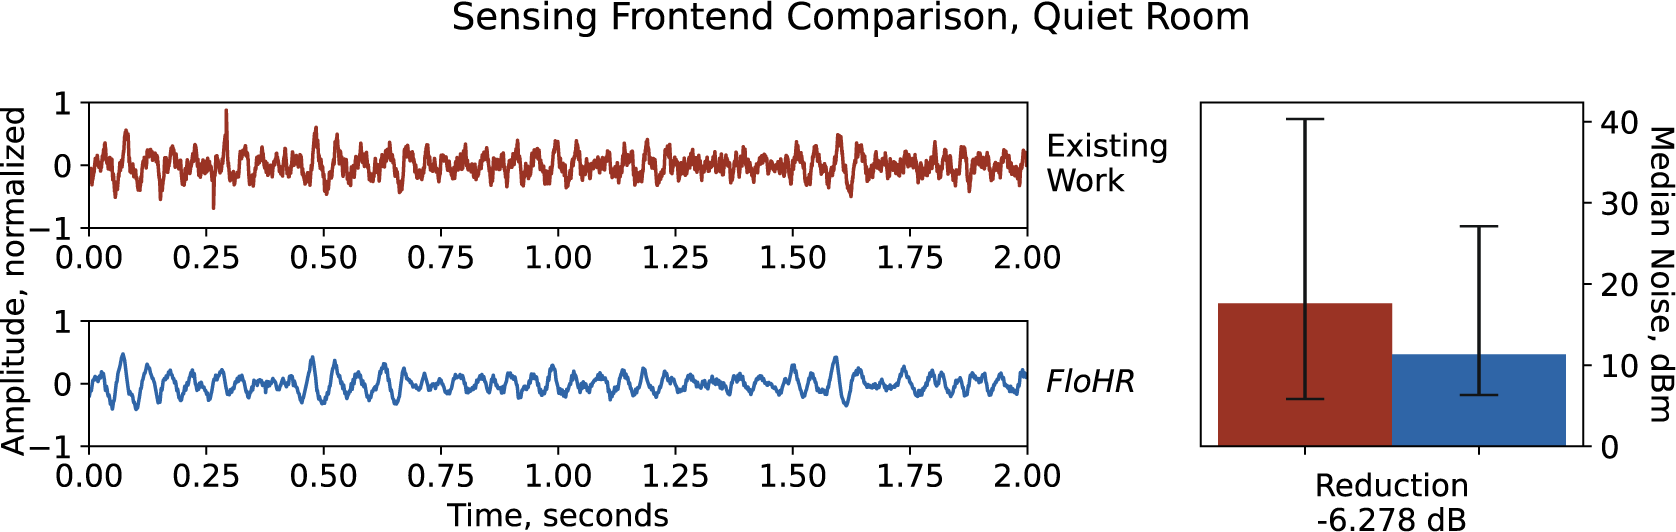
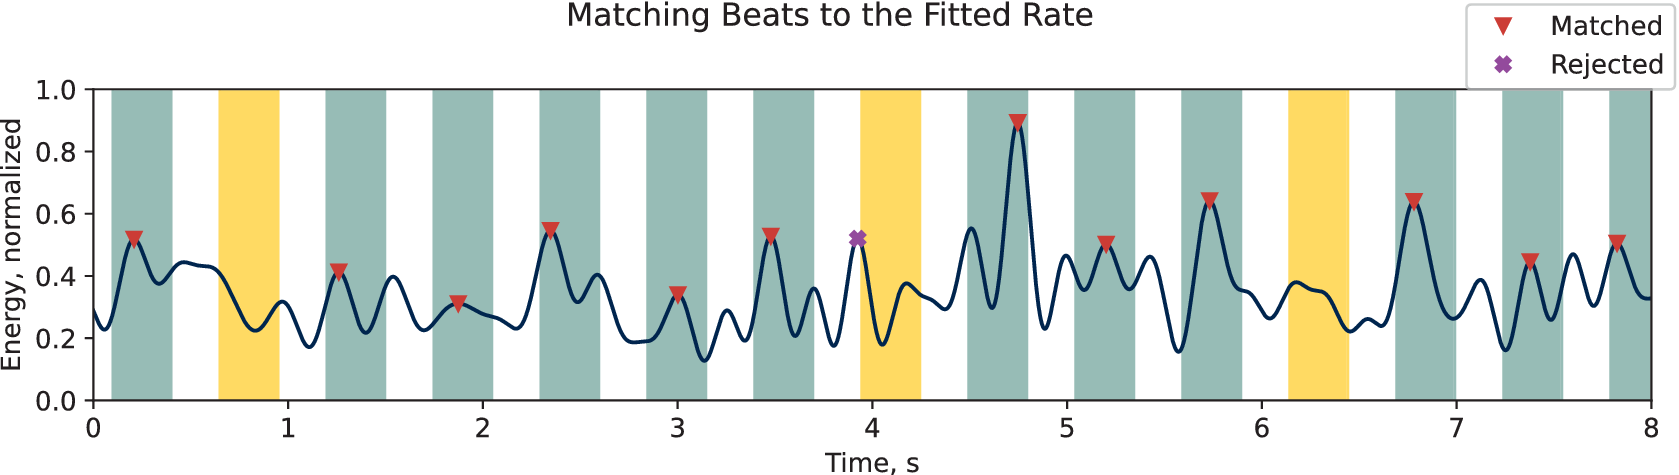
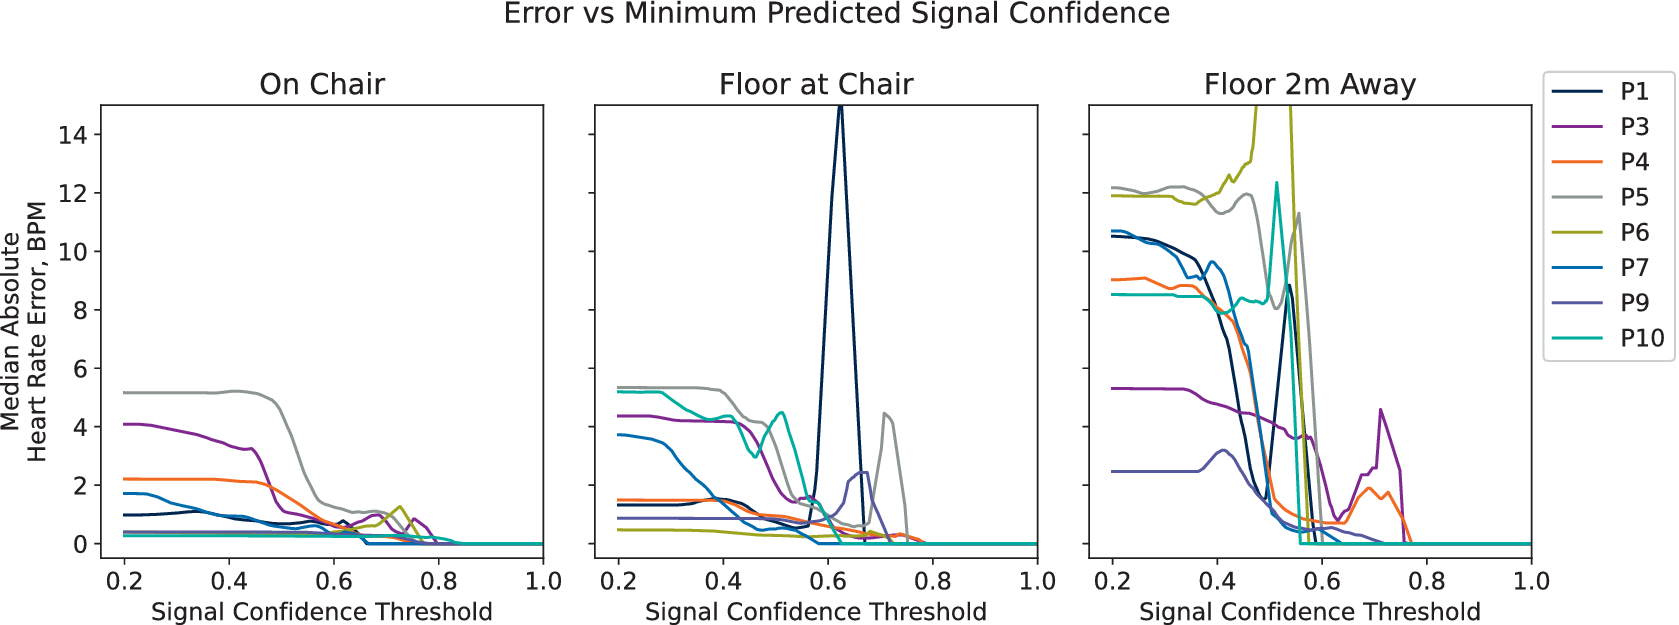

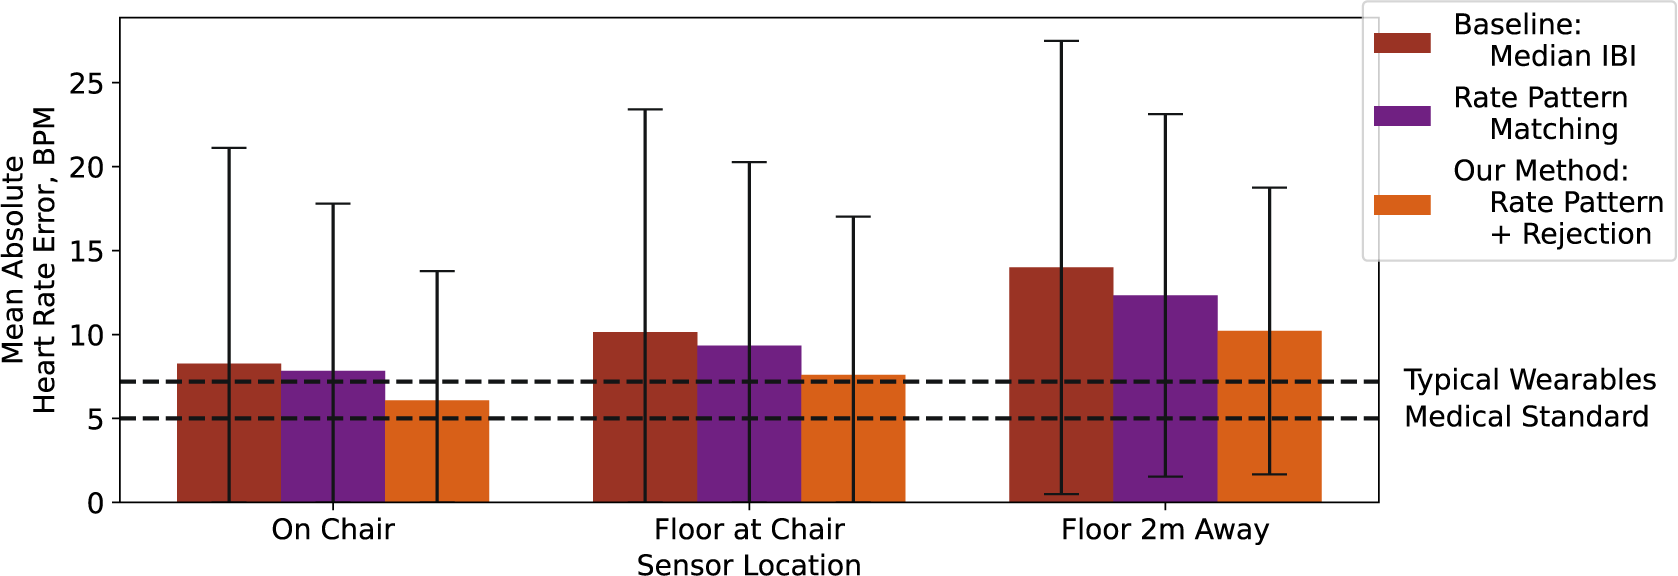
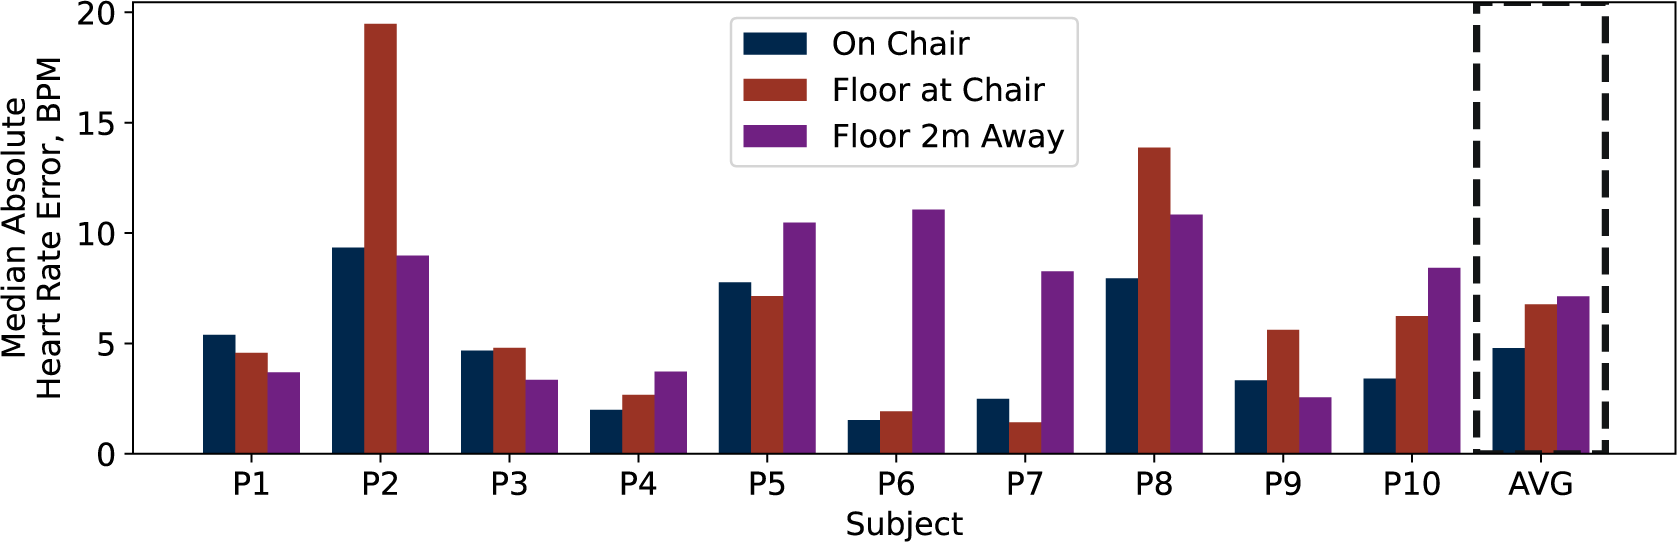
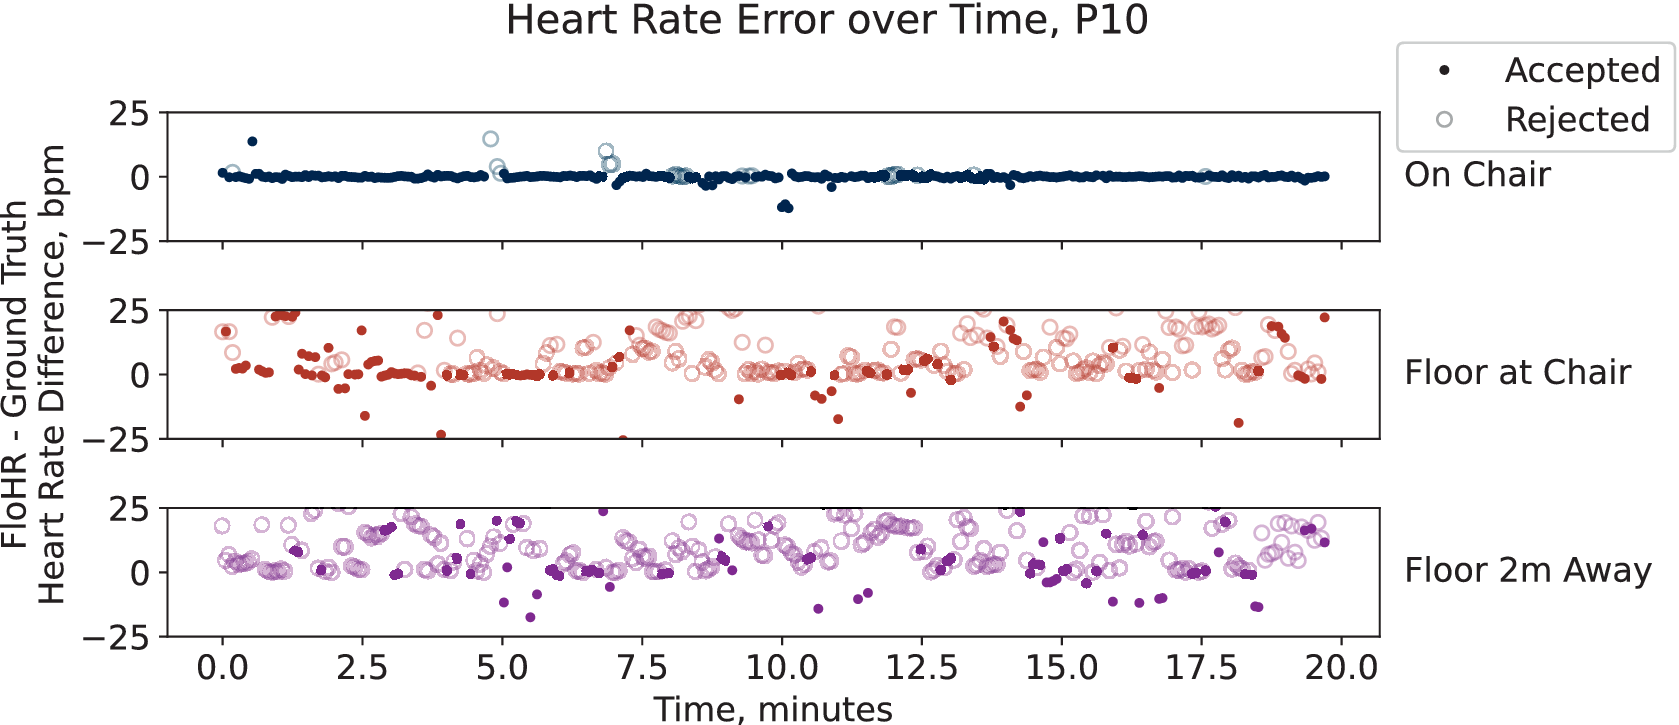

 Open access


Comments
No Comments have been published for this article.