INTRODUCTION
Parasitism is frequently linked with changes in the biology of hosts, resulting in distinct infected phenotypes (Poulin and Thomas, Reference Poulin and Thomas1999; Poulin, Reference Poulin, Brockmann, Roper, Naguib, Wynne-Edwards, Mitani and Simmons2010). These infected phenotypes may reflect parasite strategies to manipulate hosts or adaptive responses of hosts to infection. Thus, processes that result in infected phenotypes can be relevant for understanding host–parasite dynamics, complex parasite life cycles and patterns of host specificity. In addition, infected phenotypes will determine the ecological roles of parasites, for instance in their contributions to biomass (Kuris et al. Reference Kuris, Hechinger, Shaw, Whitney, Aguirre-Macedo, Boch, Dobson, Dunham, Fredensborg and Huspeni2008), food webs (Lafferty et al. Reference Lafferty, Dobson and Kuris2006, Reference Lafferty, Allesina, Arim, Briggs, De Leo, Dobson, Dunne, Johnson, Kuris and Martinez2008), population dynamics (Ebert, Reference Ebert2005) and ecosystem processes (Hudson et al. Reference Hudson, Dobson and Lafferty2006). Identifying the drivers and diversity of infected phenotypes is thus of broad ecological and evolutionary relevance.
Parasites manipulate hosts to increase the probability of transmission to the next host. Targets for such manipulation include host behaviour, morphology, sex ratios and resource allocation patterns (Poulin, Reference Poulin1998, Reference Poulin, Brockmann, Roper, Naguib, Wynne-Edwards, Mitani and Simmons2010). For instance, parasitism by the trophically transmitted trematode (Podocotyloides stenometra Pritchard 1966) induces the development of pink nodules on the surface of the coral hosts, which attract increased grazing by butterfly fish – the next host in the trematode life cycle (Aeby, Reference Aeby2003; Palmer et al. Reference Palmer, Roth and Gates2009). Such trophic transmission strategies are likely to increase transmission success under a broad range of conditions (Seppälä and Jokela, Reference Seppälä and Jokela2008; Parker et al. Reference Parker, Ball, Chubb, Hammerschmidt and Milinski2009; Médoc and Beisel, Reference Médoc and Beisel2011). However, changes in host biology may also reflect adaptive responses of hosts to reduce the fitness consequences of parasitism. For instance, infected hosts may undergo a shift in life history towards early reproduction to allow fecundity compensation (Chadwick and Little, Reference Chadwick and Little2005). Yet other changes in host biology may result from direct resource competition between host and parasite (Smith, Reference Smith2007) or they may be an inevitable by-product of the host–parasite interaction (Minchella, Reference Minchella1985) without any adaptive significance for the host or the parasite (Thomas et al. Reference Thomas, Adamo and Moore2005).
Because a number of factors underlie changes in infected host phenotypes, the nature of the parasite-induced alteration should be carefully assessed (Cézilly and Perrot-Minnot, Reference Cézilly and Perrot-Minnot2010). Furthermore, examining a suite of traits associated with infected hosts will provide a more complete picture of host–parasite interactions. Here we focus on a system that does not involve trophic transmission and characterize a diversity of infected phenotype traits in order to identify adaptive and non-adaptive drivers of phenotypic change associated with the host–parasite interaction. In particular, we examine phenotypes of colonial hosts infected by an endoparasite with a complex life cycle. Recently we have shown host manipulation in the form of periodic castration by the endoparasite (Hartikainen and Okamura, Reference Hartikainen and Okamura2012). Here we expand on this finding to ask: (1) Are infected phenotypes characterized by other changes in morphology or physiology? (2) Can we identify the drivers of these changes? (3) Are there transgenerational (maternal) effects of infected phenotypes?
The study system
The myxozoan parasite Tetracapsuloides bryosalmonae is an endoparasite of freshwater bryozoans and salmonid fish. Tetracapsuloides bryosalmonae develops first as covert infections in the form of single cells associated with the bryozoan body wall (Morris and Adams, Reference Morris and Adams2006). Overt infection entails the development of sac-like stages with infectious spores when bryozoan hosts are in good condition and undergoing vigorous growth (Hartikainen and Okamura, Reference Hartikainen and Okamura2012). The sacs are free floating in the bryozoan body cavity. Once mature, the sacs rupture and thousands of spores (Okamura et al. Reference Okamura, Hartikainen, Schmidt-Posthaus and Wahli2011) are released to the water column to infect fish. Laboratory observations confirm that T. bryosalmonae cycles between covert and overt infections dependent on host condition (McGurk et al. Reference McGurk, Morris, Auchinachie and Adams2006; Tops et al. Reference Tops, Hartikainen and Okamura2009). The covert parasite phase is apparently benign, having no detectable impact on host growth or reproduction (Tops et al. Reference Tops, Hartikainen and Okamura2009). Development in fish results in spore release with urine and possible transmission to bryozoans. Infection of fish can lead to the onset of proliferative kidney disease (PKD), an emerging disease that can have devastating consequences for farmed, stocked and wild salmonids (Okamura et al. Reference Okamura, Hartikainen, Schmidt-Posthaus and Wahli2011).
Freshwater bryozoans are ubiquitous suspension-feeding colonial invertebrates found on surfaces such as submerged tree roots, branches, rocks and stones in lotic and lentic habitats (Wood and Okamura, Reference Wood and Okamura2005). Fredericella sultana is the most common bryozoan infected by T. bryosalmonae and forms three-dimensionally branching colonies that occur in abundance on submerged roots of riparian trees. Colonies of freshwater bryozoans are composed of identical zooids, each with a ciliated tentacular crown (the lophophore) used to generate feeding currents. Fredericella sultana colonies grow profusely in late spring and early summer and produce numerous asexual propagules (statoblasts) in the autumn (Wood and Okamura, Reference Wood and Okamura2005). Statoblasts are comprised of two chitinous valves that enclose germinal tissue. Following a period of winter dormancy and the return of favourable conditions, the statoblast valves separate and the first zooid emerges. Sexual reproduction results in larval production in summer but this is often rare or foregone (Wood, Reference Wood, Boardman, Cheetham and Oliver1973). During sporogonic development T. bryosalmonae infections periodically castrate F. sultana by greatly diminishing statoblast production, which is then resumed once sporogonic stages are released (Hartikainen and Okamura, Reference Hartikainen and Okamura2012). There is strong evidence that castration is the result of parasitic manipulation (Hartikainen and Okamura, Reference Hartikainen and Okamura2012). No significant colony mortality is associated with T. bryosalmonae infection, although growth rates of overtly infected colonies are generally reduced (Tops et al. Reference Tops, Hartikainen and Okamura2009; Hartikainen and Okamura, Reference Hartikainen and Okamura2012). Vertical transmission of T. bryosalmonae in statoblasts has not been documented (Tops, Reference Tops2004; Grabner and El-Matbouli, Reference Grabner and El-Matbouli2008).
MATERIALS AND METHODS
Infection impacts on host phenotype
Overt infections are readily observed by stereomicroscopy of transparent laboratory-cultured or dissected field-collected material and therefore enable the immediate assignment of colonies to treatments. As covert infections cause no measurable impacts on growth or reproduction (Tops et al. Reference Tops, Hartikainen and Okamura2009), we compare overtly infected colonies and those that lack overt infections, albeit the latter treatment potentially including some colonies with covert infections. For ease of reference we henceforth refer to infected and uninfected groups in the following sections apart from the one study involving vertical transmission to statoblasts and maternal effects for which it was necessary to fully characterize infection status.
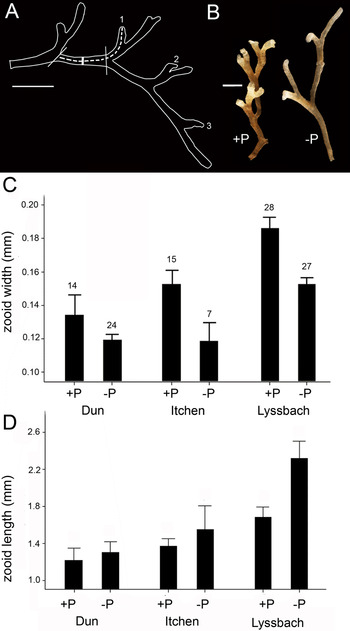
(a) Zooid dimensions: Fredericella sultana colonies were collected from three sites between 2009 and 2011 (River Itchen, Hampshire, UK; River Dun, Berkshire, UK; River Lyssbach, Canton Bern, Switzerland) in order to examine whether overt infection influences zooid dimensions. All the sites are geographically separated and likely have genetically distinct bryozoan populations. However, in all sites, the bryozoans were growing on similar substrata (submerged tree roots) thus minimizing the potential that variation in substrata influences colony shape. The Rivers Itchen and Lyssbach are shallow (<50 cm deep at collection site), clear streams with gravel bottoms surrounded by largely agricultural catchment in the areas from which bryozoans were collected. The River Dun is ∼1 m deep at the collection site with relatively slower flow but is similar to the other river sites in catchment characteristics. Up to 16 colonies were photographed at ×8 magnification using a stereomicroscope (Nikon SMZ1000) and image capture system (Nikon DS-Fi1). Colonies were chosen by targeting a range of colony sizes from different sections of tree root. Care was taken to position zooids chosen for measurement level relative to the camera and zooids with significant 3-dimensionality (e.g. curved tips) were excluded. In a previous pilot study it was determined that zooids that had not yet budded a daughter zooid tended to vary more in their dimensions than zooids with daughter zooids (presumably because the former were still in processes of growth). To determine infection status, colonies were dissected after imaging to reveal presence/absence of T. bryosalmonae sacs. All size measurements from photographs were conducted using ImageJ v1.47a (Collins, Reference Collins2007). Growth of F. sultana entails a regular dichotomous branching pattern that results when a daughter zooid buds from a maternal zooid (Fig. 1A). Zooid length and width measurements were made on all mature zooids within a branch. Zooids were deemed to be mature if a daughter zooid had been budded. Zooid length was measured as the distance between the distal tip of a zooid (where the lophophore emerges) and the proximal end adjacent to the maternal zooid (from which the zooid was budded to form a new branch) (Fig. 1A). Zooid width was measured at the midpoint between the proximal end adjacent to the maternal zooid and the distal end of the daughter zooid (i.e. where the first daughter zooid was budded from the maternal zooid) (Fig. 1A). Zooid sizes were analysed using linear mixed effects models with REML approximation in R v2.13.2 within the package lme4. ‘Infection status’ and ‘site’ were included as fixed factors and ‘zooid within colony’ was included as an explicitly nested random factor. P-values were calculated in glmt package via MCMC (Markov Chain Monte Carlo) bootstrapping 10 000 times (Baayen et al. Reference Baayen, Davidson and Bates2008). Transformations (loge(x)) were applied to ensure normal distribution of residuals and equality of variances.
Zooid morphology of infected (+P) and uninfected (−P) Fredericella sultana from three different sites. (A) Zooid length was measured along the dashed line and zooid width was measured midline from the proximal end adjacent to the maternal zooid and the distal end where the daughter zooid is budded (indicated by the thick line between the vertical marker lines). The zooids selected for measurement in this branch are numbered and only include fully mature zooids with daughter zooids present. (B) Representative infected (+P) and uninfected (−P) colony branches. (C) Zooid width and D) zooid length for infected (+P) and uninfected (−P) zooids from three sites. The error bars depict 95% confidence intervals and number above bars indicates number of zooids measured (n=same for C and D). Scale bars indicate 1 mm.

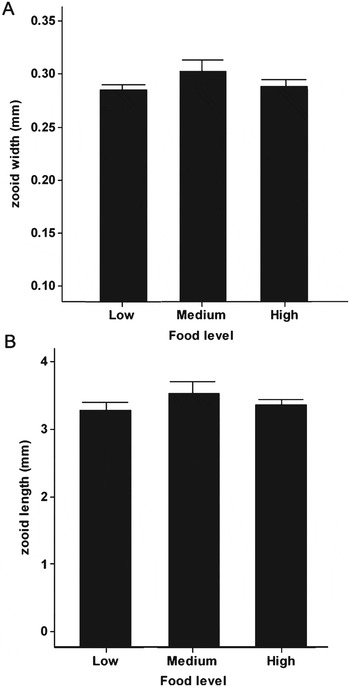
To examine whether zooid dimensions could be explained by resource limitation due to competition with parasites, zooid dimensions were characterized in uninfected colonies whose growth was followed in a previous study (material originally from the River Cerne, Dorset, UK) at three different food levels (effected by low, moderate and high nutrient levels) (Hartikainen et al. Reference Hartikainen, Johnes, Moncrieff and Okamura2009). At the termination of the study, colonies were photographed and zooid sizes were measured in a single zooid from 37, 19 and 24 colonies that had grown in high, medium and low nutrient levels, respectively. Zooid selection and methods for measurement were as above. Zooid widths and lengths were compared with respect to food level using a one-way ANOVA followed by Tukey's pair-wise comparisons.
(b) Statoblast dimensions: Statoblasts were collected from infected and uninfected F. sultana to examine whether overt infection influences statoblast dimensions. The material originated from the River Cerne and was used for the growth experiments in Hartikainen and Okamura (Reference Hartikainen and Okamura2012). Infection status was determined by observation of sac development in culture (Hartikainen and Okamura, Reference Hartikainen and Okamura2012). Uncoated statoblasts were mounted on stubs in a flat position to enable valve measurement using scanning electron microscopy (LEO 1450 VP). Lengths (L) and widths (W) of statoblasts were measured as the longest and widest dimensions of the valve of one statoblast collected from each of 10 infected and 10 uninfected colonies (measurements taken only on dry statoblast). Statoblast sizes were calculated by assuming constant thickness and approximating statoblast area as a rectangle with rounded corners as follows:
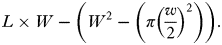 $$L \times W - \left( {W^2 - \left( {\pi \left( {\displaystyle{w \over 2}} \right)^2} \right)} \right).$$
The statoblast dimensions were analysed using one-way ANOVAs after loge transformation of data.
(c) Metabolism: We measured oxygen consumption rates of infected and uninfected colonies of F. sultana to determine if infection influences metabolic rate or scaling relationships. Branches of F. sultana (originating from the River Cerne, Dorset, collected in May 2006) were allowed to attach to small plastic disks (5·4 cm diameter) and moved to laboratory culture systems for 4 months prior to use in this experiment. Each colony was measured only once and the colony size (number of live zooids), presence of mature, chitinized statoblasts and overt infection status were recorded prior to measurement. Colonies were classified to three groups: infected, uninfected and uninfected, statoblast producing. The latter was defined as colonies possessing at least one statoblast. Prior to the respiration measurements, the experimental colonies were gently cleaned with forceps by removing any large detritus or other organisms attached to the colonies. The disk around the bryozoan was wiped clean using a soft tissue, the colonies were placed in autoclaved artificial pond water (Wood, Reference Wood1996) in Petri dishes and allowed to acclimatize to no food conditions for 30 min. The oxygen consumption of each colony was measured using Fibox 3 equipment (PreSens GmbH) in sealed vessels (5·5 cm wide, 1·5 cm high round Petri dish) filled with air-saturated, autoclaved artificial pond water at the same temperature as the laboratory culture systems (20 °C). A control sealed vessel was also included during experiments and was identical apart from lacking bryozoan material. Respiration measurements were completed before the oxygen tension in the experimental vessels fell below 80% of starting values. The strength of the linear relationship in oxygen depletion with time was evaluated using linear regressions and only measurements with R 2>80% were accepted for further analysis after corrections for any changes in oxygen concentration measured in the control.
The relationship between colony size and respiration rate was estimated using Standardized Major Axes regressions (SMA) in the R package smatr. The intercepts and slopes were compared using Bartlett-corrected likelihood ratio tests (elev.com and slope.com in smatr) to determine the effects of infection and statoblast production, respectively, on respiration rate (via comparisons of intercept, which indicates the respiration rate of a colony of one zooid thereby standardizing for differences in mean colony sizes amongst groups) and on metabolic scaling relationships (via comparison of slopes). Because some uninfected colonies were producing statoblasts we analysed these separately in view of the possibility that this energetically expensive activity may influence metabolism.
Infection of statoblasts and maternal effects
To assess hatching success of statoblasts produced by infected and uninfected material we created conditions to provoke statoblast production by placing F. sultana in high productivity microcosms for approximately 4 months. Mother colonies were scored as infected or uninfected and placed individually in water-filled tubes and maintained for a 9-month dormancy period at 4 °C. Statoblasts were dissected out of colonies and placed on Petri dishes containing artificial pondwater at room temperature. Each dish contained 1–82 statoblasts from a single colony and was inspected daily until >50% of the statoblasts had hatched (7 days). For three infected and uninfected mother colonies, all statoblasts were preserved individually to examine vertical transmission using PCR assays with T. bryosalmonae diagnostic primers 514F_new (5′-ATTCAGGTCCATTCGTGAGTAACAAGC-3′) and 776R (5′-CTGCCCTTAATTGGGTGTATCAGC-3′) following conditions as in Hartikainen and Okamura (Reference Hartikainen and Okamura2012) apart from using an annealing temperature of 58 °C. In the remaining colonies all the unhatched statoblasts and half of the hatched statoblasts from each mother colony were saved in 99% EtOH, the other half of hatched statoblasts being transferred to infection-free culture systems. The subsequent development of the newly hatched colonies in the culture systems was monitored by counting the numbers of live and dead zooids, the numbers of statoblasts and infection status on a weekly basis for 6 weeks. Zooids were deemed to be dead when they no longer responded to agitation by forceps. Colonies were scored as dead when no live zooids were present. On the final day of the study, live colonies were saved individually in 99% EtOH and assayed for infections by PCR. Statoblasts that failed to hatch were pooled according to their common mother colony and subjected to PCR.
RESULTS
Infection impacts on host phenotype
(a) Zooid dimensions: Infected zooids were wider than uninfected zooids in material from all three sites (Fig. 1C, P=0·004) and varied in width amongst sites (P=0·005). In contrast, zooid length was not significantly affected by infection (P=0·553) (Fig. 1D), although there was a tendency for infected zooids to be shorter, especially in the River Lyssbach. These morphological attributes gave the infected colonies a squat, bunched appearance in comparison to uninfected colonies (Fig. 1B). Food level exerted no effect on zooid widths (one-way ANOVA, F 2, 77=2·10, P=0·130) or lengths (F 2, 77=1·44, P=0·244) in uninfected colonies (Fig. 2) despite the strong effects of food level treatment on colony growth rates demonstrated by Hartikainen et al. (Reference Hartikainen, Johnes, Moncrieff and Okamura2009).
Morphology and food experiment: (A) zooid length and (B) zooid width in uninfected Fredericella sultana measured in three food levels. Material originated from the River Cerne.

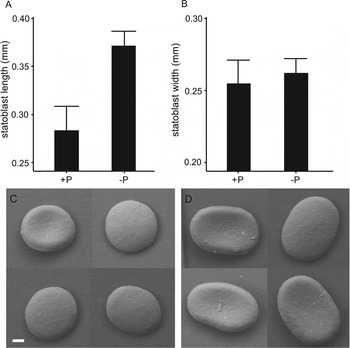
(b) Statoblast dimensions: Statoblasts produced by infected colonies were shorter (one-way ANOVA, F 1=45·87, P<0·001) but retained a similar width (ANOVA, F 1=0·81, P=0·381) to those produced by uninfected colonies (Fig. 3A, B). Statoblasts of infected colonies thus appeared rounder and lacked the characteristic oblong shape (Fig. 3C and D). The conservative assumption of constant statoblast thickness regardless of infection leads to the inference that infected colonies produce statoblasts of smaller volume (d.f.=1, F 1=64·9, P<0·001).
Statoblast morphology in infected (+P) and uninfected (−P) F. sultana of colonies originating from the River Cerne. (A) Statoblast length (the longer statoblast dimension), n=10 and (B) statoblast width (the shorter statoblast dimension), n=10, measured from SEM images. The error bars depict 95% confidence limits. (C) SEM images of statoblasts from infected and (D) uninfected bryozoans. Scale bar=40 μm.

Effects of infection on metabolism
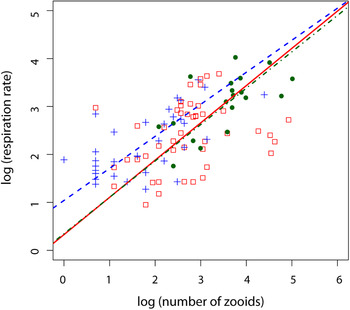
Scaling of respiration rate with colony size was not significantly different between infected (b=0·78, 95% CI 0·53–1·14), uninfected (b=0·67, 95% CI 0·51–0·88) or statoblast-producing uninfected colonies (b=0·76, 95% CI 0·57–1·01) (P=0·453) (Fig. 4). When the slopes (b-values) are not significantly different (as was the case here) comparisons between groups are valid – thus we found that the intercept of uninfected, non-statoblast-producing colonies (a=0·45. 95% CI 0·29–0·62) was significantly higher than that of infected (a=0·150, 95% CI −0·13–0·43) or uninfected, statoblast-producing colonies (a=0·14, 95% CI −0·33–0·62) (P=0·01). This indicates that the metabolic rate (standardized to a colony composed of a single zooid) of uninfected colonies is higher than that of infected and statoblast-producing colonies.
Scaling of colony respiration rate with colony size in infected (open squares, solid line), uninfected (filled circles, dot/dash line) and uninfected, statoblast-producing (crosses, dashed line) colonies. The lines from standardized major axes regressions are plotted.

Infection of statoblasts and maternal effects
Tetracapsuloides bryosalmonae infections were detected in 78% of unhatched and in 44% of hatched statoblasts originating from infected mothers (n=9). The frequency of infection was not dependent on viability (Fisher's exact test, P=0·334, d.f.=2). Further, the prevalence of vertical transmission from infected mothers to statoblast offspring was not significantly different between statoblasts that hatched (37% infected, n=43) and those that failed to hatch (28% infected, n=40) (t-test, P>0·877, d.f.=2, n=83, data pooled over three colonies). Despite the detection of infections in some of the hatched offspring (see above), no covert or overt infections were detected in the 25 mature (statoblast-producing) offspring of the infected mothers at the end of the 6-week culturing period.
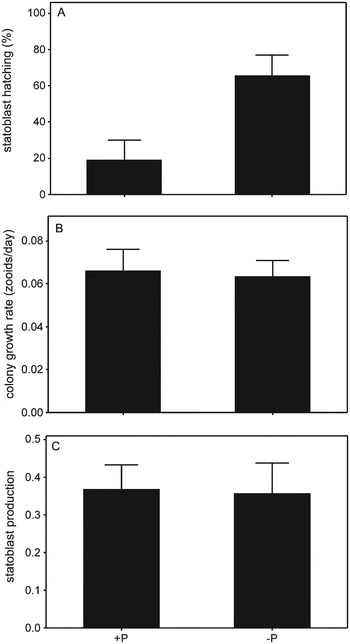
Statoblasts produced by infected colonies exhibited poor hatching success compared with statoblasts produced by uninfected colonies (P MCMC<0·001) (Fig. 5A). Colony mortality rates (G-test, d.f.=1, G=3·06, P>0·05, data not shown), colony growth rate (P=0·568, Fig. 5B), zooid mortality rates (P=0·569, data not shown) and statoblast production rates (P=0·204, Fig. 5C) of colonies originating from statoblasts produced by infected and uninfected colonies were not significantly different.
(A) Hatching success of statoblasts, (B) subsequent colony growth rate and (C) subsequent colony statoblast production of the statoblast generation from infected (+P) and uninfected (−P) Fredericella sultana colonies.

DISCUSSION
Drivers of infected phenotypes
Parasitic manipulation is increasingly recognized to affect many aspects of host life history, physiology and food web interactions. Such manipulation is typically associated with distinct infected phenotypes that can be linked to fitness benefits for parasites. However, infected phenotypes may also arise as a consequence of host defence or as a by-product of the host–parasite interaction. We found that T. bryosalmonae infection in F. sultana is associated with several significant changes in host phenotype. Below we examine what may ultimately explain these observed changes.
(a) Zooid dimensions: Overtly infected colonies produce larger zooids that are wider but of a similar length to zooids produced in uninfected colonies and which collectively make infected colonies squat in appearance. If this squat colony morphology was due to slow, stunted growth resulting from insufficient resources, we would expect to see squat colonies also developing in low food treatments where colonies exhibited reduced growth rates (Hartikainen and Okamura, Reference Hartikainen and Okamura2012). However, we found that zooid lengths and widths in uninfected colonies are not significantly affected by food level. Our demonstration that the squat phenotype was expressed in infected colonies collected from several, geographically separated sites that were likely inhabited by genetically differentiated bryozoan populations provides a further indication that the altered phenotype is strictly parasite-associated.
We suggest that this change in host phenotype most likely reflects parasitic manipulation of host morphology and resource allocation in order to increase horizontal transmission rates. Tetracapsuloides bryosalmonae forms spherical sacs that contain thousands of spores that are released into the water column upon maturation. The largest sacs that we have recorded in F. sultana (770 μm in diameter; Hartikainen, personal observation) would just be accommodated at the widest regions between budding zooids. Wider zooids in infected colonies therefore provide more space for the growth of larger spherical sacs. Because the volume of a sphere increases exponentially, a large spherical sac will contain substantially greater numbers of infectious spores than smaller spherical sacs that collectively span the same diameter. Increased zooid widths may also enhance the movement of developing sacs within the coelomic fluid which is circulated by host cilia that line the body cavity. Such free-floating sacs may benefit from an increased nutrient supply relative to that available to sacs developing in a more restricted space. These considerations suggest that overt infections of T. bryosalmonae induce a subtle form of gigantism at the zooid level. Further, the reduced colony growth and small colony sizes associated with overt infections demonstrate that gigantism does not pertain to the colony level.
(b) Statoblast dimensions: Our previous research has shown that T. bryosalmonae exerts a castrating effect on bryozoan hosts since infected colonies produce few statoblasts (Hartikainen and Okamura, Reference Hartikainen and Okamura2012). Here we show that those statoblasts that are produced are largely misshapen, with valves that were nearly circular in dimensions and are smaller than statoblasts produced by uninfected colonies. This shape change may relate to changes in zooid shapes if statoblast dimensions are determined directly or indirectly by the dimensions of the parent zooid, as also suggested by Toriumi (Reference Toriumi1951). Furthermore, a large proportion of the statoblasts produced by infected colonies failed to hatch. This decreased viability may be caused by insufficient vitelligenic material to support statoblast germination as a result of their overall smaller size. It is possible that statoblasts were produced after infection had abated in certain regions of colonies allowing energy to be allocated to statoblast production instead of parasite maintenance in those regions. Nevertheless, it is clear that overt infections effect a marked reduction in the fitness of the bryozoan hosts. Observations of statoblast development once spores are released and overt infections are lost (Hartikainen and Okamura, Reference Hartikainen and Okamura2012) demonstrate that this fitness effect is transient in colonial hosts.
It is possible that changes in statoblast size and dimensions are driven by bryozoan hosts, for instance to limit transmission of parasites. However, it is difficult to perceive how such changes would limit transmission as very few of the misshapen statoblasts were viable. Nor is it likely that statoblast phenotypes reflect parasite manipulation to increase transmission since none of the surviving offspring from infected mothers carried infections to maturity. This statoblast phenotype may thus simply be a by-product of a parasite that manipulates host dimensions – either directly or in combination with processes that divert resources away from propagule production and growth. It is notable that the host appears to be unable to effect fine-tuning of resource allocation in order to produce very few but consistently viable propagules of normal dimensions. Nevertheless, the viability of some misshapen and initially infected statoblasts and the subsequent loss of infection after 6 weeks in our culture systems may indicate that bryozoans allocate resources to propagule production despite the costs of producing many that are inviable (see section on ‘Infection of statoblasts and maternal effects’).
(c) Metabolism: Our results demonstrate the importance of state-dependent effects on metabolism in colonial animals. Thus, we found similar metabolic rates for colonies with overt infection and for colonies producing statoblasts, however, these rates were lower than those of uninfected colonies. The greater respiration of uninfected colonies may be explained if they were in the process of active growth while those producing statoblasts and sustaining infections were not. These results support the resource limitation hypothesis in driving this aspect of the host parasite–interaction. From this viewpoint, the parasite sequesters a large proportion of host resources, thus reducing the colony growth rate, which is reflected in a lower colony level oxygen demand. These results also imply that trade-offs between colony growth and statoblast production are important determinants of bryozoan life history, and it is not surprising that the parasite exploits and manipulates this particular aspect of the host's biology.
In summary, our results provide strong evidence for parasite manipulation that involves host castration in conjunction with alteration of host morphology (zooid dimensions) to potentially increase horizontal transmission to fish hosts. We also provide evidence for two by-products of host manipulation: altered statoblast dimensions and reduced metabolism. A particularly unique aspect of this colonial host–endoparasite system is the periodic invocation of infected phenotypes as T. bryosalmonae undergoes developmental cycling between covert and overt infections dependent on host condition (McGurk et al. Reference McGurk, Morris, Auchinachie and Adams2006; Tops et al. Reference Tops, Hartikainen and Okamura2009). Such a complex system may, for instance, enable F. sultana to invest in the apparently costly production of poor quality statoblasts. Thus, when host quality diminishes, T. bryosalmonae infections will recede to covert stages that exert little energetic demands on hosts (Tops et al. Reference Tops, Hartikainen and Okamura2009) and thereby allow the host to recover and resume colonial growth. Whether infections of statoblasts in covertly infected hosts is also possible remains to be determined. The examination of multiple infected phenotypes and their potential drivers brings us closer to a more complete picture of host–parasite interactions in this complex system and suggests that covert infection may be a common and central strategy employed by these and other microbial endoparasites.
Maternal effects
We had mixed evidence for transgenerational effects of infection. Thus, statoblasts produced by overtly infected colonies had much reduced hatching success. This is likely to be a result of their smaller size and hence lower levels of vitelligenic reserves to support early stages of colony growth. However, when statoblasts did hatch, colony growth rates and statoblast production were indistinguishable from the offspring of uninfected colonies. PCR confirmed that following growth in culture systems the offspring of overtly infected mothers were not infected. However, infections were found in a proportion of the pooled statoblasts just after hatching. This indicates that infections were either lost during offspring growth or that the infected offspring suffered selective mortality during early growth. Thus our results demonstrate that under benign laboratory conditions those few viable offspring that are produced by infected colonies do not exhibit a subsequent reduction in fitness as a legacy of maternal infection. However, overt infections are associated with a profound reduction in host offspring viability as well as a temporary but severe reduction in statoblast production.
Practical implications
A constraint in examining host–parasite interactions involving T. bryosalmonae has been the ability to obtain sufficient parasite material for genomic and transcriptomic investigation because sediment incorporated into colony walls generally renders them opaque. The detection of overt infections thus necessitates culturing in laboratory microcosms (where sediment particles are absent and colonies are therefore transparent) or labour-intensive dissection of live, field-collected material. The morphology of infected phenotypes therefore has practical implications. Targeted collection of stunted colonies in the field should facilitate obtaining infected material that can then be dissected or maintained in culture to maximize harvesting of T. bryosalmonae stages.
A further practical implication of our study is the demonstration that infection can result in misshapen statoblasts. Because statoblast features, including dimensions, are important in species discrimination (Wood and Okamura, Reference Wood and Okamura2005), infected statoblast phenotypes may occasionally compromise species identification. It is possible that round statoblasts produced in infected F. sultana colonies could result occasionally in material being misidentified as Fredericella australiensis Goddard 1909, which produces similar round statoblasts (Rogick, Reference Rogick1945). However, karyotypic studies suggest that F. australiensis and F. sultana are different species (Backus and Wood, Reference Backus and Wood1981).
CONCLUSIONS
Investigations of parasite-induced phenotypic changes tend to focus on single affected traits and are usually connected to enhancement of trophic transmission. Our examination of multiple characters of infected phenotypes and their potential drivers enables a more complete picture of this complex system involving a colonial host and an endoparasite that undergoes developmental cycling and does not rely on trophic transmission. It is notable that T. bryosalmonae induces a subtle form of gigantism at the zooid level in its colonial host, where infected zooids increase in size in a way that should enable increased transmission and which makes colonies stunted in overall appearance. As is often the case for unitary animal hosts (e.g. snails; Lafferty and Kuris, Reference Lafferty and Kuris2009), this gigantism is associated with host castration although it is notable that for colonial hosts this castration is temporary. A practical spin-off of this parasite-mediated alteration in host phenotype is that the stunted appearance of infected bryozoans may facilitate the selective collection of infected colonies for genomic and transcriptomic studies and for transmission trials. Our results also provide the first comparative data on state-dependent effects on metabolic rates and scaling of infected and uninfected animal colonies and suggest trade-offs between growth and reproduction as possible non-adaptive outcomes that explain the reduced metabolic rates in infected colonial hosts.
ACKNOWLEDGEMENTS
We thank landowners for access to sites for collection and are grateful for the helpful comments of three reviewers which have enabled us to clarify various aspects of our manuscript.
FINANCIAL SUPPORT
Financial support was provided by Marie Curie Fellowship to HH and the Natural History Museum Special Funds to BO and HH.