Telomeres are repetitive DNA sequences located at the ends of chromosomes, serving to stabilise and prevent the chromosomes from deterioration(Reference Goronzy, Fujii and Weyand1). Telomeres are naturally shortened in the process of cell division because DNA polymerase fails to fully replicate telomeres(Reference Levy, Allsopp and Futcher2). Excessive shortening of telomeres can inhibit cell division, potentiating cellular senescence or apoptosis(Reference Blasco3). Telomere length (TL) is therefore considered as a reliable biomarker of biological ageing and age-related diseases(Reference Vaiserman and Krasnienkov4). Shorter TL is associated with an elevated risk of CVD(Reference Xu, Wang and Su5,Reference Haycock, Heydon and Kaptoge6) , diabetes mellitus(Reference He, Cao and Fu7), cancer(Reference Zhu, Han and Xue8), dementia(Reference Forero, Gonzalez-Giraldo and Lopez-Quintero9,Reference Liu, Xiang and Pilling10) and all-cause mortality(Reference Wang, Zhan and Pedersen11).
Previous studies have demonstrated that the rate of telomere shortening is influenced by oxidative stress and inflammation(Reference Freitas-Simoes, Ros and Sala-Vila12,Reference Zhang, Rane and Dai13) , with dietary factors that affect these oxidative and inflammatory responses being primary mechanisms contributing to TL(Reference Giugliano, Ceriello and Esposito14,Reference Galie, Canudas and Muralidharan15) . Although most studies suggest that the Mediterranean diet has favourable effects on slowing the rate of telomere attrition(Reference Galie, Canudas and Muralidharan15,Reference Canudas, Becerra-Tomas and Hernandez-Alonso16) , promoting Mediterranean diet among populations in other countries is challenging due to the differences in regional dietary cultures, as well as economic viability and sustainability. Human studies have indicated that lipid and fatty acid metabolism was associated with telomere shortening(Reference Zierer, Kastenmuller and Suhre17–Reference van der Spek, Broer and Draisma19), while evidence from animal models showed that high-fat diets led to telomere shortening(Reference Antonini, Kodali and Meighan20). Conversely, a low-fat diet (LFD) restricts total fat intake to reduce caloric consumption and lower the risk of chronic diseases(Reference Prentice, Aragaki and Howard21). The reduction of total fat and saturated fatty acids resulted in a substantial decline in the total and low-density lipoprotein cholesterol levels(Reference Briggs, Petersen and Kris-Etherton22). Numerous studies have identified inverse associations between LFD and the risk of breast(Reference Prentice, Caan and Chlebowski23), pancreatic(Reference Jiao, Chen and White24) and skin(Reference Black, Thornby and Wolf25) cancers. LFD was also associated with lower breast cancer mortality(Reference Hutchinson26). However, defining LFD solely by total fat may not accurately reflect real-world eating habits. To address this limitation, Shan Z et al. developed a novel LFD score based on the percentage of energy derived from fats, carbohydrates and proteins, with higher scores indicating greater LFD adherence(Reference Shan, Guo and Hu27). Healthful LFD (hLFD) and unhealthful LFD (uLFD) dietary patterns were further derived based on the quality and dietary sources of the macronutrients(Reference Shan, Guo and Hu27).
To the best of our knowledge, no epidemiological study has yet examined the association between these three LFD scores and TL. We hypothesised that the overall LFD, particularly the hLFD, may be associated with longer TLs, whereas uLFD may be linked to shorter TLs. To test this hypothesis, we used data from the USA. National Health and Nutrition Examination Survey (NHANES) to evaluate the relationship between LFDs and TL, as well as the potential non-linear relationships between them.
Materials and methods
Study population
The present study used data from the NHANES, a continuous cross-sectional, nationwide survey, conducted by the National Center for Health Statistics to assess the nutritional and health status of civilians in the USA. All data are publicly available, and further details regarding NHANES can be found on its official website: https://www.cdc.gov/nchs/nhanes/index.html. The study protocol was approved by the Institutional Review Board (Protocol #98-12), and each participant provided written informed consent prior to participation.
Measurement of leukocyte TL was performed only in the NHANES 1999–2002 cycles. Participants aged 20 years and older were asked to provide DNA samples purified from whole blood. The telomere data became publicly available in November 2014, and a quality control review was conducted prior to linking the telomere data to the public-use data files by the Centers for Disease Control and Prevention(Reference Zota, Needham and Blackburn28). The present study included the data from the NHANES 1999–2002 cycles. A total of 7826 participants provided valid DNA samples. Participants with missing dietary data (n 322) or those reporting very low (< 600 kcal/d for women and < 800 kcal/d for men, n 178) or very high (> 3500 kcal/d for women and > 4200 kcal/d for men, n 345) energy intake were excluded. Finally, a total of 6981 participants were included in the analysis.
Measurement of dietary intake
In the NHANES, dietary information was collected by trained interviewers through a single 24-h dietary recall from 1999 to 2001 and collected twice (i.e., two 24-h recalls) since 2002, in which the first recall was administered in person in the Mobile Examination Center, and the second recall was conducted by telephone 3–10 d later. The NHANES employed a computer-assisted dietary interview system to guide interviewers in documenting food-related information during the dietary data collection periods of 1999–2000 and 2001. Since 2002, the automated multiple pass method was used to enhance the comprehensiveness and accuracy of data collection while minimising the burden on respondents.
Assessment of dietary patterns
We calculated the LFD scores following previously reported criteria(Reference Shan, Guo and Hu27). Briefly, the participants were divided into eleven strata based on the percentage of the energy gained from macronutrients like fat, carbohydrates and protein consumption. For fat, ten points were assigned to the participants in the lowest stratum and zero points to participants in the highest stratum. The order of the strata was reversed for macronutrients such as protein and carbohydrates. Subsequently, we summarised the points for the three macronutrients to calculate LFD scores for all participants, ranging from 0 to 30. Thus, a higher LFD score indicated better adherence by the participants to the LFD pattern.
The development of overall, healthful and unhealthful LFDs was reported elsewhere(Reference Shan, Guo and Hu27). Participants were divided into eleven sex-specific strata by the percentage of energy from fat, carbohydrate and protein. Participants in the highest stratum of carbohydrate and protein intake were assigned ten points, while those in the lowest stratum were assigned zero points. For fat, participants in the highest stratum were given 0 points, and those in the lowest stratum were given ten points. The overall LFD score was obtained by summing up the scores of fat, carbohydrates and protein, which ranged from 0 to 30 points.
To distinguish between the quality and types of macronutrients in LFD, Shan et al. (Reference Shan, Guo and Hu27) further developed two types of LFD, healthful and unhealthful LFD, based on the types of fat (saturated fat v. unsaturated fat), food sources of carbohydrate (high-quality carbohydrate: carbohydrate from whole grains, whole fruit, legumes and non-starchy vegetables v. low-quality carbohydrate: carbohydrate from refined grains, added sugar, fruit juice, potato, other starchy vegetables and other sources) and protein (plant protein v. animal protein). We distinguished between healthful and less healthful foods according to existing knowledge of associations of the foods with type 2 diabetes, CVD and intermediate conditions (e.g., obesity, lipids and inflammation)(Reference Wang, Ouyang and Liu29–Reference Riccardi, Giosue and Calabrese33). Specifically, the healthful LFD score was calculated according to the percentages of energy from saturated fat (reverse scoring), high-quality carbohydrate (positive scoring) and plant protein (positive scoring), whereas unhealthful LFD score was calculated according to the percentages of energy from unsaturated fat (reverse scoring), low-quality carbohydrate (positive scoring) and animal protein (positive scoring) (online Supplementary Table 1).
We used the Healthy Eating Index-2020 (HEI-2020) to better connect our results to recognised measures of overall diet quality. The HEI-2020 score, ranging from 0 to 100 points, was developed to assess adherence to the 2020–2025 USA Dietary Guidelines for Americans. It comprises thirteen components, each scored based on energy-adjusted food and nutrient intakes(Reference Shams-White, Pannucci and Lerman34). A higher score indicates greater adherence to the dietary guidelines for Americans. The food components and scoring standards of the HEI-2020 scores were presented in online Supplementary Table 2.
Measurement of telomere length
TL was measured using the quantitative polymerase chain reaction method relative to a standard reference DNA and is presented as the mean of telomere to standard (T/S) ratio, as described in detail elsewhere(Reference Cawthon35,Reference Needham, Adler and Gregorich36) . The TL assay was performed in the laboratory of Dr. Elizabeth Blackburn at the University of California, San Francisco. Whole blood DNA was purified using the Puregene kit protocol (Gentra Systems, Inc., Minneapolis, Minnesota). Each sample was assayed three times on three different days. Sample plates were assayed in groups of three plates, and no two plates were grouped together more than once. Each assay plate contained ninety-six control wells with eight control DNA samples. Assay runs with eight or more invalid control wells were excluded from further analysis (less than 1 % of runs). Control DNA values were used to normalise between-run variability. Runs with more than four control DNA values falling outside 2·5 sd from the mean for all assay runs were excluded from further analysis. Any potential outliers were identified and excluded from the calculations (less than 2 % of samples). The interassay coefficient of variation was 6·5 %.
Socio-demographic and lifestyle covariates
Data on socio-demographic and lifestyle information were collected by trained interviewers using the Computer-Assisted Personal Interview system. The Computer-Assisted Personal Interview system features built-in consistency checks to minimise data entry errors and provides online help screens to assist interviewers in defining key questionnaire terms. BMI was calculated by dividing body weight (kg) by squared height (m2). Race/ethnicity information was used to categorise individuals as non-Hispanic white, non-Hispanic black and other races. Education was grouped into three categories: less than high school, high school or above high school. Smoking was categorised as never smokers, former smokers and current smokers, while drinking was grouped into never drinkers, former drinkers and current drinkers. Physical activity was quantified as metabolic equivalent task hours per week and categorised as < 8·3, 8·3–16·7 and > 16·7 metabolic equivalent task hours per week based on the Physical Activity Guidelines for Americans(37). Diabetes was identified in participants who met any of the following criteria: (i) a self-reported history of diabetes; (ii) a fasting glucose level of ≥ 126 mg/dl or (iii) a HbA1c level exceeding 6·5 %.
Statistical analysis
All analyses incorporated sampling weights, stratification and clustering of the complex sampling design to ensure nationally representative estimates. Data were checked for normality using descriptive analysis. Baseline characteristics, low-fat dietary scores and TL were presented as counts (n) and percentages (%) for categorical variables and as means with sd for continuous variables, where applicable. TL was naturally log-transformed. Multiple linear regression models were used to estimate the association between LFD and TL. For facilitating interpretation, β coefficients were back-transformed from log units into natural units and expressed as percentage changes and 95 % CI according to the equation [exp(β) − 1] × 100(Reference Ratjen, Morze and Enderle38). Furthermore, we also categorised TL into quintiles and treated these as ordinal variables, and ordinal logistic regression was used to evaluate the associations of LFD with TL quintiles. The percentage changes and OR were calculated and presented by each tertile category and per 1-sd increase in LFD.
To account for potential confounding, covariates were sequentially included in three separate models. Model 1 was the base model and was adjusted for age. Model 2 was further adjusted for sex, race/ethnicity, education, marital status and the ratio of family income to poverty. Model 3 was the final model and included additional adjustments for BMI, physical activity, smoking, alcohol drinking, total energy intake and diabetes. RCS was used to estimate potential non-linear associations between LFD and TL, with three knots at fixed percentiles (i.e., 10 %, 50 % and 90 %). We also conducted subgroup analyses stratified by potential confounders. Wald test was employed to examine whether the coefficient on the interaction terms (LFD × potential confounders) was statistically significant. All statistical analyses were performed using SAS (SAS Institute Inc., version 9.4). All tests were two-sided, and P ≤ 0·05 was considered statistically significant.
Results
Characteristics of participants
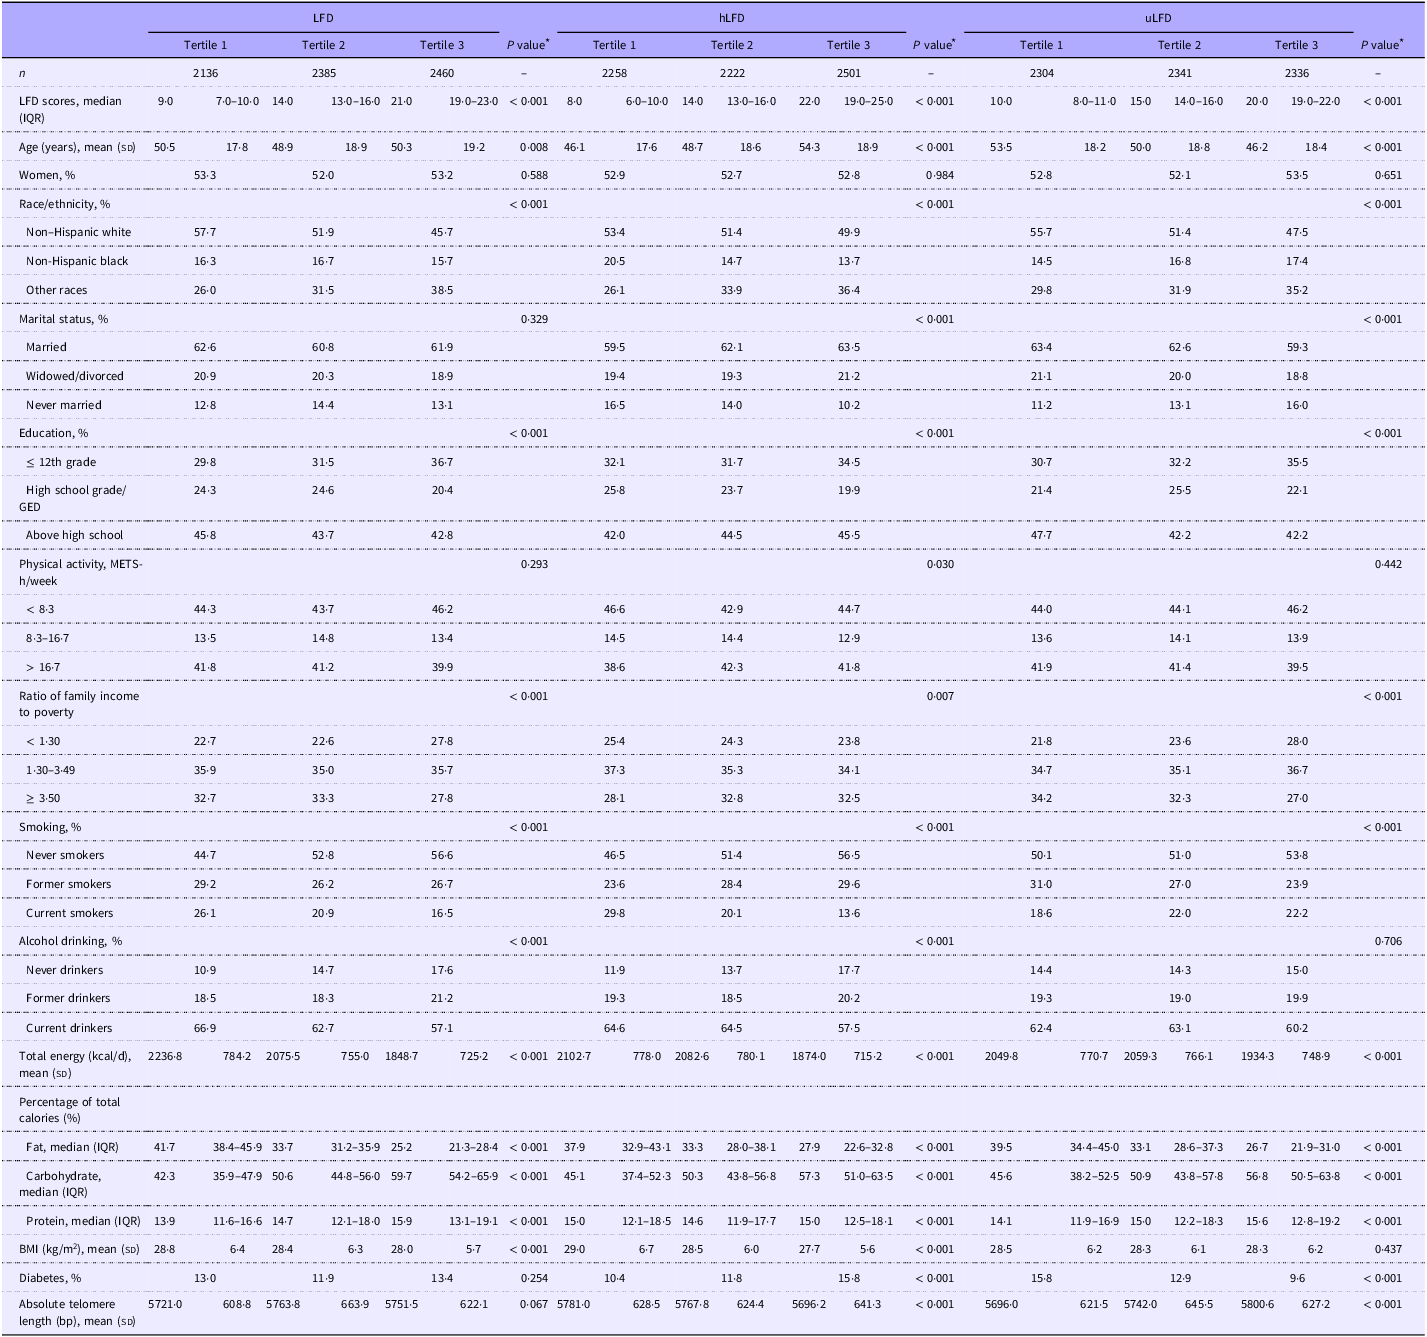
Low-fat dietary scores and TL for the participants are shown in Table 1, along with socio-demographic and lifestyle characteristics. Among the 6981 participants who aged 20–85 years (mean age, 49·9 years; sd, 18·7 years), 3295 (47·2 %) were males and 3686 (52·8 %) were females. Participants with higher hLFD scores were older, were less likely to be non-Hispanic black or married, possessed higher levels of education, had higher ratio of family income to poverty, were less likely to be current smokers and were more likely to have diabetes. Conversely, these trends were reversed in individuals with higher uLFD scores (Table 1). The total HEI-2020 score increases across higher hLFD tertiles, with values of 42·9 (35·9–50·2), 49·9 (42·3–57·7) and 57·8 (49·5–66·5), respectively. Conversely, the total HEI-2020 score decreases across higher uLFD tertiles, with corresponding scores of 52·5 (44·0–61·9), 49·7 (41·1–58·5) and 48·3 (40·1–56·7), respectively (online Supplementary Table 3).
Age-adjusted characteristics of participants according to overall LFD, hLFD and uLFD in NHANES (1999–2002) †

GED, general educational development; hLFD, healthful low-fat diet; LFD, low-fat diet; METS, Metabolic equivalent tasks; NHANES, National Health and Nutrition Examination Survey; uLFD, unhealthful low-fat diet.
† Variables were standardised according to the age distribution except for age and LFD scores. The summed proportions for certain categories did not total 100 % due to missing values or rounding.
* Statistical analyses were performed using the Kruskal–Wallis test or one-way analysis of variance for continuous data and the χ2 test for categorical data.
Low-fat diet dietary indices and telomere length
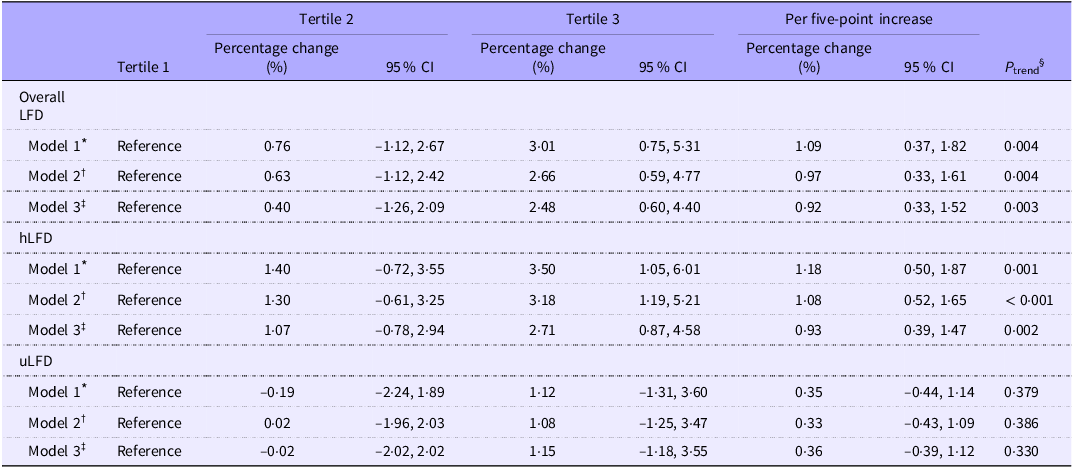
The overall LFD and hLFD were associated with TL in the linear regression analysis. As shown in Table 2 in model 3, compared with individuals with the lowest tertile overall LFD score, those with the highest tertile overall LFD score had longer telomeres (percentage change = 2·48 %, 95 % CI: 0·60 %, 4·40 %; P trend = 0·003), percentage change of per 5-point increase was 0·92 % (95 % CI: 0·33 %, 1·52 %). A higher hLFD score was also associated with longer TL (Tertile 3 v. Tertile 1: percentage change = 2·71 %, 95 % CI: 0·87 %, 4·58 %; P trend = 0·002), and the percentage change of per five-point increase was 0·93 % (95 % CI: 0·39 %, 1·47 %). However, there was no significant association between uLFD and TL in all the three models.
Linear regression analysis for the associations between overall LFD, hLFD and uLFD scores and telomere length in NHANES (1999–2002)

GED, general educational development; hLFD, healthful low-fat diet; LFD, low-fat diet; METS, metabolic equivalent tasks; NHANES, National Health and Nutrition Examination Survey; uLFD, unhealthful low-fat diet.
* Model 1 was adjusted for age (continuous, years).
† Model 2 was further adjusted for sex (male, female), race/ethnicity (non-Hispanic white, non-Hispanic black, or other races), education (< 12th grade, high school grad/GED or above high school), ratio of family income to poverty (< 1·30, 1·30–3·49 or ≥ 3·50) and marital status (married, widowed/divorced/separated or never married).
‡ Model 3 was further adjusted for physical activity (< 8·3, 8·3–16·7 or > 16·7 METS-h/week), smoking (never smokers, former smokers or current smokers), alcohol drinking (never drinkers, former drinkers or current drinkers), diabetes (no, yes), BMI (< 18·5, 18·5–24·9, 25·0–29·9, and ≥ 30·0 kg/m2) and total energy intake (kcal/d, tertile).
§ Linear trend test was performed by treating each dietary pattern score as a continuous variable in the models.
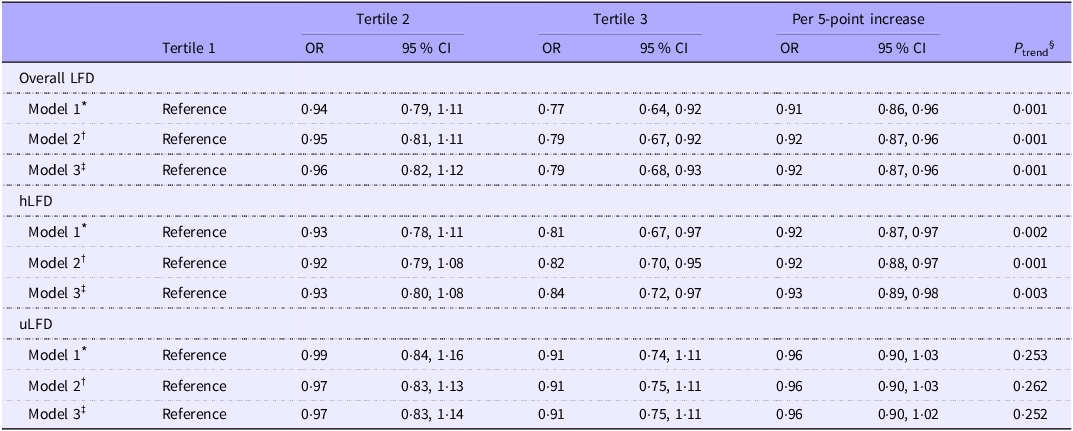
Table 3 shows the ordinal regression results of each LFD score and TL. Consistent with the results of the linear regression, both higher overall LFD (Tertile 3 v. Tertile 1: OR = 0·79, 95 % CI: 0·68, 0·93; P trend = 0·001) and hLFD (Tertile 3 v. Tertile 1: OR = 0·84, 95 % CI: 0·72, 0·97; P trend = 0·003) scores were positively associated with TL. In contrast, a higher uLFD score was not associated with TL.
Ordinal logistic regression analysis for the associations between overall LFD, hLFD and uLFD scores and telomere length quintiles in NHANES (1999–2002)

GED, General Educational Development; hLFD, healthful low-fat diet; LFD, low-fat diet; METS, metabolic equivalent tasks; NHANES, National Health and Nutrition Examination Survey; uLFD, unhealthful low-fat diet.
* Model 1 was adjusted for age (continuous, years).
† Model 2 was further adjusted for sex (male, female), race/ethnicity (non-Hispanic white, non-Hispanic black or other races), education (< 12th grade, high school grad/GED or above high school), ratio of family income to poverty (< 1·30, 1·30–3·49 or ≥ 3·50) and marital status (married, widowed/divorced/separated or never married).
‡ Model 3 was further adjusted for physical activity (< 8·3, 8·3–16·7 or > 16·7 METS-h/week), smoking (never smokers, former smokers or current smokers), alcohol drinking (never drinkers, former drinkers or current drinkers), diabetes (no, yes), BMI (< 18·5, 18·5–24·9, 25·0–29·9 and ≥ 30·0 kg/m2) and total energy intake (kcal/d, tertile).
§ Linear trend test was performed by treating each dietary pattern score as a continuous variable in the models.
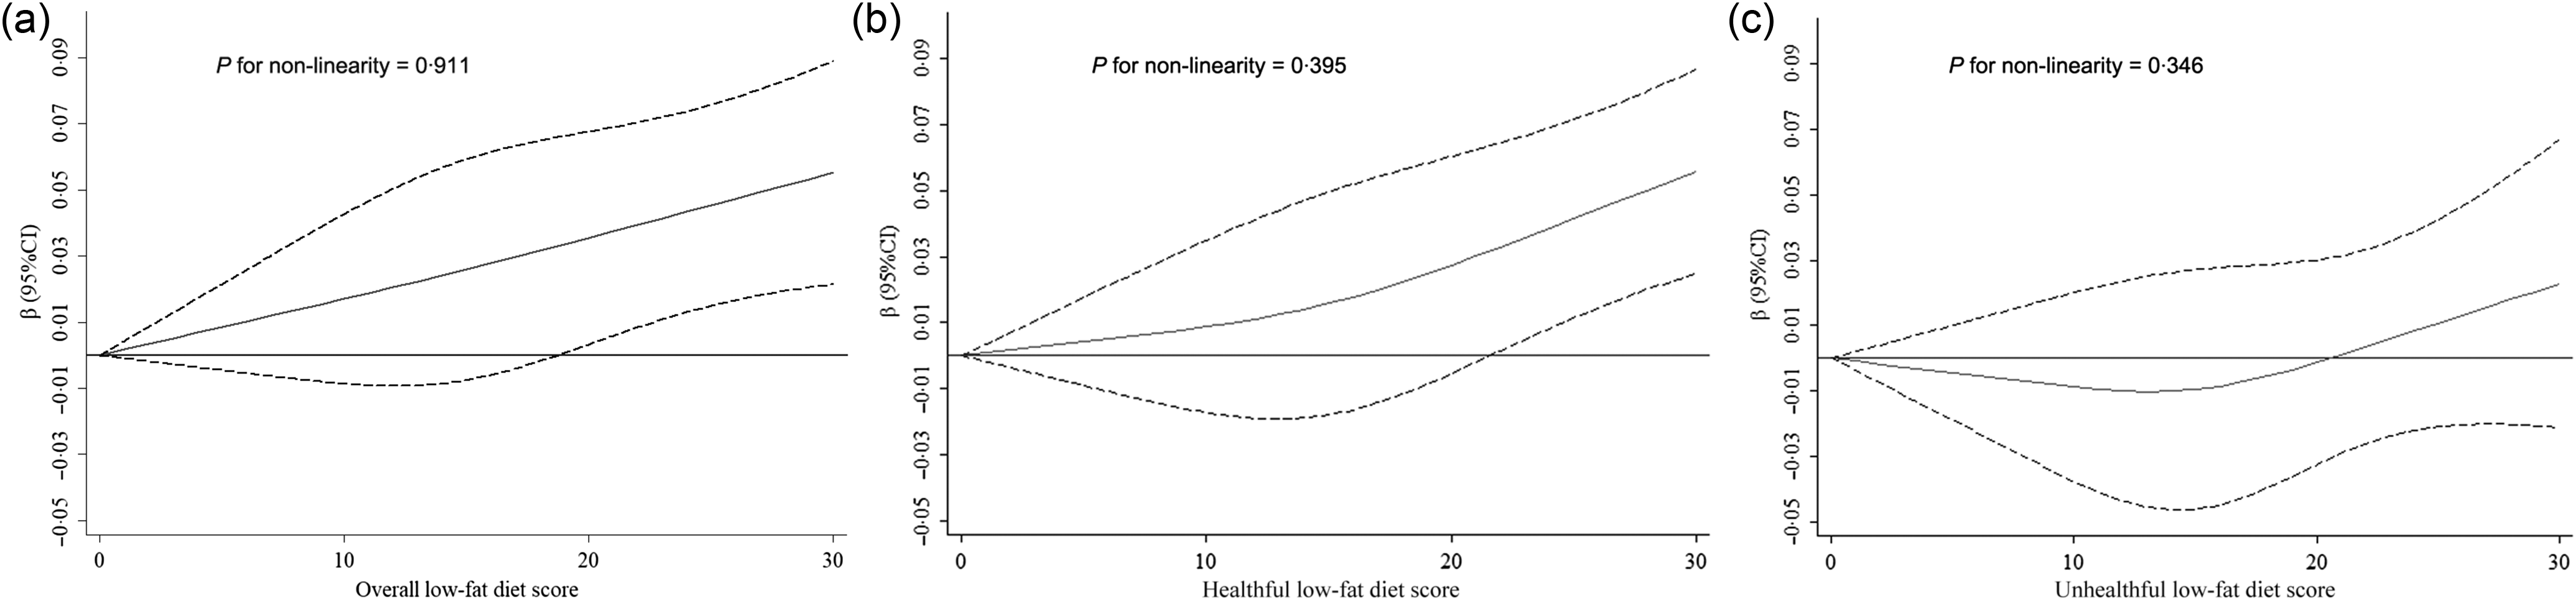
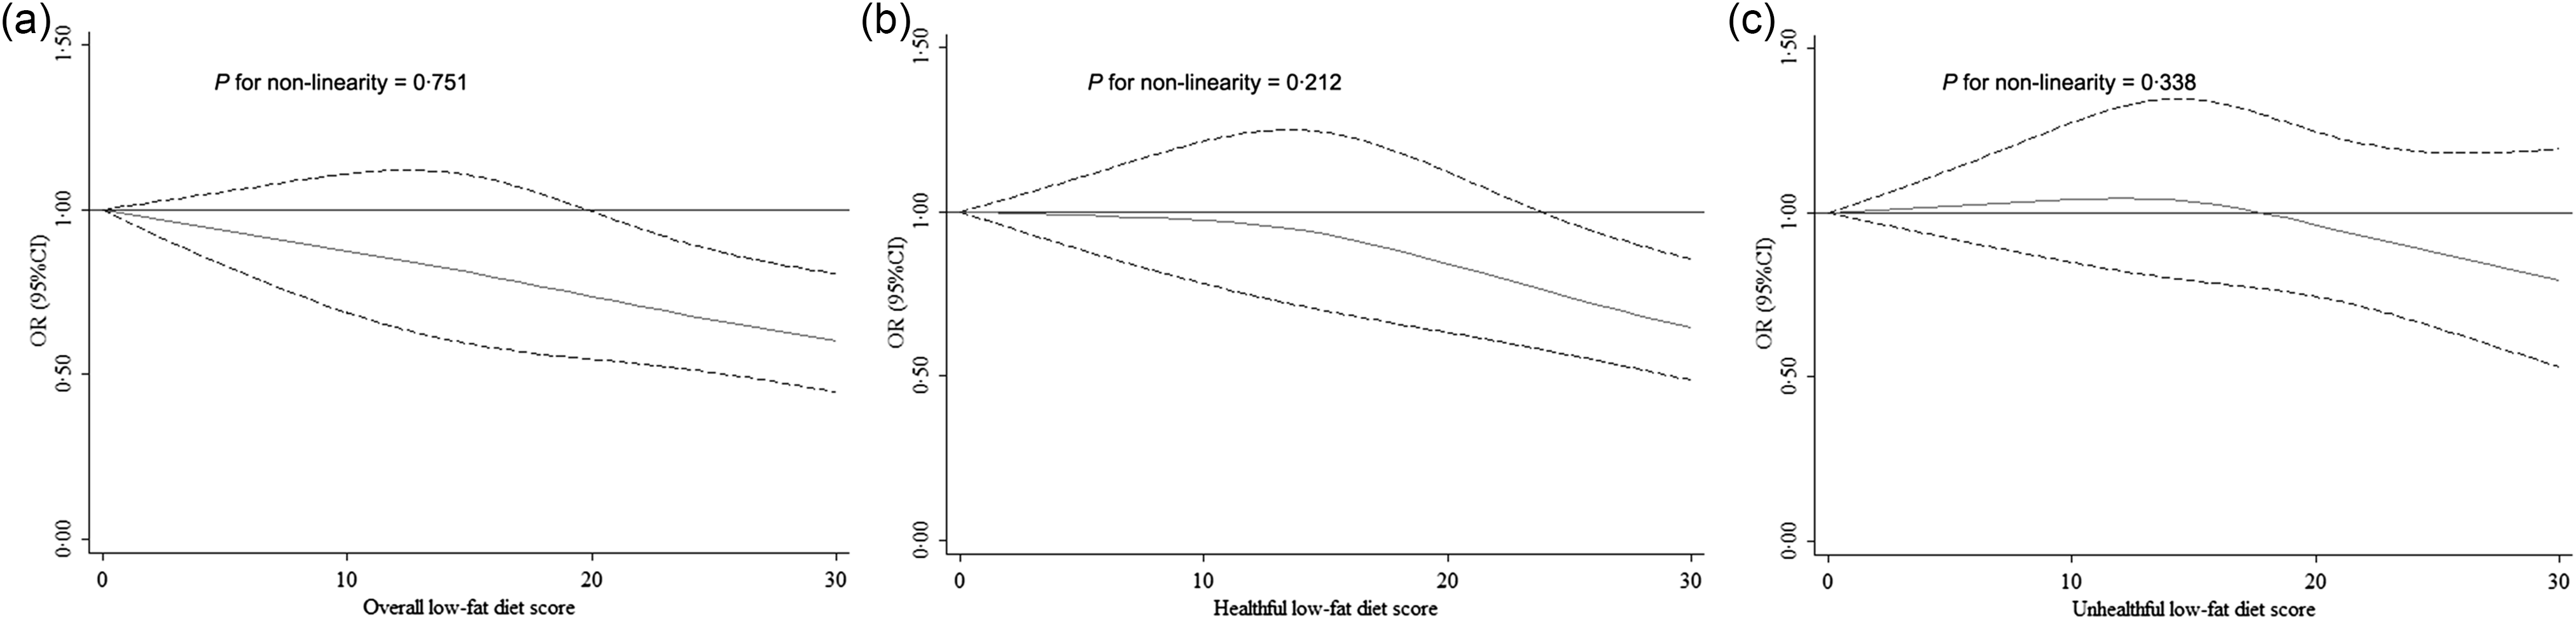
In Figure 1 and Figure 2, the restricted cubic spline models provided no evidence of a non-linear association between overall LFD, hLFD and uLFD scores and TL (all P for non-linearity > 0·05).
Spline analysis for the associations between overall LFD (a), hLFD (b), uLFD (c) and log-transformed telomere length. LFD, low-fat diet; hLFD, healthful low-fat diet; uLFD, unhealthful low-fat diet. The models were adjusted for the same covariates listed for model 3 in Table 2.

Spline analysis for the associations between LFD (a), hLFD (b), uLFD (c) and ordinal quintiles of telomere length in descending order. LFD, low-fat diet; hLFD, healthful low-fat diet; uLFD, unhealthful low-fat diet. The models were adjusted for the same covariates listed for model 3 in Table 3.

Subgroup analysis
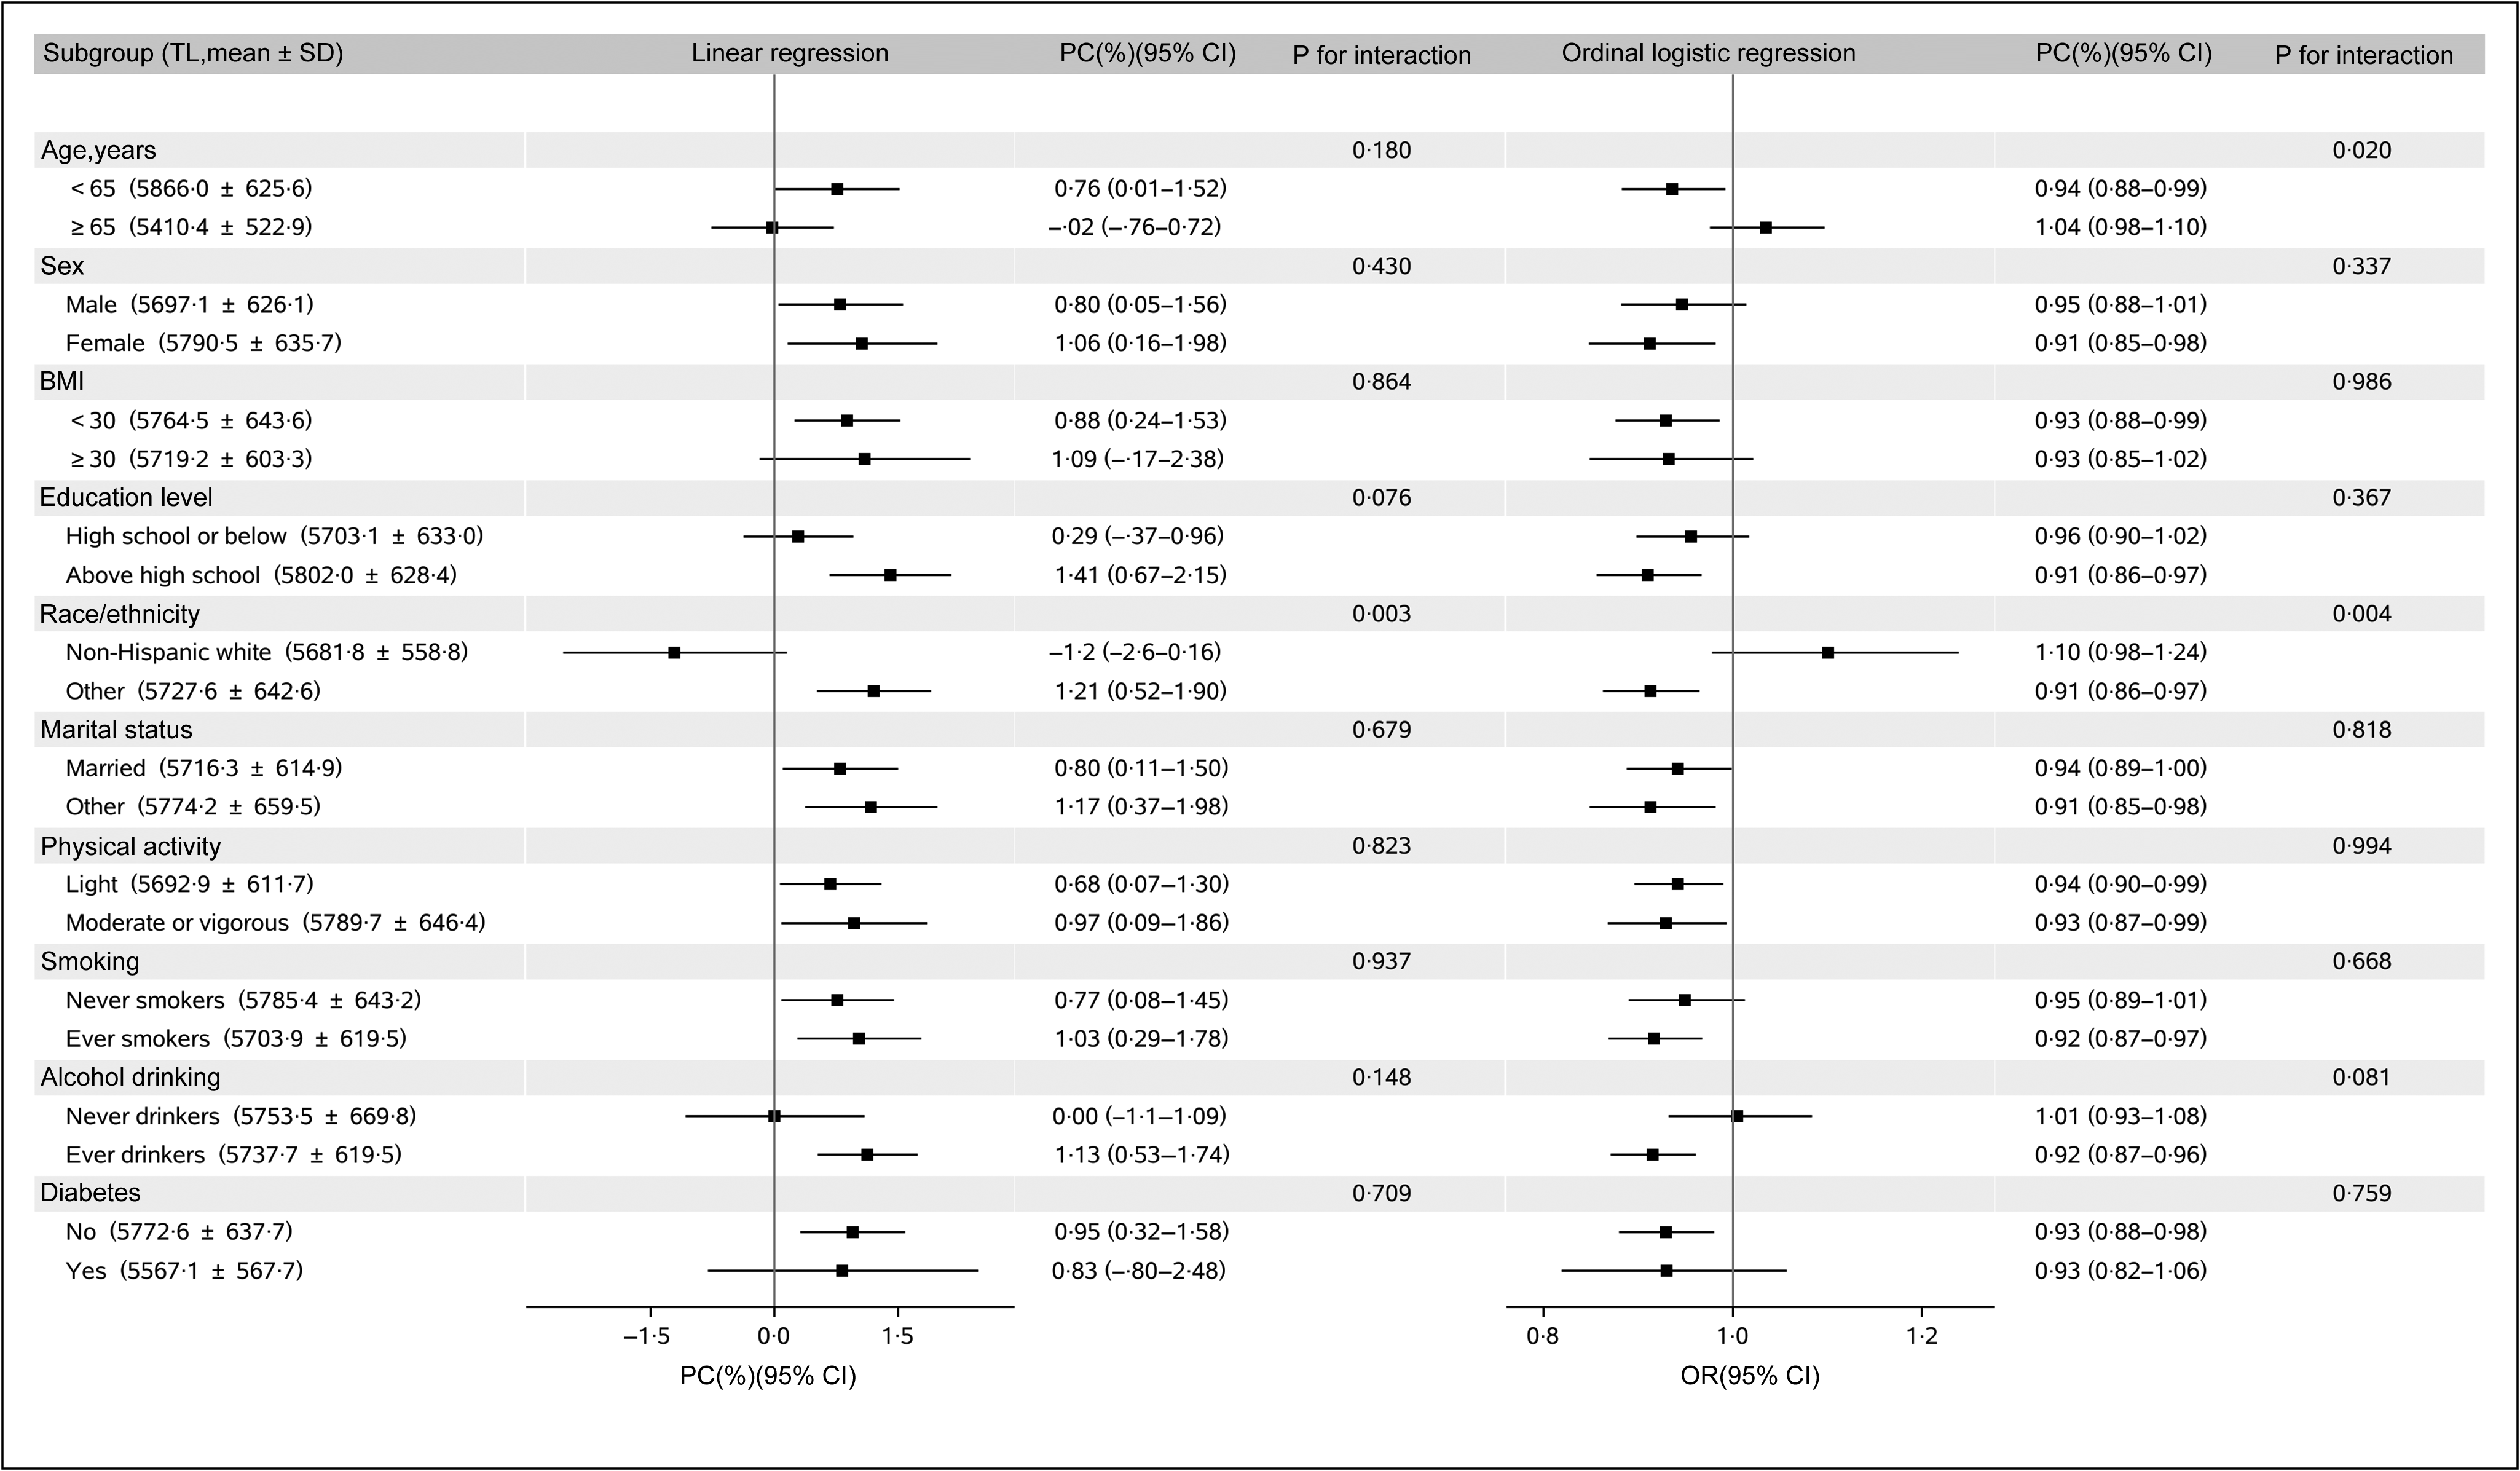
In subgroup analysis (Figure 3), we did not find any differential associations of hLFD with TL by age, sex, BMI, race/ethnicity, education level, marital status, smoking, alcohol drinking, physical activity or diabetes. However, race/ethnicity was found to modify the associations of hLFD with TL (all P values for interaction were lower than the Bonferroni-corrected significance level of 0·005). The positive association between hLFD and TL was not observed in non-Hispanic whites, but was present in other racial/ethnic groups.
Associations between healthful low-fat diet and telomere length according to subgroups. GED, general educational development; METS, metabolic equivalent tasks; PC, percentage change; TL, telomere length. Covariates adjusted in the models were age (continuous, years), sex (male, female), race/ethnicity (non-Hispanic white, non-Hispanic black or other races), education (< 12th grade, high school grad/GED or above high school), ratio of family income to poverty (< 1·30, 1·30–3·49, or ≥ 3·50), marital status (married, widowed/divorced/separated or never married), physical activity (< 8·3, 8·3–16·7, or > 16·7 METS-h/week), smoking (never smokers, former smokers or current smokers), alcohol drinking (never drinkers, former drinkers or current drinkers), diabetes (no, yes), BMI (< 18·5, 18·5–24·9, 25·0–29·9 and ≥ 30·0 kg/m2) and total energy intake (kcal/d, tertile). Light physical activity was defined as having a physical activity level of less than 8·3 METS-h per week, moderate activity was defined as participants with a physical activity of 8·3–16·7 METS-h per week and vigorous activity was defined as having a physical activity level greater than 16·7 METS-h per week.

Discussion
In this large nationwide cross-sectional study among USA adults, we found that overall LFD and hLFD were associated with longer TL, and the positive association between hLFD and TL was modified by race/ethnicity. However, uLFD characterised by high levels of saturated fat, low-quality carbohydrates and animal protein was not associated with TL. These results underscore the need to consider the quality and dietary sources of the macronutrients in the diet.
Human nutrition has been suggested to play an integral role in the ageing process(Reference Solon-Biet, Mitchell and de Cabo39). Findings from various studies indicate that a healthy diet, low stress levels, regular exercise and adequate sleep patterns are associated with longer telomeres(Reference McNaughton, Ball and Crawford40). Our study is the first epidemiological study to examine the association between LFD and TL, though few studies have investigated the association of Mediterranean diet(Reference Galie, Canudas and Muralidharan15,Reference Canudas, Becerra-Tomas and Hernandez-Alonso16) and plant-based diets(Reference Li, Li and Cheng41) with telomeres. LFD were primarily calculated based on nutrient intake, whereas the Mediterranean diet and plant-based diets were formulated according to the consumption of specific food groups. Cross-sectional studies in humans have found limited evidence of individual macronutrient associations with TL, such as fibre(Reference Tucker42) or fruits and vegetables(Reference Tucker43). However, diets consist of complex combinations of multiple nutrients and foods, and research focusing on single nutrients or foods may not fully capture the potential interactions among them.
WHO recommends that adults should limit their total fat intake to 30 % or less of their total energy consumption, and both the quantity and quality of dietary fat are crucial for maintaining good health(44). Our results also emphasise the importance of considering the quality of dietary fat when adopting a low-fat dietary pattern. In both fully adjusted linear and ordinal regression models, hLFD primarily composed of high levels of unsaturated fat, high-quality carbohydrates and plant protein, increased TL. A recent systematic review reached a similar result, suggesting that anti-inflammatory nutrients are associated with longer TL(Reference Siopis and Porter45). We further identified no association between the uLFD, characterised by saturated fatty acids, low-quality carbohydrates and animal proteins, and TL. Similar with our results on unhealthy and healthy LFD, Shan et al. (Reference Shan, Guo and Hu27) reported that healthy LFD scores were associated with lower total mortality, whereas unhealthy LFD scores were linked to higher total mortality. It is hypothesised that any lifestyle factor that slows telomere shortening may reduce mortality risk. However, the key factor lies not merely in reducing fat intake but in the overall quality of the diet. A prior study indicated that most saturated fatty acids were negatively associated with TL, whereas PUFA exhibited a positive association(Reference Dhillon, Deo and Chua46). Maintaining higher maternal levels of n-3 PUFAA during pregnancy may help preserve TL in offspring(Reference Liu, Shi and Fan47). The goal should be to adopt a comprehensive healthy eating pattern that emphasises the quality of fats and carbohydrates rather than merely targeting low-fat intake. Despite these findings, evidence from animal models has demonstrated that diets low in protein and higher in carbohydrate intake were associated with longer TL, while high-fat diets led to telomere shortening in animal model(Reference Antonini, Kodali and Meighan20).
The primary biological pathways linking fat to TL are oxidative stress and chronic inflammation(Reference Zhang, Rane and Dai13,Reference von Zglinicki48) . High total fat intake may promote adipose tissue accumulation, which can induce the production of reactive oxygen species along with increased secretion of adipokines and tumor necrosis factorα, thereby promoting chronic inflammation(Reference Tzanetakou, Katsilambros and Benetos49,Reference Maurizi, Della Guardia and Maurizi50) . The quality of fat consumed is arguably more important than the total amount, as different fats have profoundly different effects on the key pathways of oxidation and inflammation. Saturated fats can activate toll-like receptor 4, particularly in immune cells such as macrophages, triggering a signalling cascade involving nuclear factor kappa B that leads to the production and release of pro-inflammatory cytokines(Reference Lee, Sohn and Rhee51,Reference Fritsche52) . Freitas-Simoes TM et al. reported that saturated fat intake is associated with shorter TL(Reference Freitas-Simoes, Ros and Sala-Vila12). In contrast, intake of PUFA was negatively associated with leukocyte TL(Reference Dhillon, Deo and Chua46). Higher levels of n-3 fatty acids were associated with reduced pro-inflammatory cytokines, increased anti-inflammatory cytokines and decreased oxidative stress(Reference Ferrucci, Cherubini and Bandinelli53). Elevated n-3 fatty acid levels have also been associated with a reduced rate of telomere shortening(Reference Farzaneh-Far, Lin and Epel54). It has been previously proposed that consuming a healthier diet may protect against age-related telomere loss by reducing oxidative stress and inflammation(Reference Paul55). The total HEI score increases across higher hLFD tertiles, whereas it decreases across higher uLFD tertiles. This result further supports our findings and partially explains the association between higher hLFD scores and longer TL. These findings support the notion that a diet high in inflammatory foods is associated with shorter telomeres; therefore, inflammation-inducing foods should be avoided. The Dietary Guideline Index was associated with lower intakes of energy, total fat and saturated fat(Reference McNaughton, Ball and Crawford40).
Interestingly, race/ethnicity was found to modify the associations of hLFD with TL. The positive association between hLFD and TL was observed in other racial/ethnic groups, but not in non-Hispanic whites. Non-Hispanic whites may have lower levels of inflammation(Reference Dinwiddie, Zambrana and Doamekpor56) and a reduced prevalence of cardiovascular risk factors(Reference Pool, Ning and Lloyd-Jones57) compared with other racial/ethnic groups. Environmental and lifestyle factors that affect oxidative stress and inflammation may influence TL. There are limited data to relate dietary patterns with TL. TL decreases with age in humans and telomere shortening is considered one of the hallmarks of ageing(Reference Lopez-Otin, Blasco and Partridge58). Previous studies have shown that TL could be impacted by inflammation and insulin resistance(Reference Zhang, Rane and Dai13,Reference Gardner, Li and Srinivasan59) , as well as lifestyle behaviours such as dietary intake(Reference Galie, Canudas and Muralidharan15). Additionally, diets can modulate inflammation and insulin response(Reference Giugliano, Ceriello and Esposito14,Reference Huang, Li and Zhang60) . This finding may have occurred by chance. Further studies are required to validate this finding and demonstrate the underlying biological mechanisms.
The strengths of our study include the utilisation of a large, nationally representative sample of USA adults, as well as the application of LFD that differentiate between different subtypes and food sources of macronutrients. However, several potential limitations should be noted. First, the cross-sectional design of the current study limits the ability to establish causal relationships. Additionally, reverse causality is possible, as individuals with chronic diseases may exhibit both dietary differences and shorter telomeres. Second, dietary intake was assessed using a single 24-h recall, which may not accurately reflect usual consumption, although the multiple-pass method and dietary sampling weights were employed to minimise measurement error and improve estimates. Third, the present study differentiates only between the quality of fats; however, distinguishing the sources of fat consumed could provide valuable insights in future research. Fourth, the generalisability of our results to other populations is yet to be determined.
In conclusion, adherence to a healthful LFD was associated with favourable TL, whereas an unhealthful LFD had no impact on TL. These findings suggest a potential benefit in emphasising high-quality carbohydrates, unsaturated fat and plant protein in the diet for ageing, highlighting the necessity of considering the quality and types of macronutrients in future LFD research. Given the cross-sectional design of this study, cohort studies or clinical trials are warranted to validate our findings.
Supplementary material
For supplementary material/s referred to in this article, please visit https://doi.org/10.1017/S0007114525105904.
Acknowledgements
This study uses data from the NHANES. We thank the National Center for Health Statistics, the USA Centers for Disease Control and Prevention (CDC) for their financial support for data collection and analysis. We thank the study participants and staff.
This research was funded by Anhui Provincial Natural Science Foundation (grant number: 2408085MH188).
The funding agency had no role in study design, data collection and analysis, decision to publish or preparation of the manuscript.
Y. H. and Z. T. had full access to all the data in the study and took responsibility for the integrity of the data and the accuracy of the data analysis. Study concept and design: Y. H., X. L. and Z. T. Acquisition, analysis or interpretation of data: All authors. Drafting of the manuscript: Y. H. and X. L. Critical revision of the manuscript for important intellectual content: All authors. Statistical analysis: Y. H. and X. L. Obtained funding: Y. H. Administrative, technical or material support: Y. H. and H. H. Study supervision: Z. T.
The authors declare no conflicts of interest.
The study was conducted in accordance with the Declaration of Helsinki and approved by the National Center for Health Statistics Research Ethics Review Board (protocol code: #98-12).
Data described in the manuscript can be made publicly and freely available without restriction at https://www.cdc.gov/nchs/nhanes/index.html.