Introduction
The implications of an ageing population for democracy are far reaching, however, older people are often treated as a homogenous group. In this article the voter turnout levels and the attitudes towards voting amongst older people, and particularly the older old (aged 70 and above), are examined at different ages using international survey data and qualitative interviews in a case study area of the North-West of England in the United Kingdom (UK).
The key research questions are:
• How do the levels of voting amongst older people (aged 50 and older) and particularly the older old (aged 70 and older) vary in terms of age, sex, socio-economic circumstances, health, life expectancy and whether they have grandchildren?
• How do the older old view voting and what are their memories of the first time they voted?
• What barriers to voting do the older old face?
• How do the older old view voter engagement amongst younger people, including their own children and grandchildren?
Europe has an ageing population. Of the 447 million population across the European Union (EU), 21 per cent are aged 65 and older (Eurostat, 2021). Forty-nine million of the population are already aged 75 or older and, of these, 14 million are aged 85 and older. By 2050 it is estimated that the population aged between 74 and 85 will increase by 61 per cent. Women make up an increasing proportion of the older population, and amongst those aged 85 and older, the ratio of women to men is around 2 to 1. The ageing population is leading to increasing concerns about the age dependency ratio – the balance between the size of the working-age population (aged 16–64) and the non-working-age population (over 65) – and the impact this may have on society, including public finances (Eurostat, 2019, 2021).
The definition of what constitutes old age is subject to some debate (Phillipson, Reference Phillipson2013). In this article, older people are defined as those aged 50 and older and the older old are those people aged 70 and older, whereas the United Nations (UN) defines older people as those aged 60 and older (United Nations, 2019). Laslett (Reference Laslett1991) identified the value and importance of the Third Age and highlighted the negative impact of the stereotyping of older people. There are considerable variations in years of healthy living and life expectancy between and within countries, and the norms and perceptions of ageing can vary by social, political and legal context (Queniart and Charpentier, Reference Queniart and Charpentier2012; United Nations, 2019). Across Europe, the average life expectancy is 81 years: 78 years for men and 84 years for women (Eurostat, 2021). This varies from 73 years in Bulgaria to 84 years in Spain. The years of healthy living and life expectancy are associated with socio-economic deprivation and can vary considerably between areas. In some areas of the UK, the long-term increases in life expectancy have stalled, or even declined (Office for National Statistics (ONS), 2021a). Given these differences, the focus on the older old defined as those aged 70 and older is important and is a key focus of this article.
The ageing of Europe's population and the changing nature of ageing have implications for democratic elections given the higher levels of voter turnout amongst many older people compared to younger people (Goerres, Reference Goerres2009; Bhatti and Hansen, Reference Bhatti and Hansen2012a, Reference Bhatti and Hansen2012b). However, the higher level of voter turnout does not apply to all older people who often live in very different circumstances in terms of their health, wellbeing and their financial security (Calasanti and Slevin, Reference Calasanti and Slevin2001; von Humboldt et al., Reference von Humboldt, Leal, Pimenta and Maroco2014). These circumstances can continue to change in older age.
This article helps address the evidence gap in the understanding of voter turnout amongst the older old and the often-oversimplified representation of older age. Alongside the key variables linked with voter turnout, the article also examines the extent to which older people's concern for the future may be linked to their attitudes towards voting. The impact on the likelihood of voting of having grandchildren and whether the person's age had exceeded the average life expectancy for their country are also explored. There has only been limited research examining these issues alongside the complex interplay of key demographics and socio-economic circumstances in relation to the attitudes towards voting amongst the older old at different ages.
Background – voting, older people and ageing
Whilst voting in an election may seem to be a straightforward act, the likelihood of voting has been found to be associated with a range of interlinked factors including: age, sex, marital status, education qualification levels, socio-economic status, social networks, mobility, campaign intensity, previous voting behaviour, political knowledge and civic duty, as well as issues such as the weather (Pattie et al., Reference Pattie, Seyd and Whiteley2004; Denver, Reference Denver2008; Gallego, Reference Gallego2009; Nygård and Jakobsson, Reference Nygård and Jakobsson2013; Smets and van Ham, Reference Smets and van Ham2013; Nygård et al., Reference Nygård, Nyqvist, Steenbeek and Jakobsson2015; Cancela and Geys, Reference Cancela and Geys2016; Grasso, Reference Grasso2016; Hayes and Lawless, Reference Hayes and Lawless2016).
Older people are likely to have more experience of voting, they may have developed a greater knowledge of politics and have been socialised into the habit of voting. They are also more likely to have lived in the same geographic area for a longer period, and have grown older and been voting during a time when the sense of the civic duty to vote was a stronger social norm (Franklin, Reference Franklin2004; Park et al., Reference Park, Bryson, Clery, Curtice and Phillips2013). Older people may also have a different orientation to the future given the stage of their life and their experiences (Goerres, Reference Goerres2009; Inglehart, Reference Inglehart2018; Durbin et al., Reference Durbin, Barber, Brown and Mather2019). Many of the older old will have grown up at a time when access to education and welfare state provision was limited, and when many women had only recently been given the right to vote and when there were very few female politicians (Bos et al., Reference Bos, Holman, Greenlee, Oxley and Lay2020; Wolbrecht and Corder, Reference Wolbrecht and Corder2020). Although, in many democracies today there are still fewer female than male politicians (Annesley et al., Reference Annesley, Beckwith and Franceschet2019; Alexander and Jalalzai, Reference Alexander and Jalalzai2020).
Whilst a sense of civic duty may be retained and voter turnout might increase amongst retirees as they have more time and may be motivated to protect their assets, voter turnout can decline as social networks decrease (Hobbs et al., Reference Hobbs, Christakis and Fowler2014). Research by Bhatti and Hansen (Reference Bhatti and Hansen2012a) using administrative records of local elections found that voter turnout in Denmark reached 80 per cent for those aged 65 and then steadily declined as a result of increasing social isolation. General health can also be a key factor in relation to the likelihood of voting, particularly amongst older people, for example, as a result of cognitive and visual impairment and mobility issues (Schur et al., Reference Schur, Shields, Kruse and Schriner2002; Mattila et al., Reference Mattila, Soderlund, Wass and Rapeli2013). Whilst the use of the internet for political information sharing and campaigning has become much more important in the last two decades, many older people remain digitally excluded. For example, in the UK only 54 per cent of people aged over 75 are regular users of the internet and 26 per cent of people in this age group do not have access to the internet (ONS, 2021b; Ofcom, 2022).
Research by Goerres (Reference Goerres2009) has outlined four different age-related effects in relation to voting: individual ageing, lifecycle (shared changes due to ageing), political generation (shared political experiences of a group born at a certain time) and socio-economic cohort (shared general socio-economic experiences of a group born at the same time). Research in Canada (Blais et al., Reference Blais, Gidengil and Nevitte2004; Rubenson et al., Reference Rubenson, Blais, Fournier, Gidengil and Nevitte2004) and in Finland (Wass, Reference Wass2007a), which examined age, period and cohort differences in the likelihood of voting, has identified individual ageing differences, and also evidence of generational and period differences. The political participation of older people can be influenced by how ageing and older people are viewed in a particular country, including the size of the older population and its ratio to the working-age population. Moreover, research by Smets and Neundorf (Reference Smets and Neundorf2014) into voting in presidential elections in the United States of America has shown that whilst individual characteristics are important factors linked to the likelihood of voting, so are the overall levels of voter turnout.
People's attitudes and also the political party they vote for can change as they age (Alwin and Krosnick, Reference Alwin and Krosnick1991; Shorrocks, Reference Shorrocks2016; Inglehart, Reference Inglehart2018; Grasso et al., Reference Grasso, Farrall, Gray, Hay and Jennings2019). For example, people are thought to become more economically conservative and more authoritarian with age. Political party support in the UK has in recent elections been shown to be strongly associated with age, with those aged 65 and older much more likely to vote for the Conservative Party (Curtice, Reference Curtice2019). Younger generations have been shown to be more libertarian (Tilley, Reference Tilley2005; Tilley and Evans, Reference Tilley and Evans2014). For example, research across the EU has shown that younger people in general are more supportive of the EU (Down and Wilson, Reference Down and Wilson2017). However in certain countries, particularly so-called Southern debtor countries, there is less trust in the EU amongst younger people (Daniele and Geys, Reference Daniele and Geys2015; Lauterbach and De Vries, Reference Lauterbach and De Vries2020). In the 2016 UK referendum on membership of the EU, an estimated 89 per cent of people aged 65 and older reported voting compared to 64 per cent of people aged between 18 and 24 (Clery et al., Reference Clery, Curtice and Harding2017). Moreover 63 per cent of those people aged 65 and older voted to leave the EU, compared to 28 per cent of 18–24 year olds. At the same time, other factors linked with age have been shown to be important in relation to attitudes towards the EU, including education qualification level, social class and attitudes towards immigration (Ford and Goodwin, Reference Ford and Goodwin2017; Johnston et al., Reference Johnston, Manley, Pattie and Jones2018).
Whilst it has been argued that there is evidence of competing priorities and political and social tensions between different generations, the extent of this has been questioned (Willetts, Reference Willetts2010; Sternberg, Reference Sternberg2019; Wildman et al., Reference Wildman, Goulding, Moffatt, Scharf and Stenning2022). A House of Lords enquiry in the UK into what is termed ‘intergenerational unfairness’ has highlighted concerns for younger generations in relation to education, employment and housing (House of Lords, 2019). Research in the UK by the Resolution Foundation suggests that older people have the most disposable income of any generation, whilst many younger people cannot afford to rent or buy their own homes (Resolution Foundation, 2019). However, different generations are overlapping and interlinked, and they can have shared interests and can face shared challenges. Many older people live in poverty. For example, across the EU countries in 2019, 17 per cent of older people aged 65 and older were found to be at risk of poverty (Eurostat, 2020). The rate varied from 8 per cent of those people aged 65 and older in Norway to 44 per cent in Estonia and 48 per cent in Latvia.
There are also concerns that the oldest old have increasing needs and declining financial resources. In the UK, whilst many older people have been less affected by economic downturns than other age groups, an estimated 2 million pensioners live in poverty (House of Commons, 2020; Department for Work and Pensions, 2021). There are 3.3 million people aged 70 and older who live alone, 67 per cent of whom are female and many experience social detachment and loneliness (ONS, 2020). Furthermore, it is estimated that 1.5 million older people in the UK have unmet social care needs (Age UK, 2020).
Methodology
The research used a mixed-methods approach, bringing together survey data on voter turnout and evidence from interviews with the older old (aged 70 and older) in a case study area of the North-West of England in the UK.
The use of a mixed-methods approach combines the statistical strengths of quantitative data analysis with the in-depth insights gained from semi-structured interviews (Fielding, Reference Fielding2008).
Survey data and analysis
Statistical analysis was conducted on the European Social Survey (ESS) which is a cross-national representative survey carried out every two years. Wave 9 in 2018 included 29 countries and a total sample size of around 42,000 respondents (ESS, 2018). The pooled sample of those aged 50 and older (26,710 respondents) was large enough to examine the attitudes and experiences of the older old; even so, the analysis was still constrained by the limited sample size.
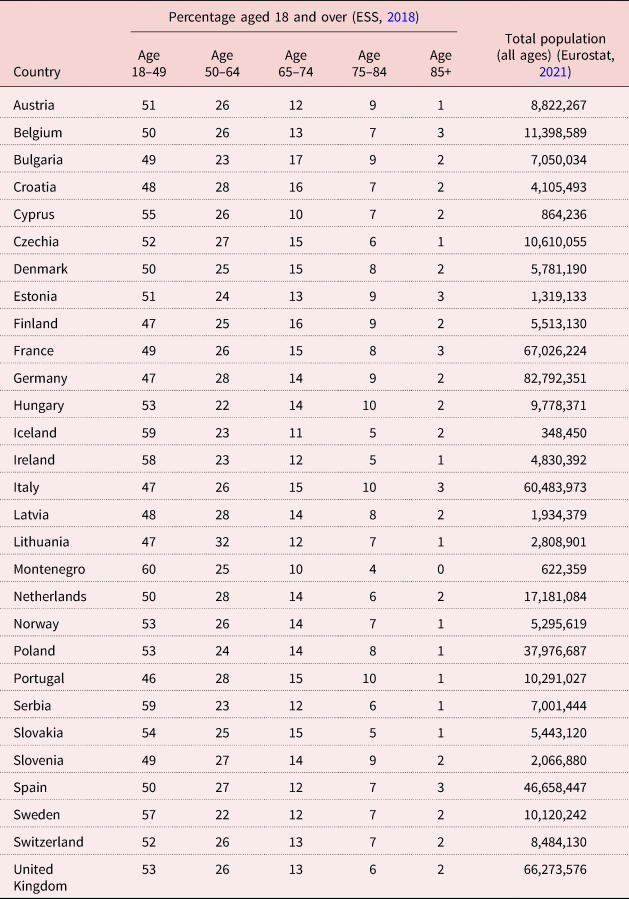
The countries in the ESS have different social and political contexts; see the Appendix for a summary of each country by age. The focus of this article is on examining the older old population across the ESS countries at a single point in time with a sample size large enough to examine voter turnout amongst the older old at different ages.
Multilevel logistic regression modelling was conducted using R to identify the different factors associated with voting. The models were specified using a multilevel structure to account for compositional differences between the samples in each country (Goldstein, Reference Goldstein2010).Footnote 1 The outcome variable was self-reported voter turnout at the last election (voted/did not vote). Those not eligible to vote, or those not responding to the question, were excluded from the analysis.
Informed by the literature discussed above, a range of variables were included such as: age, sex, health, marital status, income, education qualification level, employment status, grandchildren, social connectedness, attitudes towards political participation and internet use. In addition, a series of variables were included at the country level: the perception of how caring a country was, the extent to which elections in each country were seen as free and fair, and the age dependency ratio in each country.
The data were weighted and missing data were imputed using the mice library in R (Stuart et al., Reference Stuart, Azur, Frangakis and Leaf2009). The model outputs were combined using Rubin's rules for calculating estimates and variances (Rubin, Reference Rubin1987). In order to provide a context for the qualitative interviews in the North-West of England, a separate model of the UK was produced. A separate model was also produced for the population aged 85 and older and is referred to in the text, but it is not shown in full.
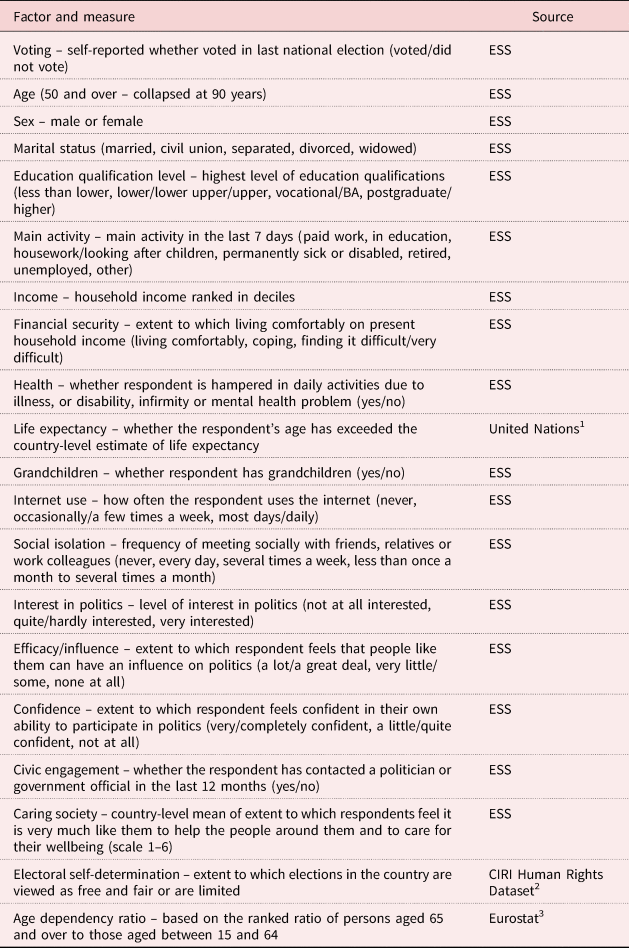
The key variables and codings for the models are given in Table 1.
Key variables

Notes: ESS: European Social Survey. 1. United Nations (2019). 2. Cingranelli et al. (Reference Cingranelli, Richards and Chad2014). 3. Eurostat (2019).
A small number of countries have forms of compulsory or mandatory voting, but given that this is not always fully enforced and that there are very few prosecutions for not voting, all the countries were included in the analysis.
As some variables in the models were closely linked and could be measuring similar factors, a series of diagnostic tests were conducted. This was particularly the case for the measures of income and financial security. However, arguably the subjective measure of financial security is capturing a factor distinct from household income and can be differently linked with, for example, health outcomes (Cialani and Mortazavi, Reference Cialani and Mortazavi2020). Generalized Variance Inflation Factor (GVIF) tests were conducted on the fully specified models. All factors had a GVIF of less than 2 except for the life expectancy variable. This variable is based on whether the respondent's age had exceeded the average country-level life expectancy. As discussed below, whilst this has limitations, it is an attempt to capture the respondent's sense of the future. It had a GVIF of 2.6. However, this was expected due to the link with age and so both variables have been retained in the analysis. In the model for the UK population, the country-level contextual variables were not included because of the small sample size.
Semi-structured interviews with older people aged 70 and older (North-West of England)
In order to examine the views and experiences of the older old in more depth, semi-structured interviews (Ayres, Reference Ayres and Given2008; Mabry, Reference Mabry, Alasuutari, Bickman and Brannen2008) were conducted with people aged 70 and older in the North-West of England.
A semi-structured questionnaire was developed which covered such issues as: attitudes towards voting, experiences of voting in the past, any barriers people had faced and their views on the attitudes of voting amongst young people, including their own children and grandchildren. Information was also collected on key demographics including: age, sex and marital status.
Recruitment and sample
In total, 37 older people were interviewed. The participants were recruited through contact with local neighbourhood groups and adverts sent out via older people's networks. The interviewees included older people of different ages and from a range of backgrounds including people who lived alone, with family and those who lived in sheltered accommodation. The age of the interviewees ranged from 70 to 97, with an average age of 80. Twenty-six of the interviewees were female and 11 were male. Twenty of the interviewees were widows or widowers, five were married, five were divorced and seven were single. In terms of general health, following the standard categorisation, 20 of the interviewees described their health as good, 15 stated it was fair and two stated that their health was bad. The sample included people who were regular voters and those who were no longer voting.
Interview data and analysis
To encourage participation, handwritten notes were taken and verbatim quotes written down. Recording interviews can have intrusive effects on the interview process (Rutakumwa et al., Reference Rutakumwa, Mugisha, Bernays, Kabunga, Tumwekwase, Mbonye and Seeley2020). Whilst only using handwritten notes can reduce the amount of information collected, the approach can create a more supportive context for social research with older people and encourage more in-depth and personal discussions, given the challenges of conducting such research (Lundgren, Reference Lundgren2013; Poland and Birt, Reference Poland, Birt, Iphofen and Tolich2018).
The verbatim quotes were coded manually by the researchers in relation to the different issues raised by each interviewee (Fereday and Muir-Cochrane, Reference Fereday and Muir-Cochrane2006). Informed by the findings from the statistical analysis, the key themes emerging from the interview codings were identified and indicative quotes selected to illustrate the themes.
Informed consent was obtained and good practice guidelines were adhered to when conducting research with vulnerable groups (Guest et al., Reference Guest, Namey and Mitchell2013). All the information collected was anonymised. The research was approved by the university's research ethics committee.
In the next section, the key findings from the survey analysis and the themes identified in the qualitative interviews are examined.
Findings
Survey analysis
Amongst the population as a whole across the 29 countries in the ESS sample, the average reported voter turnout in national elections was 77 per cent. This average varied from 63 to 94 per cent in the different countries. Overall, as is well established in the literature, older people aged 50 and above were more likely to report having voted than younger people. For example, 62 per cent of those aged between 18 and 24 reported having voted compared to 83 per cent of those aged 50 and older.
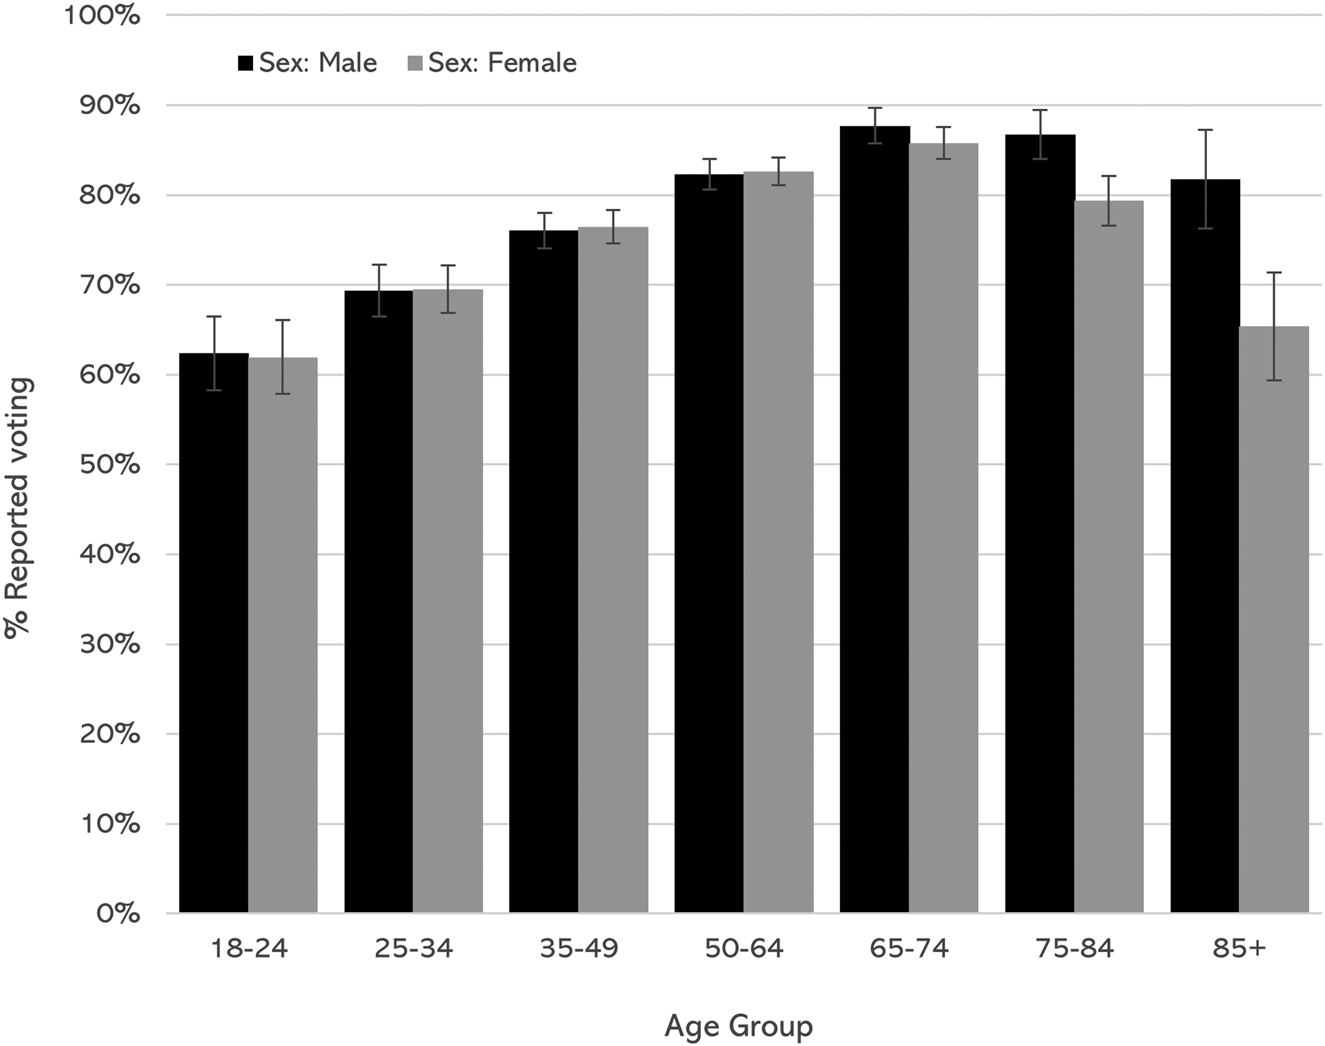
However, as Figure 1 shows, the rates of reported voting declined amongst the older old (those aged 70 and older), particularly those aged 85 and older. The highest average rates of reported voter turnout were amongst those aged between 65 and 74 (87%), compared to 72 per cent of those aged 85 and older. This is the case across almost all the countries in the ESS that had a sufficient sample size for robust comparison. The differences by sex amongst this older age group were also substantial with 82 per cent of men aged 85 and older reporting voting, compared to only 65 per cent of women.
Reported voting by age and sex.
Note: Vertical lines represent the 95 per cent confidence intervals.
Source: European Social Survey.

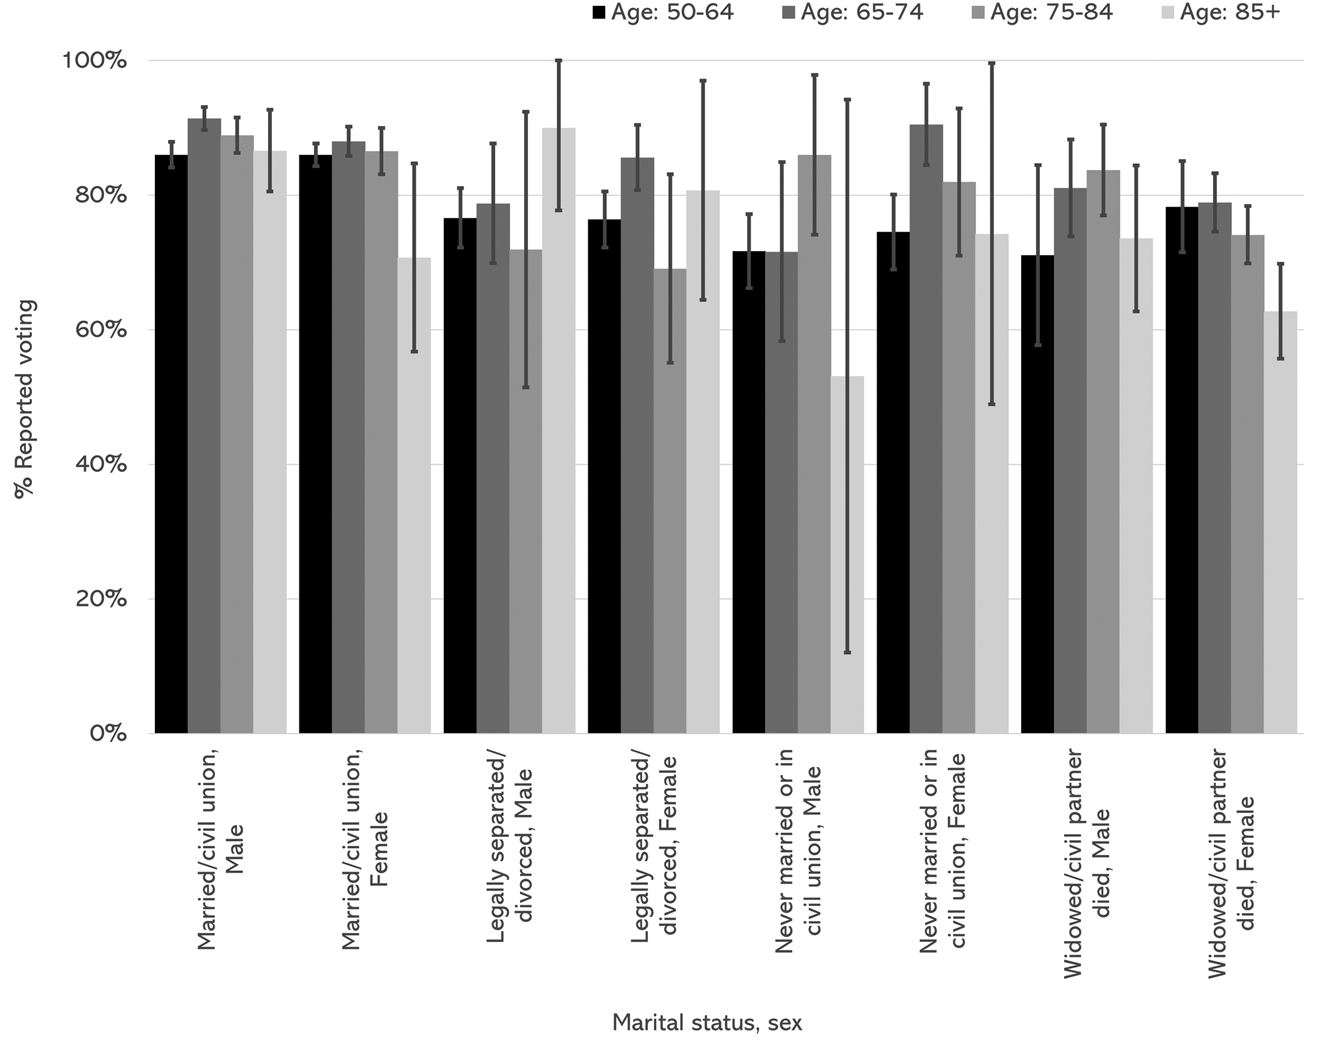
As outlined, it is important to examine the impact of social connections such as marital status on voting. Figure 2 shows how being married appears to be associated with the likelihood of voting. As the literature suggests this is linked with the social connections and mobilising influence of having a partner and residential stability.
Reported voting by age (50 and older), sex and marital status.
Note: Vertical lines represent the 95 per cent confidence intervals.
Source: European Social Survey.

Amongst widowed women, older women aged 85 and older were the least likely to report having voted. Again supporting the evidence in the literature, those older people who reported being socially isolated were much less likely to report having voted; 83 per cent of those people aged 50 and older who met socially every day with friends, relatives or work colleagues reported voting, compared to 59 per cent of those who never met socially.
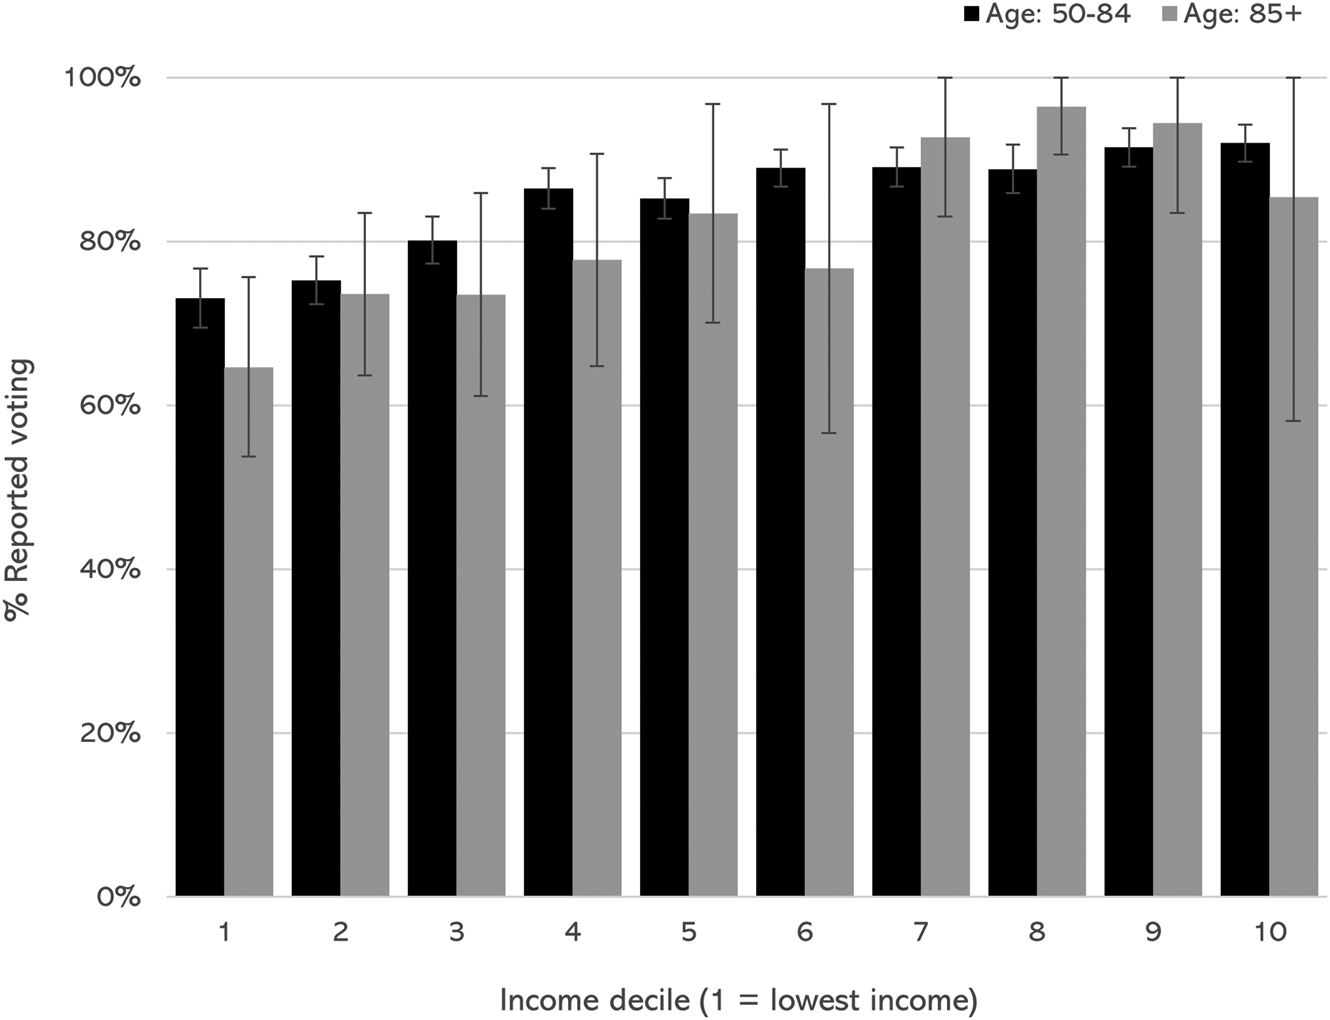
People living in households with higher incomes were more likely to report having voted. Figure 3 highlights the differences in reported voting by household income decile. Of those aged 50 and older in the ESS sample, 90 per cent of those in the three highest income deciles reported voting, compared to 72 per cent of those in the lowest income decile. As outlined, older women can be particularly affected by poverty in older age. For example, in the ESS sample, 41 per cent of men aged 85 and older reported ‘living comfortably’ on their present income compared to only 26 per cent of women in the same age group.
Reported voting by age (50 and older) and income decile.
Note: Vertical lines represent the 95 per cent confidence intervals.
Source: European Social Survey.

Formal education and a person's level of education qualifications have been shown to be associated with the likelihood of voting. Given the changing nature of access to education, the older old are more likely not to have any education qualifications. In the ESS sample, 47 per cent of those aged 85 and older reported having no formal education qualifications compared to only 8 per cent of those aged between 50 and 64. Women aged 85 and older with no education qualifications were the least likely to report having voted (55% compared to 78% of men with no education qualifications).
Employment status is also well established as being associated with the likelihood of voting and older people can be in very different employment circumstances. For example, 66 per cent of those aged between 50 and 64 in the ESS sample were in paid employment compared to less than 1 per cent of those aged 85 and older. Older retired women aged 85 and older were significantly less likely to report voting (64%) than retired men in the same age group (82%).
Health can also be a barrier to voting and given the impact ageing has on people's health it is of particular relevance. For example, in the ESS 28 per cent of people aged between 50 and 64 reported that they were either ‘a lot’ or ‘to some extent’ hampered in their daily activities by illness, disability, infirmity or a mental health problem, compared to 49 per cent of those aged between 75 and 84 and 62 per cent of those aged 85 and older. There were also substantial differences in health by sex; 53 per cent of men aged 85 and older stated that they were either ‘a lot’ or ‘to some extent’ hampered in their daily activities by health problems, compared to 68 per cent of women in the same age group. Amongst those older people with health problems, voting was lower in the older age groups; 79 per cent of people aged between 50 and 64 reported voting compared to 64 per cent of those aged 85 and older.
An important aspect of ageing and health to consider is life expectancy. This could also help to develop the knowledge of what is understood by ageing as well as people's concerns for their future and for their families and society more widely. Eighty-four per cent of those older people whose age was below the life expectancy in the country they lived in reported voting, compared to 78 per cent of those who had exceeded the life expectancy. Also linked to possible concerns for the future and perhaps to the issue of social isolation is having grandchildren. Older people who had grandchildren were more likely to report having voted (84% compared to 79%). Older women aged 85 and older with grandchildren were less likely to report having voted compared to men in the same age group who had grandchildren (67% compared to 83%).
It is notable that the older old were more likely to report being ‘not at all’ interested in politics (16% of those aged between 50 and 64 compared to 31% of those aged 85 and older). Perhaps not surprisingly, in terms of voting, people who were ‘very interested’ in politics were more likely to report having voted (93% compared to 63% of those who were ‘not at all’ interested in politics). Those aged 85 and older who were ‘not at all’ interested in politics were the least likely to report having voted. Another important factor is people's perceptions of the efficacy of the democratic system. Older women aged 85 and older were the most likely to state that the political system did ‘not at all’ allow people like them to have an influence on politics (49% compared to 31% of men in the same age group). In terms of voting, those older people who felt the political system did ‘not at all’ allow people like them to have an influence on politics were much less likely to report having voted compared to those who felt that people like them have ‘a lot’ of influence (73% compared to 93%). Amongst those people aged 85 and older who felt that the political system did ‘not at all’ allow people like them to have an influence on politics, 79 per cent of men reported voting compared to 59 per cent of women.
Related to people's sense of political influence is people's confidence in their own ability to participate in politics. Of course, this may also be linked to their health status. Amongst those people aged between 50 and 64, 28 per cent stated that they did ‘not at all’ feel confident in their ability to participate in politics compared to 52 per cent of people aged 85 and older. Amongst men aged 85 and older, 35 per cent stated that they did ‘not at all’ feel confident compared to 63 per cent of women in this age group. In terms of voting, 72 per cent of men aged 85 and older who did ‘not at all’ feel confident in their own ability to participate in politics reported voting, compared to 63 per cent of women in the same age group.
Finally, as outlined above, the extent to which the older old do not use the internet is striking. Amongst older people aged between 50 and 65, 13 per cent reported never using the internet compared to 82 per cent of those aged 85 and older. Clearly not using the internet can limit access to information and news. Amongst people aged 50 and older, 74 per cent of those who never used the internet reported voting compared to 89 per cent of those older people who used the internet most days/every day.
In order to examine the complex interplay of these different factors, the results of the statistical modelling are now discussed.
Modelling results
In the tables, negative log odds indicate a reduced likelihood of reporting having voted compared with the reference category, whilst positive log odds indicate an increased likelihood.
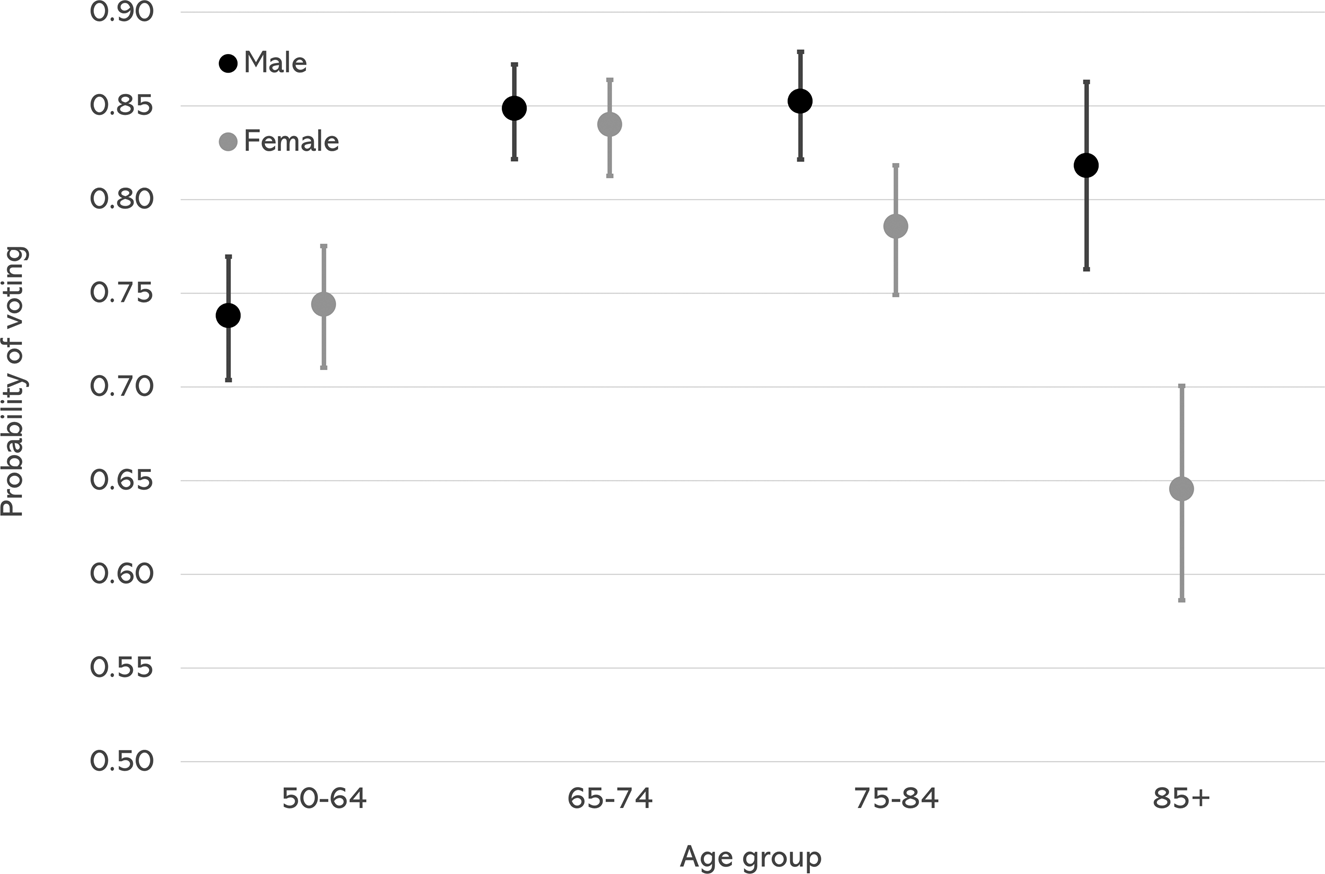
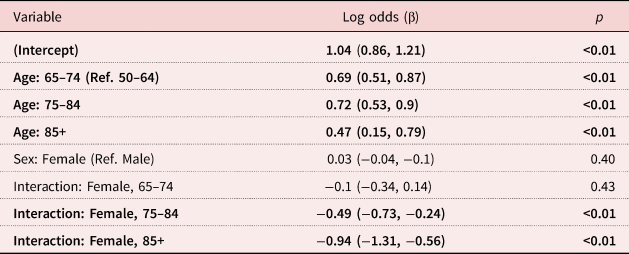
Table 2 shows the results from the model for those people aged 50 and older and reports the log odds adjusted for age and sex. Women aged 85 and older were less likely to report having voted than men in the same age group. In Figure 4, the predicted probabilities are also shown.
Predicted probabilities – reported voting by age.
Note: Vertical lines represent the 95 per cent confidence intervals.
Source: European Social Survey.

Modelling results – all people aged 50 and older: base model

Notes: The 95 per cent confidence intervals are given in parentheses. Ref.: reference category. Bold indicates significant at 95% confidence level.
Source: European Social Survey.
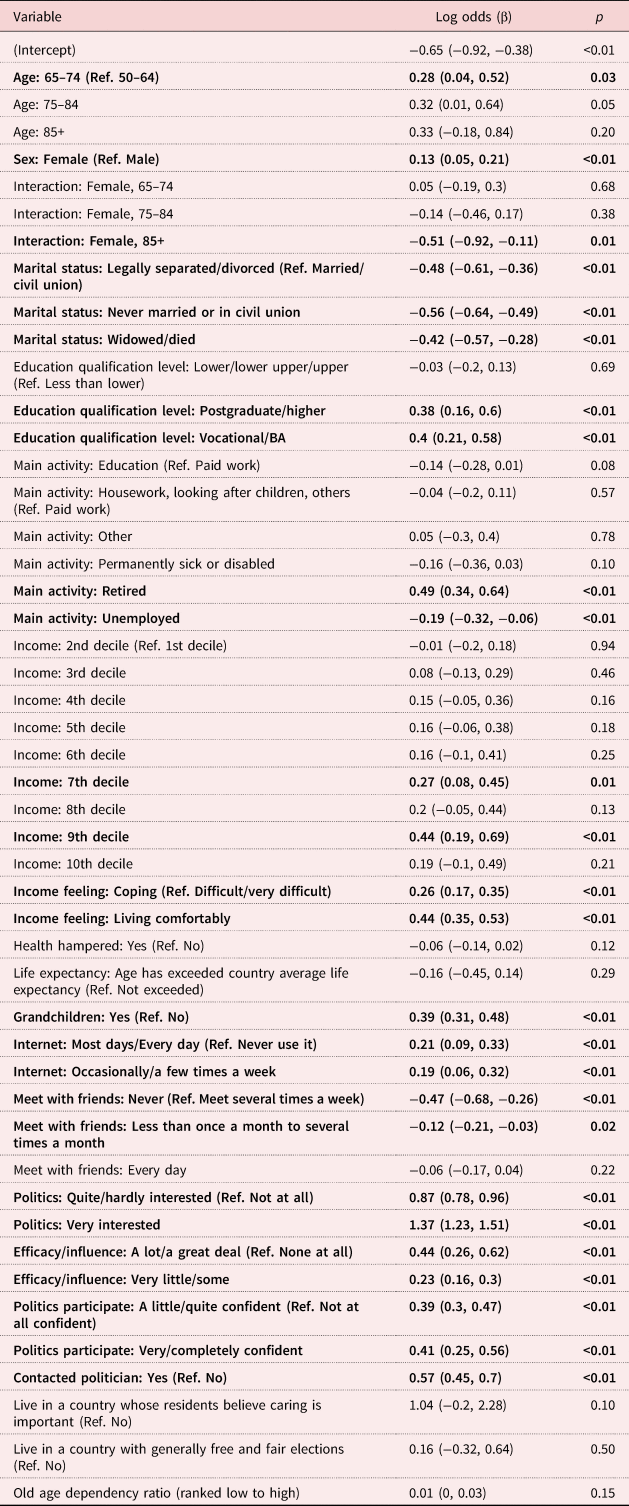
As highlighted in Table 3, when key socio-economic, behavioural and political participation factors were taken into account, women aged 85 and older were again less likely to report having voted than men in the same age group.
Modelling results – all people aged 50 and older: extended model

Notes: The 95 per cent confidence intervals are given in parentheses. Ref.: reference category. Bold indicates significant at 95% confidence level.
Source: European Social Survey.
The overall findings support the existing research evidence concerning the impact of factors such as: age, sex, marital status, education qualification levels, socio-economic status and social networks on the likelihood of voting (Goerres, Reference Goerres2009; Smets and van Ham, Reference Smets and van Ham2013; Cancela and Geys, Reference Cancela and Geys2016; Grasso, Reference Grasso2016). Highlighting the importance of social connections and also life stability in a more general sense, older people who were never married, divorced or widowed were less likely to report that they had voted compared to those older people who were married. Moreover, those older people who stated that they never or only a few times a month met socially with friends or work colleagues were less likely to report that they had voted compared to those who met people more regularly.
Even in old age, those older people with higher levels of education qualifications were more likely to report having voted than those with lower or no education qualifications. Older people living in financial security were more likely to report having voted compared to those living with financial difficulties. Those older people who were unemployed were also less likely to report voting than those who were in paid work or who were retired. It is notable that although health status was not significant in this model, it was significant in the model for those people aged 85 and older (not shown here), with people who were hampered in their daily activities by illness, disability, infirmity or a mental health problem being less likely to report having voted.
In relation to a sense of political efficacy, those older people who thought that people like them could have an influence were more likely to report having voted. Those older people who were confident in their ability to participate in politics were also more likely to report that they had voted. As expected, interest in politics was associated with the likelihood of reporting having voted. Having previously contacted a politician was also significant.
Importantly in terms of exploring the impact of ageing and older people's concern for the future, those older people with grandchildren were more likely to report having voted. It is notable that in the modelling the effect of age exceeding country-level life expectancy on the likelihood of reporting having voted was not significant. The country-level contextual variables did not have a significant impact on the likelihood of reporting having voted; living in a country whose residents believed caring is important, where elections were generally seen as free and fair, and the old age dependency ratio of a country were not significant.
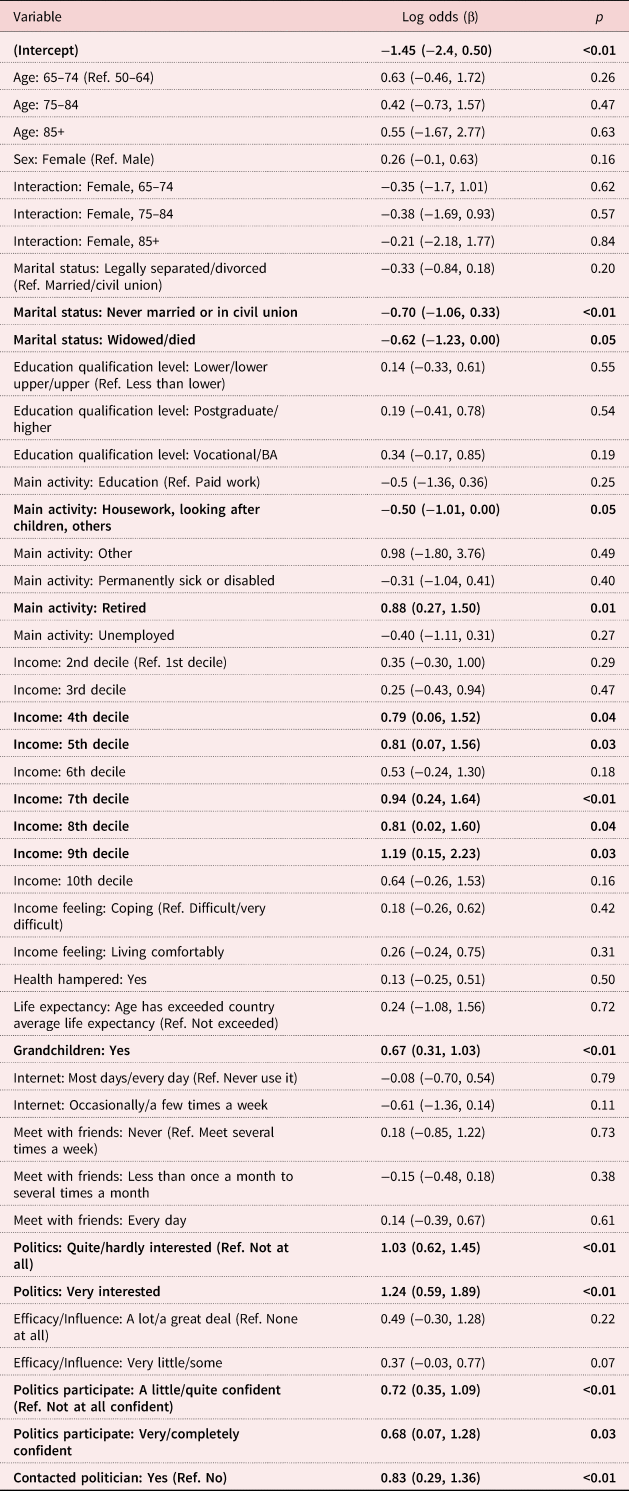
Overall, the findings for the UK population aged 50 and older were comparable to the ESS sample of all people aged 50 and older, although there were some differences. Notably amongst the UK population, the difference by sex was not significant, as shown in Table 4. Marital status, retirement, income, being a carer, having grandchildren, being interested in politics, having previously contacted a politician and feeling confident in the ability to participate in politics were all significant for the UK population in terms of the likelihood of reporting having voted.
Modelling results – United Kingdom, people aged 50 and older

Notes: The 95 per cent confidence intervals are given in parentheses. Ref.: reference category. Bold indicates significant at 95% confidence level.
Source: European Social Survey.
The key issues arising from the case study interviews with the older old in the North-West of England are now discussed.
Interviews with the older old – attitudes towards voting
The interviews in the North-West of England allowed further in-depth exploration of the attitudes towards voting amongst the older old. The average age of the interviewees was 80. The key themes identified from the interviews were: voter disengagement, recollections of voting for the first time, barriers to voting and attitudes towards young people voting.
Voter disengagement amongst the older old
Disengagement was a recurring issue raised by the interviewees. A number of the older people interviewed were very disenchanted with the political system. As one interviewee commented:
I always dedicated myself to voting, but I now don't have any faith in the government and I'm not going to be a hypocrite, the politicians don't care. As people get older they also lose interest and also we're not that well. (Female, aged 82, widow, no longer a regular voter)
One interviewee, who was still a regular voter, imagined the time she might give up:
Elections used to be really important when I was young. I am becoming very disenchanted. When you get older you get cynical again. By the time you get to 90 I bet you give up! (Female, aged 71, single, regular voter)
However, many older people stated that they would never stop voting. This sentiment was particularly linked with the recognition of the hard-won battle for the right for women to vote. As one interviewee aged 82 stated:
I always vote. Women went though hell and high water to vote. My mother cared about voting. She grew up at a time when women had just started voting. (Female, aged 82, widow, regular voter)
The importance of voting was also linked to the feeling of having a voice. As one interviewee, who was aged 79 and a regular voter, commented:
Politics is one of the most important things in our lives. You can't complain if you don't even bother voting. (Female, aged 79, divorced, regular voter)
Recollections of voting for the first time
Many of the interviewees could recall the first time they voted, which for some would have been more than half a century previously. They recalled how voting had been a significant event, often involving the whole family going to the polling station. As one interviewee described:
I had it drummed into me at an early age that you vote. I went with my mum, dad and gran. (Female, aged 75, divorced, regular voter)
Similarly, a 97-year-old interviewee described:
I went with my mother. My mother was very keen to vote. She wouldn't miss and was keen to talk to me. You used to vote with what your parents said. (Female, aged 97, widow, regular voter)
Another interviewee recalled their first time voting:
I went in a car with my father. We didn't tell the person who gave us a lift that we didn't vote for them. My father felt it was important to vote, not in so many words, but I knew he did. (Male, aged 85, single, regular voter)
Highlighting the importance and sense of civic duty attached to voting, one interviewee commented:
I vote to try and contribute to society. It's my duty. (Male, aged 83, widower, regular voter)
Whilst another interviewee linked the importance of voting to the poverty he had faced when he was younger:
I remember when we had naught. We didn't even have a clock! (Male, aged 88, widower, regular voter)
Barriers to the older old voting
The interviewees described how they faced barriers to voting and were now reliant on the support and advice of their own children. This included having to be reminded about voting and getting a lift if the polling station was not close by. One interviewee commented:
I don't always manage to vote. I try to remember the postal vote but I forget. (Female, aged 70, married, tries to vote regularly)
Another interviewee described how a combination of bad weather and the difficulty of getting to the polling station had put her off:
I do postal vote now. I changed because of transport problems. Last time the polling station was at a different school and it poured down. I thought ‘this was the last time’. (Female, aged 79, divorced, regular voter)
Describing a similar problem, another interviewee commented:
I can't walk very well. My family help me with the postal vote form. (Female, aged 75, widow, regular voter)
However, for some interviewees still being able to go to the polling station was important and gave them a sense of independence. One interviewee stated:
I still go by myself to the polling station. Not thinking of a postal vote yet. (Male, aged 83, widower, regular voter)
A number of interviewees reported difficulties with registering for a postal vote. One interviewee commented:
I've had problems with my postal vote. They wouldn't accept my signature. I think it's a fix so I didn't get to vote. I said ‘I'm never voting again’ but I have! (Female, aged 82, widow, regular voter)
Highlighting the issues of mental capacity and the problems with postal voting, one interviewee described the role her children were having:
My children now tell me to go and vote. My daughter helps with my postal vote and suggests who to vote for. (Female, aged 75, widow, regular voter)
Moreover, the changing political landscape was a concern for some of the older people. One interviewee commented:
It's almost impossible to make your mind up about anything now. Too much information! (Female, aged 73, widow, not a regular voter)
Attitudes of the older old towards young people voting
Concern about the lack of interest in voting amongst young people was a common theme. One 82-year-old interviewee compared her own experiences to that of her grandchildren now:
It was a big thing when I voted for the first time in the 1950s. I told my grandchildren off for not voting last time! They just say ‘we'll go if we get time’. (Female, aged 82, widow, regular voter)
Expressing similar frustrations, another interviewee commented:
It's a disgrace that some young people don't vote. (Male, aged 82, widower, regular vote)
Many of the interviewees were keen for younger people to vote in greater numbers. One interviewee commented:
Young people should vote, it's going to affect their lives, but my grandchildren are not that bothered. (Female, aged 75, widow, regular voter)
However, another interviewee explained how they felt younger people were only concerned about themselves:
They don't care about others. It's the ‘I'm alright Jack’ attitude. (Male, aged 70, single, regular voter)
Expressing some frustration and also her concerns about the environment, another interviewee stated:
All younger people are interested in are bloody earphones and mobile phones. Older people realise that things need to change, like the environment. (Female, age 72, single, regular voter)
Highlighting how voting is about the future, another interviewee stated:
It's disappointing when you see younger people are not interested. I think everyone should vote, including younger people, it's their future! (Female, aged 82, widow, regular voter)
A number of interviewees highlighted specific issues of concern and how they can differ from younger people. One interviewee described how she felt that:
When you get older you rely on different services, such as transport and getting to hospital appointments. Young people have less interest in this. (Female, aged 79, divorced, regular voter)
There was a sense amongst many of the older people that it was only with age that they felt they had the knowledge and understanding needed to be able to vote in an informed way. As one interviewee commented:
You think more when you are older, well at least try to. You take everything into account more. (Female, aged 87, widow, not a regular voter)
An aspect of this was the ability to reflect on a longer period of time, which comes with age. As one interviewee commented:
Older people have seen changes in the NHS [National Health Service] and education and know there are problems. (Female, aged 85, widow, regular voter)
However, in reference to the idea that young and older people were motivated to vote by different issues, one interviewee commented:
I'm voting for society. (Male, 70, widower, regular voter)
The issues raised in the interviews and the findings from the statistical analysis are considered in the discussion below.
Discussion and conclusions
The ageing population and the changing nature of ageing have implications for democracy. However, older people are often treated as a homogenous population, which risks oversimplifying the issues. The likelihood of voting is associated with a range of individual and contextual factors and these are interlinked with individual ageing, period and cohort differences (Smets and van Ham, Reference Smets and van Ham2013; Cancela and Geys, Reference Cancela and Geys2016).
In line with previous research by Bhatti and Hansen (Reference Bhatti and Hansen2012a), Goerres (Reference Goerres2009) and Wass (Reference Wass2007a, Reference Wass2007b), voting rates decline amongst the older old. Older people aged 85 and older were less likely to report being interested in politics and older women aged 85 and older were less likely to report having voted compared to men in the same age group. These women were also less likely to feel that people like them could have an influence on politics. The differences may partly be explained by the challenging social, health and financial circumstances in which many older women can find themselves. The lack of female political leaders and politicians may also be a factor (Thomas and Bittner, Reference Thomas and Bittner2017; O'Brien, Reference O'Brien2019; Alexander and Jalalzai, Reference Alexander and Jalalzai2020).
Older women and particularly those aged 85 and older were more likely to report having health problems and were more likely to be living with financial difficulties compared to older men. Many reported living alone and being socially isolated. Older people who never married, or who were divorced or widowed, were less likely to report that they voted, compared to those older people who were married. Even in older age, the likelihood of voting was linked with education qualification levels.
In terms of life expectancy, in the modelling there did not seem to be an association between an older person having exceeded the average life expectancy for their country and the likelihood of voting. However, those older people with grandchildren were more likely to report having voted compared to those without. Having grandchildren may bring a renewed engagement with the future and concern for the next generations.
The interviews in the North-West of England with older people aged 70 and older, and particularly older women, highlighted how many could remember the first time they voted and how voting remained important, partly as a consequence of the struggle for the right for women to vote. However, barriers to voting included difficulties accessing polling stations and also in using postal voting. There was also frustration about the lack of interest in voting amongst young people, including the interviewees' own children and grandchildren. There was a desire to see young people become more politically engaged and many interviewees reported voting at least partly on behalf of the younger generations, motivated by concerns about their future. Older people described how it was younger people who had more at stake and so they needed to be more politically engaged.
Older people are not a homogenous population and have different household circumstances, economic resources and lived experiences. Poverty persists in old age for many older people. What it means to be older and the process of ageing are multi-dimensional and continually changing. For example, the population currently entering older age are much more likely to be internet users compared to older people in the past and the older old today.
There are creative ways to try to engage excluded older people more directly in politics and policy making, but these can be challenging and multiple factors are at work (Barnes, Reference Barnes2005; Serrat and Villar, Reference Serrat and Villar2020). Research has pointed to the increased engagement amongst older people in different forms of political protest (Goerres, Reference Goerres2009). The attitudes and experiences of older people will continue to change both as they age and as a result of generational change (Grasso, Reference Grasso2016). However, as research by Bhatti and Hansen (Reference Bhatti and Hansen2012b) in relation to the European Parliament elections and by Konzelmann et al. (Reference Konzelmann, Wagner and Rattinger2012) into German elections has shown, demographic change may still lead to a long-term decline in voter turnout depending on how older people and ageing change.
The likelihood of voting in older age is linked to a complex range of short- and long-term factors at the individual and contextual levels. Older people reported still voting despite the challenges they faced, but amongst older women there was evidence of higher levels of disengagement. As one interviewee tellingly stated: ‘By the time you get to 90 I bet you give up!’ As the population ages and people are living longer, it is important to develop the understanding of voter turnout amongst the older old at different ages and the barriers they can face.
Limitations
The analysis for this research has drawn on cross-sectional survey data and case study interviews, both of which have limitations. Even in the pooled data, the sample size for the older old was limited. Moreover, the age variable is truncated at 90 years, preventing analysis by age of people older than this. The survey data are also reliant on self-reported voting, which can be subject to some error. Many people over-report that they have voted due to social desirability bias (Holbrook and Krosnick, Reference Holbrook and Krosnick2010). In the survey data analysis, the focus is on cross-national analysis, rather than comparing differences between or within countries. This is the subject of ongoing work. The life expectancy estimates for each country were taken from UN data and it is well known that life expectancy can vary substantially within local areas. Finally, the qualitative component of the research was carried out in only one area.
Despite these limitations, the findings provide valuable insights for the understanding of voter turnout amongst the older old at different ages.
Acknowledgements
Thank you to the European Social Survey and its respondents and to the interview participants for giving up their time and sharing their experiences.
Financial support
This research received no specific grant from any funding agency in the public, commercial or not-for-profit sectors.
Conflict of interest
The authors declare no conflicts of interest.
Ethical standards
The research was approved by the University of Manchester.
Appendix
Age profiles of countries (European Social Survey (ESS) sample and official statistics population numbers)