Implications
Ether lipids provide an adjunct to quantitative PCR-based estimates of methanogen populations and kinetics in the ruminant digestive tract and, with further development, could provide information about the effects of the rumen environment on methanogens. Understanding the location and kinetics of rumen methanogens will be important both in developing sampling protocols, understanding responses to methane mitigation treatments, and for the development of other possible methanogen markers. It seems unlikely that markers based on microbial material leaving the rumen will provide robust predictions of processes, such as methanogenesis, that occur within the rumen.
Methods to estimate rumen methanogen abundance
Quantitative real-time PCR (qPCR)
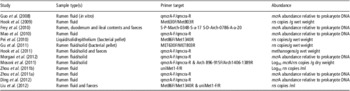
In recent years, molecular biological methods have been used to study the abundance and diversity of methanogens in many ecosystems. qPCR has become the method of choice for quantification of methanogens. This involves the amplification of methanogenic target DNA, which is then quantified in comparison with reference genes. Methanogen abundance studies normally target the specific methanogenic 16S rRNA (rrs) gene, the methyl-coenzyme M reductase (mcrA) gene or both. It has been difficult to compare qPCR-based estimates of methanogen abundance in the ruminant gastrointestinal tract as studies used different methods for sample collection and processing, different primers, and results have been expressed in different ways (Table 1).
Studies that have used quantitative real-time PCR to quantify total methanogens from the ruminant gastrointestinal tract

Nearly all qPCR studies that have compared methanogen abundance in the rumen with methane production failed to demonstrate a significant relationship (Guo et al., Reference Guo, Liu, Lu, Zhu, Denman and McSweeney2008; Mao et al., Reference Mao, Wang, Zhou and Liu2010; Mosoni et al., Reference Mosoni, Martin, Forano and Morgavi2011; Zhou et al., Reference Zhou, Chung, Beauchemin, Holtshausen, Oba, McAllister and Guan2011b; Liu et al., Reference Liu, Zhu, Liu, Guo and Dong2012; Morgavi et al., Reference Morgavi, Martin, Jouany and Ranilla2012), although Ding et al. (2012) found a strong positive relationship. This lack of consistent relationship may reflect the problems with sampling methods and choice of primers mentioned previously, as well as underlying problems with the qPCR technique. These problems include differences in the rrs gene copy number within a genome (Hook et al., Reference Hook, Northwood, Wright and McBride2009) and differences in genome copy number within a cell (Hildenbrand et al., Reference Hildenbrand, Stock, Lange, Rother and Soppa2011). There is increasing concern about bias in the PCR reaction (Tymensen and McAllister, Reference Tymensen and McAllister2012), and the small number of sequences related to known methanogens (Firkins and Yu, Reference Firkins and Yu2006) may also cause problems. Dehority and Tirabasso (Reference Dehority and Tirabasso1998) found no relationship between the concentration of celluloytic bacteria and digestion of cellulose in the rumen.
Archaeal membrane lipids as biomarkers for methanogens
The problems of using qPCR to quantify methanogens occur in other ecosystems, such as soils, and this led Huguet et al. (Reference Huguet, Fosse, Metzger, Fritsch and Derenne2010) to propose the use of chemical markers alongside qPCR. Accordingly, we have investigated alternative markers for methanogens, on the basis of the distinctive ether lipids of archaeal cell membranes. The membranes of Archaea contain dialkyl glycerol ethers (DAGE) that form bilayers, such as archaeol (2,3-diphytanyl-O-sn-glycerol), and glycerol dialkyl glycerol tetraethers (GDGTs), which form monolayers, such as caldarchaeol (GDGT-0), in different proportions.
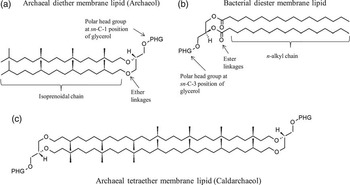
There are four fundamental differences between the ester lipids of the bacteria and eukaryotes and the DAGE and GDGTs of the Archaea (Koga et al., Reference Koga, Nishihara, Morii and Akagawa-Matsushita1993; Figure 1). First, in archaeal membrane lipids the linkage between the glycerol and the hydrocarbon chains is an ether bond, not an ester bond. Second, the hydrocarbon chains are highly methyl-branched, saturated isoprenyl chains, not linear fatty acyl chains. Third, the stereochemical structure of the di-O-radyl glycerol moiety is sn-2,3-di-O-radyl glycerol for the Archaea and sn-1,2-di-O-radyl glycerol for the bacteria and eukaryotes. Finally, there is the presence of tetraether-type lipids, that is, GDGTs, although tetraethers can also occur in bacteria, albeit rarely (Koga et al., Reference Koga, Kyruagi, Nishihara and Sone1998a).
Structural differences in the membrane lipids of the Archaea (a) and the bacteria (b). Examples of the core membrane lipids found in the Archaea including archaeol (a) and caldarchaeol (c).

Fritze et al. (Reference Fritze, Tikka, Pennanen, Saano, Jurgens, Nilsson, Bergman and Kitunen1999) and Pancost et al. (Reference Pancost, McClymont, Bingham, Roberts, Charman, Hornibrook, Blundell, Chambers, Lim and Evershed2011) used archaeol as a proxy for methanogens in peat bogs. Pancost et al. (Reference Pancost, McClymont, Bingham, Roberts, Charman, Hornibrook, Blundell, Chambers, Lim and Evershed2011) showed increasing archaeol concentrations with increasing depth in bog profiles and this was thought to reflect increased methanogenesis in the progressively more anaerobic conditions. Fritze et al. (Reference Fritze, Tikka, Pennanen, Saano, Jurgens, Nilsson, Bergman and Kitunen1999) showed some concordance between concentrations of archaeol extracted from peat and methane production measured in vitro in incubation flasks. The study of ether lipids has been particularly useful for palaeoclimatologists, who have developed two proxies based on these lipids. The TEX86 proxy for sea surface temperature (Schouten et al., Reference Schouten, Hopmans, Schefuβ and Sinninghe Damsté2002) is based on GDGTs, which can contain varying numbers of 0 to 4 cyclopentyl moieties depending on temperature. The branched and isoprenoid tetraether index (Hopmans et al., Reference Hopmans, Weijers, Schefub, Herfort, Sinninghe Damste and Schouten2004) is used for reconstructing soil organic matter input into the ocean on the basis of the predominance of branched GDGTs in material from terrestrial environments and of crenarchaeol in material from marine and lacustrine environments. In addition, indices for air temperature and soil pH were developed in a study by Weijers et al. (Reference Weijers, Schouten, van Den Donker, Hopmans and Sinninghe Damsté2007), which is based on variations of cyclopentane moieties and extent methylation of branched GDGTs. A comprehensive review of these methods can be found in a study by Schouten et al. (Reference Schouten, Hopmans and Sinninghe Damsté2013).
Archaeal membrane lipids as biomarkers for rumen methanogens
Pancost et al. (Reference Pancost, McClymont, Bingham, Roberts, Charman, Hornibrook, Blundell, Chambers, Lim and Evershed2011) identified the presence of non-methanogenic Archaea as a potential complicating factor in their results with peat soils. It has been assumed that methanogens are the only Archaea present in the rumen (Sharp et al., Reference Sharp, Ziemer, Stern and Stahl1998; Janssen and Kirs, Reference Janssen and Kirs2008), and Shin et al. (Reference Shin, Choi, Lim, Hong, An, Cho, Kim, An, Kang, Lee, Kim and Yun2004) and Lee et al. (Reference Lee, Jung, Oh, Lee, Madsen and Jeon2012) found virtually no non-methanogenic Archaea in the rumen (<0.05%). In contrast, the pyrosequencing study by Brulc et al. (Reference Brulc, Antonopoulos, Miller, Wilson, Yannarell, Dinsdale, Edwards, Emerson, Wacklin, Coutinho, Henrissat, Nelson and White2009) found around 20% of Archaea to be non-methanogenic, showing that more work is needed to confirm levels of non-methanogenic Archaea in the rumen.
McCartney (2012) compared estimates of methanogen populations in 12 rumen fluids using both archaeol analysis and qPCR with a number of primer sets (rrs for total methanogens and a range of methanogen species; mcrA targets). The relationships between the estimates of methanogen abundance using qPCR and archaeol measurements varied across primer sets. There were only weak correlations between archaeol and total methanogen estimates using mcrA (P = 0.097) and rrs (P = 0.013) genes, whereas the strongest relationship (P < 0.001) was with the rrs primer set that was specific to Methanobrevibacter ruminantium. This is further suggestive of problems with universal archaeal primer sets. The weaker relationship of archaeol with Methanobrevibacter smithii (P = 0.068) and Methanosphaera stadtmanae (P = 0.046) may be due to the lower abundance of these methanogens in the rumen (Janssen and Kirs, Reference Janssen and Kirs2008).
Methods to estimate methane production in the rumen
The established methods for estimating methane production from individual animals, respiration chambers and the SF6 technique have been reviewed extensively elsewhere, and their strengths and weaknesses are well recognised (Pinares-Patiño et al., Reference Pinares-Patiño and Clark2008). Accordingly, this review will consider less-intrusive approaches to estimating rumen methanogenesis, including those that can be used with free-grazing animals.
Non-invasive techniques to study rumen function
There is a long history of research on less- and non-invasive techniques to study aspects of rumen function. This has been driven partly by the desire to reduce the use of rumen-fistulated animals, both for animal welfare reasons, and because these techniques may be easier to apply in developing countries with free-ranging ruminants. The large numbers and high methane outputs from grazing ruminants make the latter objective of increased importance. Dewhurst et al. (Reference Dewhurst, Davies and Merry2000) noted the potential for the application of non-invasive techniques for monitoring rumen function to guide feeding and other management decisions. Most pertinent now is the potential to use less- and non-invasive tools in breeding for increased feed efficiency and reduced methane production. Hegarty (Reference Hegarty2004) outlined the basis for possible genetic differences in methane production. The availability of genomic tools means that our ability to select for these more complex traits is limited more by the availability of simple, rapid and low-cost phenotyping tools.
The urinary purine derivative (allantoin) technique provides a good example of what is possible in this area. Urinary purine derivatives have been used to predict microbial (protein) flow from the rumen on the basis of the strong relationship with the flow of purines from the rumen (Chen et al., Reference Chen, Ørskov and Hovell1990). The technique has been used to identify effects of a wide range of dietary and other treatments on microbial protein yield from the rumen (Dewhurst et al., Reference Dewhurst, Davies and Merry2000). There are a number of assumptions that limit the accuracy of the technique, but these are generally regarded as less problematic than the technical problems associated with post-rumen cannulation and marker techniques that are the other way to estimate microbial protein flow from the rumen. The technique depends on assumptions about the degradation of dietary purines, the purine content of rumen microbes, the endogenous contribution of purine derivatives from turnover within animal tissues and losses of purine derivatives through other routes (e.g. milk; Shingfield and Offer, Reference Shingfield and Offer1998).
A key issue for the use of markers in faeces, urine or milk to describe processes occurring in the rumen is the relationship between what takes place in the rumen and what leaves the rumen. In the case of markers for rumen microbes, this means that relationships could be complicated by processes at the reticulo-omasal orifice – in particular, the selective retention of specific fractions of rumen digesta. This is not an issue for predicting microbial protein yield from the rumen, as both the target (microbial protein leaving the rumen) and the predictor (purine derivatives derived from purines leaving the rumen) have to leave the rumen. It may be more of an issue in the case of markers for rumen production of volatile fatty acid (VFA) and methane discussed later in this paper, as the products leave the rumen by substantially different routes (absorption across the rumen wall, eructation) than the markers.
Faecal archaeol and methane production
Archaeol is resistant to digestion in the intestines and can be measured in faeces of ruminants, but is not detectable in faeces from non-ruminant herbivores with hind gut fermentation using current methodologies (Gill et al., 2010). A number of studies have now investigated the relationship between faecal archaeol and methane production. Gill et al. (2011) compared faecal archaeol and methane production from steers fed diets based primarily on grass silage or concentrates. Treatment differences in methane production mirrored differences in faecal archaeol concentrations. However, when considering individual animals within dietary treatments, there was no significant relationship.
Our own studies extended this analysis by comparing faecal archaeol concentration and CH4 production across a range of diets in studies on beef and dairy cattle. Faecal archaeol was compared with methane measurements made by the sulphur hexafluoride (SF6) tracer technique from animals consuming six dietary treatments with varying levels of concentrate (McCartney (2012) with samples taken from the study by McGeough et al. (Reference McGeough, O'Kiely, Hart, Moloney, Boland and Kenny2010)). A positive significant relationship (P < 0.001) was found between faecal archaeol and methane production; however, the relationship was again weak within dietary treatments.
One of the potential sources of variation in the studies mentioned above is problems with the SF6 technique, and therefore a further study was conducted to investigate the relationship between faecal archaeol and methane measurements made using respiration chambers from animals consuming just one dietary treatment. Promisingly, a positive significant relationship (P = 0.007) was found within a dietary treatment. However, stage of lactation also affected the relationship (P = 0.011) and this may be related to higher dry matter (DM) intakes concurrent with more days in milk (McCartney et al., Reference McCartney, Bull, Yan and Dewhurst2013).
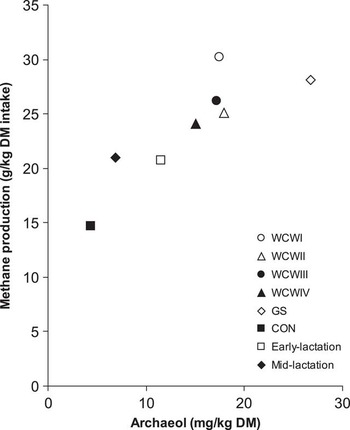
There was a good relationship between faecal archaeol concentration and methane production expressed per unit DM intake for treatment means across these three studies (Figure 2). However, as we have seen, there is considerable variability for individual values within treatment means. Further, the positive intercept for the relationship shown in Figure 2 suggests some selectivity in what flows out of the rumen. Selective retention of methanogens in the rumen means that, although methane is still being produced in the rumen by methanogens, their retention in the rumen means that they cannot be detected (as archaeol) in the faeces.
Relationship between faecal archaeol (mg/kg dry matter (DM)) and CH4 production (g/kg DM intake). Average values for each dietary treatment are presented, which included grass silage (GS)1, ad libitum concentrates (CON)2 and whole-crop wheat (WCW)3 silages. Early and mid lactation results from animals consuming a 70% concentrate diet are also presented. 1GS plus 2.60 kg of supplemental concentrate DM. 2CON plus 1.28 kg of GS DM. 3WCW silage plus 2.60 kg concentrate DM. Grain to straw plus chaff: I = 11.89; II = 21 : 79; III=31 : 69; IV = 47 : 53.

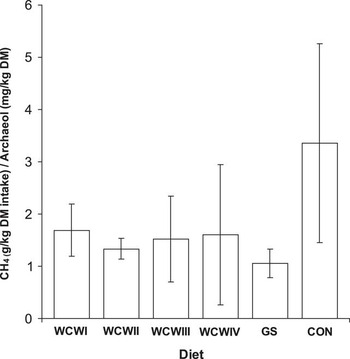
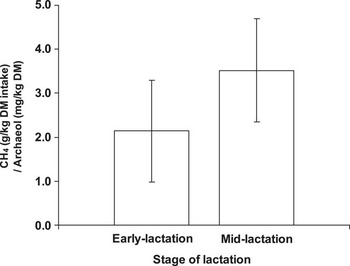
Selective retention of methanogens in the rumen is also evident in our recent study that found no significant relationship between concentrations of archaeol in whole rumen digesta and corresponding samples of faeces, although there were trends (P < 0.1) for effects of diet and experimental period on the relationship (McCartney, 2012). Differences in the methane : faecal archaeol ratio (CH4 : A) reflect diet and physiological effects on the extent of selective retention, with a higher CH4 : A ratio, suggesting greater retention of methanogens in the rumen. The higher CH4 : A ratio for animals offered a high concentrate diet (Figure 3; McCartney, 2012) that may result from increased retention of methanogens associated with protozoa, which are selectively retained in the rumen (Leng et al., Reference Leng, Gill, Kempton, Rowe, Nolan, Stachiw and Preston1981). The higher CH4 : A for cows in mid lactation in comparison with early lactation (Figure 4; McCartney et al., 2013) was probably related to the increased DM intake affecting digesta kinetics.
Effects of diet on CH4 production per unit of faecal archaeol with error bars showing standard deviation. Dietary treatments included grass silage (GS)1, concentrates (CON)2 and whole-crop wheat (WCW)3 silages. 1GS plus 2.60 kg of supplemental concentrate DM. 2CON plus 1.28 kg of GS dry matter (DM). 3WCW silage plus 2.60 kg concentrate DM. Grain to straw plus chaff (DM basis): I = 11 : 89; II = 21 : 79; III = 31 : 69; IV = 47 : 53.

Significant effects of stage of lactation on CH4 production per unit of faecal archaeol with error bars showing standard deviations.

The growth rates of methanogens may cause additional variation in the relationship between faecal archaeol concentrations and methane production. This is because methanogenesis is linked to ATP production (Thauer, Reference Thauer1998), and the maintenance energy requirement and growth rate of a microbe can affect the molar growth yield per mole of ATP (g microbial DM/mol ATP; Y ATP; Stouthamer and Bettenhaussen, Reference Stouthamer and Bettenhaussen1973). Rapidly growing microbes have a higher Y ATP, as less energy is devoted to maintenance processes, whereas microbes with lower maintenance energy requirements have higher Y ATP values as more energy can be devoted to growth (Stouthamer and Bettenhaussen, Reference Stouthamer and Bettenhaussen1973).
It is likely that methanogens associated with the liquid phase grow faster in order to avoid ‘wash out’ from the rumen owing to faster passage rate of this fraction and this would increase Y ATP. Methanogens may also conserve energy by altering their membrane permeability in order to reduce the inadvertent loss of ions that maintain the chemiosmotic potential (Valentine, Reference Valentine2007). Reducing the permeability of membranes can be achieved by increasing the proportion of GDGTs (Mathai et al., Reference Mathai, Sprott and Zeidel2001) and/or increasing the proportion of phosphoglycolipids with two or more sugar head groups (Shimada et al., Reference Shimada, Nemoto, Shida, Oshima and Yamagishi2008). Of course, altering the archaeol : GDGT ratio in membranes will cause further variation in the relationship between archaeol and methane production.
The advantages of using the faecal archaeol method for estimating methane emissions in comparison with traditional techniques include limited/no contact with the animals, relatively simple sampling/processing methods, relatively low cost and the opportunity to pool samples together or to take individual measurements. However, the substantial variation in the relationship between faecal archaeol concentrations and methane production limits the value of faecal archaeol to predict methanogenesis in the rumen. Thus, in future studies, it may be more sensible to focus on the potential of archaeol as a general methanogen biomarker in the ruminant gastrointestinal tract. In addition, the role of GDGTs in the rumen methanogen membrane should be further investigated. It would be much easier if a non-invasive predictor of methane production could be based on the use of milk samples, which are much easier to collect and potentially analyse online than faecal samples. Possible approaches based on milk samples are discussed in the next section.
Odd- and branched-chain fatty acids (OBCFAs) in milk
Milk is the most accessible sample from cows and has the advantage of being a composite sample over the entire milking interval. When it became clear that milk allantoin was not a useful predictor for microbial protein yield from the rumen, attention turned to the study of OBCFAs, which are components of rumen microbes that are transferred to milk at a much higher level. OBCFAs are not normally present in plant-derived feeds (Diedrich and Henschel, 1990), though some forages can have modest levels of the anteiso-C15:0 homologue (Kim et al., Reference Kim, Sanderson, Dhanoa and Dewhurst2005). They have long been recognised as a signature of ruminant fats (e.g. Polidori et al., Reference Polidori, Maggi, Moretti, Valfre and Navarotto1993; Jenkins, 1995). Although there are complicating issues with OBCFA synthesis and chain elongation within animal tissues (Vlaeminck et al., Reference Vlaeminck, Fievez, Cabrita, Fonseca and Dewhurst2006; Dewhurst et al., Reference Dewhurst, Moorby, Vlaeminck, Van Nespen and Fievez2007), there has been some success in establishing relationships between milk OBCFA and aspects of rumen function (Vlaeminck et al., Reference Vlaeminck, Fievez, Cabrita, Fonseca and Dewhurst2006; Fievez et al., Reference Fievez, Colman, Castro-Montoya, Stefanov and Vlaeminck2012).
Vlaeminck et al. (Reference Vlaeminck, Fievez, Cabrita, Fonseca and Dewhurst2006) established that microbial OBCFA profiles depend more on the fatty acid synthase activities of the rumen microbes than on the substrates that are available. A number of workers have shown higher levels of iso-branched-chain fatty acids (iso-C14:0 and iso-C16:0) in rumen solid-associated bacteria in comparison with liquid-associated bacteria (Vlaeminck et al., Reference Vlaeminck, Fievez, Cabrita, Fonseca and Dewhurst2006; Bessa et al., Reference Bessa, Maia, Jeronimo, Belo, Cabrita, Dewhurst and Fonseca2009), and this is probably related to the higher proportions of these fatty acids in some of the main celluloytic bacteria (data summarised by Vlaeminck et al., Reference Vlaeminck, Fievez, Cabrita, Fonseca and Dewhurst2006).
Milk OBCFAs have been used to predict rumen VFA proportions (Vlaeminck and Fievez, Reference Vlaeminck and Fievez2005; Vlaeminck et al., Reference Vlaeminck, Fievez, Cabrita, Fonseca and Dewhurst2006; Bhagwat et al., Reference Bhagwat, De Baets, Steen, Vlaeminck and Fievez2012; Fievez et al., Reference Fievez, Colman, Castro-Montoya, Stefanov and Vlaeminck2012). The most recent rational models based on 224 observations gave Q 2 values (analogous to R 2 values) of 0.74 (acetate molar proportion), 0.67 (propionate molar proportion) and 0.65 (butyrate molar proportion; Bhagwat et al., Reference Bhagwat, De Baets, Steen, Vlaeminck and Fievez2012). A higher R 2 was obtained in a validation study (Fievez et al., Reference Fievez, Colman, Castro-Montoya, Stefanov and Vlaeminck2012) and this may be the consequence of making comparisons with a single study. Indeed, experiment appears as a significant term in models relating milk OBCFA to rumen VFA and methane production and it is not yet clear why this is the case. One possible explanation is animal or environmental (e.g. ambient temperature) effects on rumen digesta kinetics, which may affect the relationship between rumen processes and the flow of microbial OBCFA from the rumen. The iso-branched-chain fatty acids mentioned above have a significant relationship with rumen VFA proportions that is consistent with their association with the solid-phase and celluloytic bacteria – iso-C14:0 was positively related to acetate molar proportion and negatively related to propionate and butyrate molar proportion, whereas iso-C15:0 was positively related to acetate molar proportion.
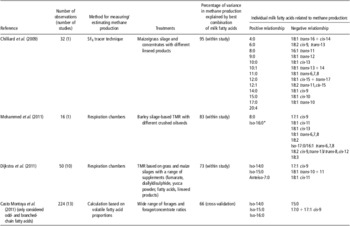
The most recent interest has been to relate milk OBCFA and other fatty acids to methane production, and a number of studies that have done this are summarised in Table 2. It is interesting to note that two of the OBCFAs, iso-C14:0 and iso-C16:0, are consistently related to methane production and this may be related to the previously mentioned associations of these fatty acids with rumen VFA proportions and celluloytic bacteria. Castro-Montoya et al. (Reference Casto Montoya, Bhagwat, Peiren, De Campeneere, De Baets and Fievez2011) showed a negative relationship between methane production and both C15:0 and C17:0, which are positively correlated with propionate and negatively correlated with acetate. Although their study involved only a single dietary treatment (myristic acid), Odongo et al. (Reference Odongo, Or-Rashid, Kebreab, France and McBride2007) also noted a decrease in iso-C14:0 and iso-C16:0 with decreased methane production. Unfortunately, all of these studies have limitations – either in terms of the number and range of dietary treatments involved or in the technique used to estimate methane production – and full interpretation awaits more complete data sets.
Use of milk fatty acids to predict methane production

TMR = total mixed rations.
*P = 0.07.
Many of the studies have used supplements based on fatty acid or oils, as these are among the most effective diet supplements for reducing methane production. However, adding high levels of fatty acids inevitably alters the milk fatty acid profile and it becomes difficult to identify relationships that are of more general applicability. For example, Chilliard et al. (Reference Chilliard, Martin, Rouel and Doreau2009) obtained excellent predictions of methane output when supplementing diets with linseed products. However, the predictions are dominated by isomers of the C18:2 and C18:1 homologues that would derive from, or be affected by, the linseed fatty acids, and thus it is not clear that these relationships would have general applicability.
Mohammed et al. (Reference Mohammed, McGinn and Beauchemin2011) also obtained significant relationships between methane production and milk fatty acid profiles. In this case, relationships were best within dietary treatment. They also showed that equations to predict methane production based on earlier work overestimated methane production and that the relationship between milk fatty acids and methane production was affected by the rumen protozoal population. This latter effect could be related to selective retention of microorganisms in the rumen as protozoa are preferentially retained (Leng et al., Reference Leng, Gill, Kempton, Rowe, Nolan, Stachiw and Preston1981).
Mid IR reflectance (MIR) spectroscopy of milk
Although milk is an easier sample to collect than faeces, it would be preferable if a rapid method for prediction of methane production could be adopted as part of routine milk testing. A recent study by Dehareng et al. (Reference Dehareng, Delfosse, Froidmont, Soyeurt, Martin, Gengler, Vanlierde and Dardenne2012) identified the potential to predict methane production on the basis of mid MIR spectroscopy analysis of milk. It seems likely that a significant proportion of this relationship is driven by the association between methanogenesis and milk fatty acids with all its limitations described above. However, Dehareng et al. (Reference Dehareng, Delfosse, Froidmont, Soyeurt, Martin, Gengler, Vanlierde and Dardenne2012) also suggest that some of the variation is explained by spectral information coming from other milk components.
Conclusions and recommendations for future work
qPCR-based approaches to quantifying methanogens have a number of problems and the use of ether lipids as biomarkers has the potential to quantify rumen methanogen populations and also to help understand qPCR results. More attention must be paid to the distribution of methanogens in different locations and digesta fractions within the rumen. These have important implications both for the energetic efficiency of methanogenesis and the relationships between the rumen methanogen population, methanogenesis and the rumen outflow of methanogens. Improved understanding of the location of the methanogens in the rumen could lead to more informed rumen sampling protocols.
The DAGE : GDGT ratio and/or proportion of phosphoglycolipids should be investigated owing to potential effects on maintenance energy requirements. It is hypothesised that the methanogen membrane adapts to contain more GDGT/phosphoglycolipids in challenging rumen conditions such as low rumen pH, low structural carbohydrate availability and/or high passage rates to reduce permeability of the membrane, and thus increase efficiency of the methanogen cell. If there was a change in the GDGT : DAGE ratio or phosphoglycolipid proportion, the next step would be to see whether this was because of a shift of the methanogen community, or whether the methanogen community already present in the rumen adapts its membranes.
Overall, the use of both milk fatty acids and faecal archaeol as markers for methanogenesis is complicated by the issues of selective retention of digesta in the rumen. Although these techniques explain some of the variation in methane production, particularly when comparing treatment means, there remains potential for significant mismatch between processes occurring in the rumen (VFA production or methanogenesis) and flows from the rumen (bacteria and their OBCFA; Archaea and their ether lipids).
Although these problems limit the application of marker approaches on the basis of analysis of milk or faeces, the use of archaeol as a general marker for methanogen abundance in the digestive tract shows promise. Indeed, the use of a chemical marker to support qPCR approaches will be helpful to understand the location and kinetics of methanogens in the rumen that may be the cause of some of this variation.
Acknowledgement
The authors acknowledge financial support from the Teagasc Walsh Fellowship Scheme.
This paper was published as part of a supplement to animal, publication of which was supported by the Greenhouse Gases & Animal Agriculture Conference 2013. The papers included in this supplement were invited by the Guest Editors and have undergone the standard journal formal review process. They may be cited. The Guest Editors appointed to this supplement are R. J. Dewhurst, D. R. Chadwick, E. Charmley, N. M. Holden, D. A Kenny, G. Lanigan, D. Moran, C. J. Newbold, P. O'Kiely, and T. Yan. The Guest Editors declare no conflict of interest.