1 Introduction
Suprasegmental features of speech, known as prosody, generally refer to acoustically measurable patterns in f0, duration and intensity. A particular challenge in the existing literature concerns the accurate description of f0 contours (i.e. intonation). In this respect it is still largely unclear how prosody and meaning are related (e.g. Buxó-Lugo & Kurumada Reference Buxó-Lugo and Chigusa2019). A core element in the description of intonation patterns that are representative for a given language is the assumption of an inventory of prototypical tonal patterns (e.g. see Ladd Reference Ladd2008: Chapter 3 for an overview). Unlike segmental inventories, which may be supported by evidence from minimal pairs, contour inventories are less straightforward to support empirically. This is partially the case because intonation contours potentially fulfil a myriad of linguistic and meta-linguistic functions, often in simultaneous fashion.
As a result of the challenge to accurately describe intonation patterns, existing approaches fall short on four essential points, relating to (i) the limitation to a small set of functions, (ii) the reliance on scripted speech, (iii) the need for elaborate annotations, and (iv) the potentially high degree of subjectivity due to researcher’s impressions. These points are further outlined in the following sections. This paper argues that the consequence of these shortcomings is the lack of documenting prosody and intonation in initial descriptions of a language, a problem already addressed in previous work (e.g. Himmelmann & Ladd Reference Ladd2008, Caldecott & Koch Reference Caldecott and Karsten2014, Jun & Fletcher Reference Jun and Janet2014). However, apart from guidelines on how to collect data suitable for prosodic analysis or a general introduction to prosodic analysis, researchers who describe intonation still lack hands-on tools that help to overcome the issues just mentioned. This paper proposes a cluster-based exploratory approach, which provides the researcher with direct feedback on how individual contours in a given dataset can be categorised on the basis of their acoustic form.
The next sections illustrate the limitations in current research (Sections 1.1–1.4), based mainly on examples of workflows used in autosegmental-metrical accounts of intonation, which are to date among the most influential ones (e.g. Jun Reference Jun2005, Reference Jun2014). The approach proposed in this paper is meant to provide further refinement of such workflows. That is, an inventory of annotation labels – as generally adopted in autosegmental-metrical analyses – could still be the outcome after cluster analyses and additional (perception) testing. The proposed approach also applies to more generic explorations of which f0 contours can be distinguished in a given dataset. The approach consists of two core components, as described in the usage guidelines provided in the accompanying manual (supplementary material). In order to illustrate the applicability of the method, this article provides conceptual proof (Section 2), field-data examples of phrase contours found in Papuan Malay spontaneous speech (Section 3) and of tone contours found in Zhagawa words that were elicited in a controlled task (Section 4). Finally, a brief conclusion is given summarising the proposed approach (Section 5).
1.1 Functions
Many studies have established basic contour inventories by means of eliciting a (short)list of functions, rather than primarily on the basis of (acoustically) distinct intonation contours (e.g. Jun Reference Jun2014). More in general, the literature has shown no consensus on how exactly prosody contributes to the meaning of an utterance (e.g. Couper-Kuhlen Reference Couper-Kuhlen1986, Hirst Reference Hirst2005, Buxó-Lugo & Kurumada Reference Buxó-Lugo and Chigusa2019). This is partially the result of acknowledged challenges in the field, for example, keeping form and meaning separate in prosodic analyses (Hirst Reference Hirst2005), distinguishing different types of meanings (Cruttenden Reference Cruttenden1997, Prieto Reference Prieto2015), and accurately modelling prosody beyond intonation (Niebuhr & Ward Reference Niebuhr and Nigel2018). Autosegmental-metrical work has frequently selected a limited set of functions in order to make typological comparisons possible. It is widely acknowledged that intonation patterns do not signal one focus category exclusively, such that overlap between focus categories and co-occurrence of functions are expected (e.g. Jun Reference Jun2005, Watson, Tanenhaus & Gunlogson Reference Watson, Tanenhaus and Gunlogson2008). However, attempts to include in-depth description of prosody and intonation in language documentation have been scarce (Himmelmann & Ladd Reference Ladd2008).
To accurately capture the form–meaning relation of intonation patterns from speech data, researchers require at least some knowledge of the potential functions that intonation could express. For underdescribed languages, a common approach is to test functions that are known to be expressed by prosody in other (already described) languages. A commonly used controlled elicitation task, such as a question–answer paradigm or a reading paradigm, only targets a specific function (e.g. question vs. statement, focus vs. post-focus) and could reveal whether or not speakers produce different intonation patterns in these conditions. While these approaches could provide some initial intuitions about the prosody of an underdescribed language, they force the researcher to single out a small number of functions, plausibly missing out on others. Given the challenge that intonational meanings are hard to categorise, this paper proposes to start an intonation analysis by non-human categorisation of the surface forms of intonation, i.e. the produced f0 contours. In this way, researchers can be more confident that the contours distinguished by such an analysis constitute actual acoustic (potentially perceptible) differences. Non-human categorisation also has the advantage of revealing acoustic differences that are subtle or too small to be picked up by non-native listeners, a point further discussed in Section 1.4. It is important to note that the outcome does not solve the problem of one contour having multiple functions (e.g. Watson et al. Reference Watson, Tanenhaus and Gunlogson2008). Nevertheless, it is more difficult to capture form–meaning mappings when the departure of the exploration is a set of ill-defined meanings or specific functions than when the departure of exploration is a reproducible categorisation of surface forms.
1.2 Scripted speech
Given that intonation research often develops from the elicitation of a limited number of functions, researchers are likely to resort to elicitation tasks that involve a high level of control over the targeted speech data (e.g. Jun Reference Jun2014). This is often achieved by the use of scripted speech. From the 15 languages covered in Jun (Reference Jun2014), six intonation descriptions exclusively relied on scripted (i.e. read) speech. The remaining nine languages were primarily described using scripted speech as well, often relying on either semi-spontaneous speech or fully spontaneous speech as a secondary source, for example to confirm the collected scripted examples (e.g. Elordieta & Hualde Reference Elordieta and Jose2014). Earlier work on 13 different languages and language varieties was also based mainly on scripted speech, in as much as this information was provided in the reports (Jun Reference Jun2005). Thus, for many researchers, scripted speech is the accepted technique to come to descriptions of intonation. The scripted examples are often far from representative of natural speech. This is not immediately problematic if the aim is to produce abstract phonological annotations of intonation contours. In fact, it can be helpful to use rather formal speech registers (e.g. reading) to come to such descriptions as a means of controlling the variability found in non-scripted speech. The question remains, however, what these descriptions will ultimately reveal about a given language, knowing that speakers produce a much richer variety of utterances outside the elicitation task. The inclusion of more spontaneous types of speech is therefore essential to the investigation of prosody.
1.3 Annotation
Once data has been collected, specific annotation schemes can be used to label intonation contours (Jun & Fletcher Reference Jun and Janet2014). In autosegmental-metrical approaches, the annotation labels are a core part of the analysis, with sometimes several labelling schemes available for a single language (e.g. Grice, Baumann & Benzmüller Reference Grice, Baumann and Benzmüller2005 for a comparison of AM schemes on German intonation). For well-studied languages, AM annotation schemes are available as (online) courses which can be used to train labellers (e.g. ToBI: Beckmann & Ayers Elam 1997, ToDI: ToDI Collective 2019, GToBI: Grice et al. Reference Grice, Baumann, Ritter and Röhr2019). For lesser studied languages, these courses are often not available and the resources for elaborate training are likely to be limited. Consequently, many descriptions in Jun (Reference Jun2005, Reference Jun2014) do not go beyond a basic set of contours, plausibly leaving others unexplored.
In addition, resource intensive annotations might result in analyses that are based on a limited number of speakers. That is, for nine out of the ten languages for which the number of speakers was reported, samples from five to six speakers were used on average (Jun Reference Jun2014). Admittedly, reaching a sufficient number of speakers could be more difficult for endangered and underdocumented languages. Nevertheless, a small sample size compromises the representativeness of the intonation descriptions in yet another way.
1.4 Impressionistic bias
Field researchers, often non-native speakers of the language being studied, rely heavily on their perceptual impressions and their understanding of the language. Crucially, perceptual impressions by non-native speakers are not a reliable source of information because they can be biased towards mapping form and function in ways that reflect the researcher’s native language. This issue has been addressed regarding the identification of segment inventories (Michaud & Vaissière 2009). Also in word prosody, the influence of researchers’ impressions has led to contradicting findings (see e.g. Kaland Reference Kaland2019 on Trade Malay stress research). Arguably, these impressions could still be empirically tested in perception experiments in order to reduce subjectivity. In the worst case, however, the non-native ear simply cannot perceive certain acoustic contrasts that may be meaningful in the language under investigation. Consider the example of Japanese listeners failing to perceive distinctions between /l/ and /r/ (e.g. Goto Reference Goto1971). There is no reason to assume that such inabilities do not play a role for other acoustic aspects of speech, such as f0. In fact, research has shown the difficulties for L2 learners of a tone language, whose L1 did not have lexical tone contrasts (e.g. Burnham & Jones 2002, Hallé, Chang & Best Reference Hallé, Chang and Best2004). If these contrasts are not learned from an early age, it is plausible that adult researchers miss out acoustic contrasts with which they are not familiar. Although elicitation paradigms and extensive input from the language could still help to reveal these contrasts, the potential subjectivity of the inherent non-native bias should not be underestimated.
A secondary problem arises if the empirical part of the investigation is shaped by the perceptual impressions of the researcher, i.e. it becomes a challenge to reproduce the analyses. Recently, awareness has been raised on the reproducibility of research, in particular within the field of phonetics (Roettger, Winter & Baayen Reference Roettger, Winter and Baayen2019). It is considered best practice to aim for transparent and unbiased approaches. Even the use of software that visualises intonation according to common methods (e.g. Praat; Boersma & Weenink 2019) has the risk of being used secondarily, i.e. only to support existing impressions formed in the field (Elordieta & Hualde 2014).
1.5 Cluster-analysis-based approach
In short, the issues outlined above leave room for improvement on representativeness (Sections 1.1–1.3) and/or reliability (Sections 1.3 and 1.4) of the intonation analysis. It is therefore crucial to tackle these issues in the initial stages of prosody research. Essentially, the proposed method gives the researcher a categorisation of intonation contours based solely on f0 measurements in a given dataset. It thus promotes the form of the intonation contour to be the primary basis for analysis and categorisation, and attribute specific functions to these contours only in a secondary stage. This approach has the crucial merit of reducing the weight given to subjective impressions in the initial stage of investigation and leaves more room to find unknown functions of intonation. Crucially, the analysis is compatible with spontaneous speech (as further demonstrated in Section 3) as much as with semi-spontaneous or fully scripted speech. In addition, the approach is reproducible, can be applied to data collected from a large number of speakers, and requires only limited annotation prior to analysis. The clustering approach is applicable to phrase intonation as well as tone, as further demonstrated in Section 4. With respect to tone, the approach provides a novel method compared to existing tools designed for early stages of language description. For example, Toney (Bird Reference Bird2014) provides a way for researchers to group similar sounding tone contours. Crucially, the grouping task ‘depends on the user’s perception of tone melodies, optionally with guidance of a native speaker’ (Bird Reference Bird2014: 6), therefore introducing a potentially high degree of subjectivity or additional dependency on input from native speakers. DAPPr (Grabowski & McPherson 2019) offers an automatic generation of vowel annotations including their f0 information. The annotations require prior training on a dataset, based on deep neural network learning. For exploratory stages of research (e.g. Stage I in Hyman Reference Hyman2014), therefore, tone contour clustering offers new possibilities with minimal requirements to the data (as discussed in Section 1.6). In sum, the proposed approach is meant to refine existing methods and ultimately lower the threshold for researchers to incorporate prosody and intonation into the documentation and description of languages.
1.6 Contour clustering
The core analysis performed in the proposed method is hierarchical clustering (e.g. Kaufman & Rousseeuw Reference Kaufman and Rousseeuw1990). Cluster analysis groups the individual observations in a dataset into clusters of numerically similar data. This technique is particularly useful if there is no prior knowledge of any grouping in a given dataset. The computation of the clusters only handles the numerical part and does not constitute an interpretable outcome without reconsidering the original dataset (Kaufman & Rousseeuw Reference Kaufman and Rousseeuw1990). Deciding on the number of clusters and interpreting their outcome is therefore considered an essential part of the analysis. Thus, after clustering, each observation (here: contour) in the dataset is assigned to a cluster, allowing the researcher to interpret a crude structure of which observations can be grouped due to their numerical similarity. To further interpret the clustering outcome, the current approach adds a means of ‘zooming’ into specific clusters. This is done by selectively removing initially found clusters, i.e. subsetting the data. Subsetting has the advantage of revealing contour differences that were initially masked by larger scale differences. For example, an initial analysis with five clusters could reveal four falling and one rising phrase-final contour. Depending on the interest of the researcher, a second round of cluster analysis could be performed on only the cluster that showed the rising contour. A second outcome could reveal that there are (smaller scale) differences among the rising contours, such as alignment or peak height differences, which might be relevant in the language under investigation. The subsetting procedures provide an additional means to detect remaining f0 measurement errors as well, and their application is explained in detail in the manual’s Section 2.2.6.
Cluster analysis is known for a variety of applications, ranging from biology to market research. In the field of phonetics, clustering techniques have been applied in speaker recognition methods (e.g. Tran & Wagner 2002). A small number of studies applied cluster analysis to intonation contours. For example, studies have investigated the grouping of intonation contours from read speech for pitch stylisation purposes (e.g. speech synthesis; Klabbers & Van Santen 2004, Demenko & Wagner Reference Demenko and Wagner2006). Other work applied cluster analyses of intonation contours to test the validity of the assumed intonation categories (Levow Reference Levow2006, Hirschberg & Roosenberg 2007, Calhoun & Schweitzer 2012). The outcomes showed that both tone and intonation categories could be reasonably accurately clustered, with more accuracy obtained by using additional evaluation measures (Hirschberg & Roosenberg 2007), and providing evidence in favour of lexicalised meanings of intonation contours (Calhoun & Schweitzer 2012). More indirectly, cluster analyses have been applied to perception ratings of contour similarity for Dutch (Collier & ’t Hart 1972, Collier Reference Collier1975), English (Collier Reference Collier1977) and Russian (Odé Reference Odé1989), showing listeners’ ability to successfully group the hypothesised prototypical contours.
The above-mentioned studies relied on annotation schemes such as the IPO-method (’t Hart, Collier & Cohen 1990) or autosegmental-metrical labelling guidelines (Ostendorf, Price & Shattuck-Hufnagel Reference Ostendorf, Price and Shattuck-Hufnagel1995). That is, the cluster analyses were largely unsupervised, although their evaluation was still based on pre-assumed categories of pitch accent contours. As discussed above, such an approach might not provide the most representative intonation descriptions of a language. A fully automated approach with the aim of modelling and resynthesising f0 contours was proposed in the CoPaSul intonation model (Reichel Reference Reichel, Kröger and Peter2011). This model was trained on a corpus of read radio news bulletins from one speaker. Cluster analysis was used to extract classes of local and global contours, as a step between the stylisation of the produced contours and the resynthesis. Global contours were represented by a single baseline slope value (representing f0 declination) and local contours were approximated by fitting a third-order polynomial. Resynthesised contours were then generated on the basis of both the global and local contours and were rated above average on their naturalness by human listeners. Results showed the potential of the fully automated procedure, including an evaluation of the semantic weight, information status and utterance finality as encoded by the individual classes (Reichel Reference Reichel2012).
Although the importance of spontaneous speech has been acknowledged (Reichel Reference Reichel, Kröger and Peter2011), all studies discussed in this section made use of scripted speech. In addition, f0 contours were often represented by selected features of an f0 contour, e.g. median, minimum and maximum (Demenko & Wagner Reference Demenko and Wagner2006) or slope approximations (Levow Reference Levow2006, Reichel Reference Reichel, Kröger and Peter2011). Such measures handle part of the stylisation by abstracting over local f0 perturbations (e.g. due to consonants). A more direct approach, as proposed in this paper, would favour a cluster analysis of time-series data (Aghabozorgi, Seyed Shirkhorshidi & Ying Wah 2015), where each contour is represented by a series of f0 measures. Such an approach has the potential to capture fine-grained differences between contours as they were produced, with limited need for stylisation (stylisation options discussed in detail in Sections 2.1.3 and 2.1.6 of the accompanying manual).
In the proposed approach outlined here, the clusters of contours are computed on the basis of a distance matrix. In this matrix, the Euclidean distance between the vectors of f0 measurements (L2 norm) is taken as a distance measure. Euclidean distance is commonly used to compute distances between spectral measures of speech (e.g. Harrington Reference Harrington2010). The actual clustering technique used in this approach is agglomerative hierarchical clustering with complete linkage clustering as linkage criterion. In short, this technique starts with a separate cluster for each observation and continues to merge clusters until no more clusters can be merged (James et al. Reference James, Witten, Hastie and Tibshirani2013). Each merge is applied to the pair that has the least maximum distance (complete linkage) as indicated by the distance matrix. Hierarchical clustering is chosen in this approach as it does not require the researcher to provide a number of clusters to analyse the outcome of the analysis (e.g. the dendrogram), as is the case for other popular clustering techniques such as k-means clustering (James et al. Reference James, Witten, Hastie and Tibshirani2013), which has been applied to intonation in previous work (e.g. Reichel Reference Reichel, Kröger and Peter2011). The dendrogram essentially provides a tree structure showing how many branches (clusters) can be found at a given height in the tree. The choice for complete linkage clustering for the purpose of this paper is theoretically and practically motivated. Theoretically, the principle of maximal inter-cluster dissimilarity (complete linkage) applied to f0 contours means that the highest node in the dendrogram (branching two clusters) represents grouping on the basis of the largest numerical differences between the contours’ f0 values. Maximal acoustic contrasts are more likely to pattern with actual distinctions in intonational meaning. Maximal acoustic contrasts are also claimed to be an underlying principle in, for example, inventories of vowels (e.g. Lindblom Reference Lindblom, Ohala and Jeri1986), which are the most important segmental carriers of f0 contours. Practically, the datasets analysed in this paper gave the most accurate results using the complete linkage criterion (as tested and compared to single linkage, (un )weighted average linkage (UPGMA/WPGMA) or centroid linkage (UPGMC).
To sum up, the literature has shown that cluster analysis has an added value for intonation research and that there are more applications still to be explored. In this paper, cluster analysis is proposed as an exploratory means in the initial stages of prosody research. Step-by-step guidelines to perform the analysis using Praat (Boersma & Weenink 2019) and R (R Core Team 2019, R Studio Team 2019) are outlined in the accompaying manual (supplementary material). The next three sections provide a conceptual proof of the cluster analysis applied to Papuan Malay noun phrase contours (Section 2), a field-data example on spontaneously produced Papuan Malay phrase contours (Section 3), and a tone contour example based on elicited isolated words in Zaghawa (Section 4).
2 Conceptual proof on noun phrase contours
This section shows how the cluster analysis can reveal different prototypical contours from speech data collected in a controlled production experiment. It is important to note that this situation does not reflect the one a researcher faces in the initial phases of analysing f0 contours from spontaneous field data. In these phases, little to nothing might be known about which types of contours could be distinguished. The example in this section is meant as a proof of concept, therefore using a dataset for which the prototypical contours are known a priori. In this way, the actual differences, as given by mean contours computed directly from the data in each experimental condition, can be compared to and evaluated with the ones obtained from the cluster analysis.
As for Papuan Malay (ISO: pmy; spoken in the provinces Papua and West Papua, Indonesia), prosody has received some attention in recent research, although the available work still largely reflects an early stage of research. Where perceived prosodic prominence was initially reported to be of little relevance in Papuan Malay (Riesberg et al. Reference Riesberg, Kalbertodt, Baumann and Himmelmann2018), later studies showed acoustic and perceptual support for regular penultimate word stress (Kluge Reference Kluge2017; Kaland Reference Kaland2019, Reference Kaland2020; Kaland, Himmelmann & Kluge Reference Kaland, Himmelmann, Kluge, Sasha, Paola and Marija2019; Kaland & Van Heuven Reference Kaland and Van Heuven2020). The most salient prosodic events occur phrase-finally (Riesberg et al. Reference Riesberg, Kalbertodt, Baumann and Himmelmann2018, Kaland & Baumann 2020), with some interaction between phrase f0 and word stress. In particular, f0 rises show a weak tendency to align with stressed syllables in phrase final position. Little is known about the exact functions of the phrase final f0 movements. In a corpus of pear-story retellings, demonstratives occurred often in phrase final position (Kaland & Baumann 2020). Demonstratives were reported as lexical focus markers in Kluge (Reference Kluge2017). It remains to be investigated whether phrase-final demonstratives are produced with higher degrees of prosodic prominence. It has been explored to what extent salient phrase final f0 movements are related to contrastive focus marking, using a controlled elicitation task in Kaland & Himmelmann (Reference Kaland, Himmelmann, Nobuaki, Mariko, Takayuki and Ryoko2020). It was shown that contrastive focus marking does not lead to distinct f0 contours in Papuan Malay, although boundaries were shown to be marked by f0. The data from the controlled elicitation task is used in this section to show that cluster analysis on f0 contours is able to reveal known differences between contours.
2.1 Dataset
A production task was carried out in order to elicit phrases with semantic contrasts and to investigate whether these contrasts are prosodically marked in Papuan Malay. This was done by presenting a sequence of minimally different picture pairs to participants, who described them using specific matrix sentences, as shown below (ANT = antecedent phrase; TAR = target phrase).
-
(1) a. Di sebla kiri saya liat [ANT], dang di sebla kanang saya liat [TAR].
‘On the left side I see [ANT], but on the right side I see [TAR].’
-
b. Saya liat [ANT] di sebla kiri, dang saya liat [TAR] di sebla kanang.
‘I see [ANT] on the left side, but I see [TAR] on the right side.’
The position of the noun phrase referring to the picture was either phrase-final, as seen in (1a), or phrase-medial, as in (1b), elicited in either the first or second half of the task. The contrast between the figure described in ANT and the figure described in TAR concerned shape, colour or both (fillers). In total 25 pictures pairs were presented twice; once in the first part of the experiment and once in the second part. A total of 24 participants carried out the task; 13 males and 11 females (mean age: 23.6 years, age range: 18–33 years). They were all native speakers of Papuan Malay without speech problems or colour blindness. For the purposes of this paper, further analysis was carried out on the collected colour terms. The terms occurred twice in each description, totalling 2400 collected words after all participants carried out the task. Each of these words was annotated in Praat (Boersma & Weenink 2019) on an interval tier using textgrids.
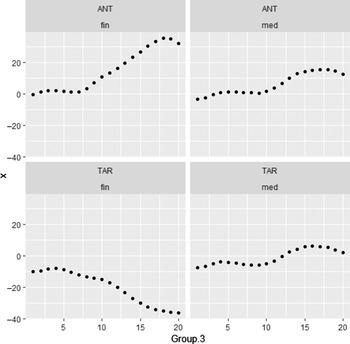
Production errors and measurement errors were removed from the f0 values, after which they were speaker standardised. The mean f0 contours for all data are plotted in Figure 1 for the colour terms in antecedent and target phrase and in phrase medial and phrase final position. The contrast conditions are not taken into account in this paper (see Kaland & Himmelmann Reference Kaland, Himmelmann, Nobuaki, Mariko, Takayuki and Ryoko2020 for analysis on these conditions). The mean contours show clear differences between phrase-medial and phrase-final contours; in that small rises occur in the former, whereas in the latter larger f0 movements are found. Specifically, phrase-final colour words in antecedent phrases end with a large rise and phrase-final colour words in target phrases end with a fall.
Mean speaker standardised f0 contour and standard deviations of colour words in antecedent phrase (top) and target phrase (bottom) in phrase-medial (left) and phrase-final (right) position.

2.2 F0 measurement settings
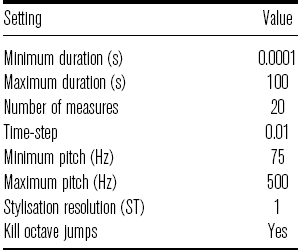
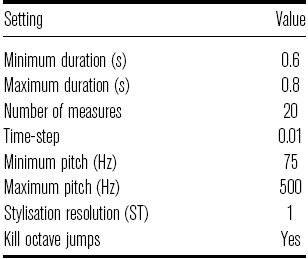
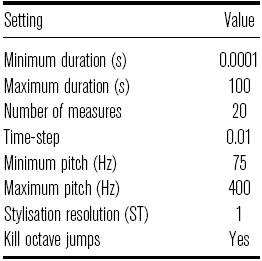
F0 measures were taken for each colour word, using the settings summarised in Table 1. Durations were set to extremely low and high values to obtain f0 measures for all word lengths. The stylisation resolution was set to 1 ST, since the unit of analysis was the word. In this way, more fine-grained f0 variations could be captured compared to the default setting of 2 ST.
F0 measurement settings for the Papuan Malay elicited data example.

2.3 Cluster-analysis settings
Although the f0 measurements were taken from a controlled dataset with recordings having a relatively high sound quality, measurement errors were removed prior to cluster analysis. These were detected using the subsetting suggestions provided in the graphical user interface of the contour clustering script (Manual’s Section 2.2.6). This was done by setting the cluster analysis to a high number of clusters (25) and subsequently removing the contours that fell within the described criteria for outliers. It has to be noted that the higher the number of clusters set, the more precision is obtained to detect outliers. Octave jump correction was applied as well as speaker normalisation (standardisation). A total of 233 contours were removed from the data, leaving 1941 contours for cluster analysis (89.3% of the data). Three rounds of analysis were performed with three to five clusters assumed respectively, the details of which are discussed in the next section.
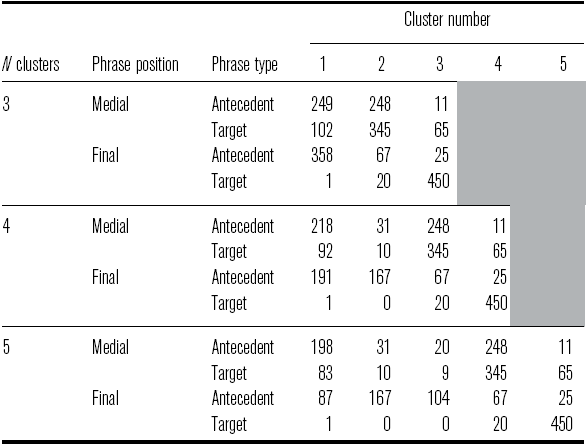
Contour counts per cluster number, split by analysis round (number of clusters), phrase position and phrase type. Shaded cells indicate clusters that were not analysed.

2.4 Outputs
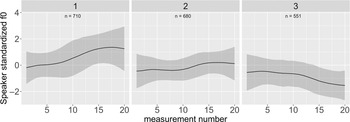
Mean contour per cluster with three clusters assumed.

Mean contour per cluster with four clusters assumed.

Mean contour per cluster with five clusters assumed.

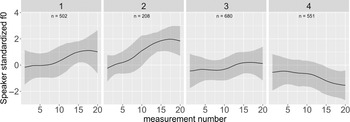
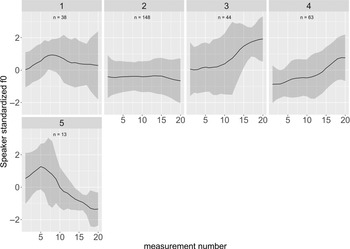
The three rounds of cluster analysis show how the contours are divided over the original experimental conditions (Table 2) and how the mean contours look in each cluster (Figures 2a–c). From the mean contours in each condition (Figure 1), it can be observed that there is large similarity between the contours in each of the phrase medial positions. The medial contour in antecedent phrases is overall slightly higher than the medial contour in target phrases, while their shapes are almost identical. Therefore, considering the overall shape only, the original conditions essentially show three contours; a shallow rise (both medial positions), a steep rise (antecedent final) and a fall (target final). These three contours can also be identified from the analysis with three clusters (Figure 2a). The counts (Table 2) also confirm that the majority of contours in cluster 1 (steep rise) is found in antecedent final position, the large majority of contours in cluster 2 (shallow rise) is found in medial positions and the majority of contours in cluster 3 (fall) is found in target final positions. It has to be noted that a large portion of the contours in cluster 1 are also found in medial positions, in particular in antecedent phrases. This can be explained by recalling that antecedent medial phrases show an overall higher contour, therefore being numerically closer to the steep rise found in antecedent final phrases.
When considering the analysis with four clusters (Figure 2b), it becomes clear that the cluster analysis is able to distinguish an overall lower shallow rise (cluster 3) from an overall higher shallow rise (cluster 1). The division of the contours over the original experimental conditions in these clusters (Table 2) reveals that cluster 1 contours are mainly found in antecedent phrases, with minimal difference between phrase positions, whereas cluster 3 contours are mainly found in medial phrase positions, with the majority in target phrases. The contours in cluster 2 and 4 pattern more exclusively with antecedent final and target final positions respectively. They match again to the original conditions where these positions showed a steep rise and a fall respectively.
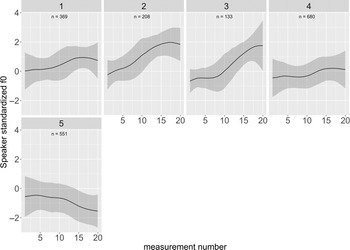
In the final round with five clusters two steep rises could be distinguished in cluster 2 and 3 (Figure 2c). Cluster 2 shows a more concave rise compared to cluster 3, however no major differences can be observed when taking into account how these contours are divided over the experimental conditions. There is a small majority of contours in cluster 2 found in antecedent phrases, however their distribution is not as skewed as in the other clusters. Cluster 1, 4 and 5 show the two shallow rises and the fall respectively, matching the original conditions in a similar way as discussed for the previous round with four clusters. Thus, the final analysis with five clusters shows that no additional major contour differences that pattern with the experimental conditions were identified when compared to the analysis with four clusters.
To conclude, the three subsequent analyses have shown how contour prototypicality can be successfully approached by cluster analysis. This confirms the literature indicating that cluster analysis is a useful technique to distinguish similar and dissimilar f0 contours (Section 1). The results also show that the mapping of contours onto experimental conditions is not exclusive. That is, most contours are found in multiple conditions. This is to be expected for two reasons. First, the data discussed here consists of multiple similarly shaped rises, which makes it more challenging to distinguish them. It can be observed from the heavily skewed counts (Table 2) that the mapping of the fall onto the target final position is much more successful. To overcome this issue, further clustering could be applied only to the rises found in the data, making the analysis more sensitive to differences between the rises. Second, exclusive form-to-function mapping in terms of phonological categories, if at all present in the language, could potentially be achieved by cluster analysis on data acquired in extremely controlled conditions. The question remains whether such a high level of control over the data would ultimately eliminate the need for cluster analysis, given that most variability is weeded out. Autosegmental-metrical approaches have shown that well established pitch accent categories can be shared among different focus conditions (e.g. Watson et al. Reference Watson, Tanenhaus and Gunlogson2008), challenging the categorical nature of phonological constructs. Cluster analysis cannot solve this problem. It is however capable of revealing different types of contours that in many cases show a clear patterning with specific phrase types or phrase positions (Table 2). Crucially, as demonstrated here, the specific conditions in which the contours were collected does not need to be known to reveal meaningful differences. This makes cluster analysis suitable for speech collected in more spontaneous settings, as further demonstrated in Section 3.
3 Spontaneous field-data example on Papuan Malay phrase contours
3.1 Dataset and f0 measures
This section describes a cluster analysis of Papuan Malay f0 contours using spontaneous speech, collected in a storytelling task. In this task speakers were instructed to watch a short video clip and recount what they had seen to an interlocutor who did not see the video. The video clip showed a small story about a man picking pears. The actors in the video clip did not use any speech. The video clip has been previously used in cross-linguistic studies on narrative production (Pear Film; Chafe Reference Chafe1980). Recordings were made at the Center for Endangered Languages Documentation (CELD) in Manokwari, West Papua (Riesberg & Himmelmann Reference Riesberg and Himmelmann2012–2014). The participants and interlocutor were seated next to each other during the retelling. The duration of the collected recordings ranged between two and five minutes. Native speakers of Papuan Malay transcribed the recordings and segmented them into phrases. The segmentation was carried out at the level of intonation units (Chafe Reference Chafe1994), corresponding to intonation phrases in phonological hierarchy (i.e. Nespor & Vogel 2007). The most common phrase length ranged between 600 ms and 800 ms and to obtain a more homogenous dataset, phrases were selected for further analysis when their duration fell within this range (Table 3 for all settings, N = 321). The participants were students at the University of Papua. There were 10 male and nine female participants (mean age = 22 years, age range = 20–28 years). All were native speakers of Papuan Malay. Before cluster anlaysis, speaker correction (standardisation) was applied.
F0 measurement settings for the Papuan Malay spontaneous data example.

3.2 Cluster analysis
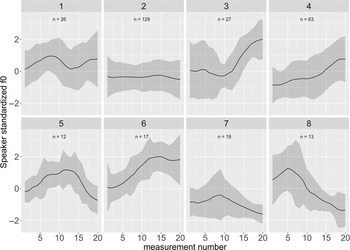
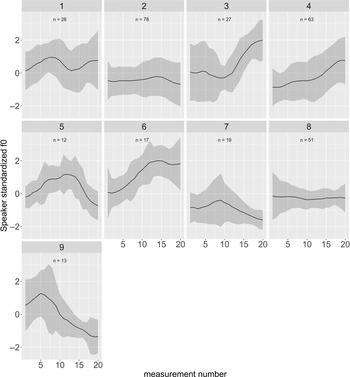
Cluster analysis was first used to remove outlying contours. This was done by setting the number of clusters to 25, a number that generated clusters with only minimal differences between the contours. In this way, erroneous or non-prototypical contours could be detected and removed whilst keeping 95.3% of the data (306 contours) for analysis. Thereafter, four rounds of analysis where performed, with two, five, eight and nine clusters respectively (Figures 3a–d).
Mean contour per cluster with two clusters assumed.

Mean contour per cluster with five clusters assumed.

Mean contour per cluster with eight clusters assumed.

Mean contour per cluster with nine clusters assumed.

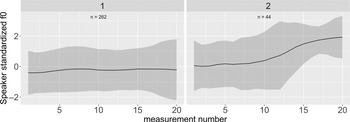
With two clusters assumed (Figure 3a), a highly asymmetrical outcome was generated with the overall majority (85.6% of the data) represented by a flat contour (cluster 1) and the remaining part of the data represented by a contour with a final rise (cluster 2). Asymmetry is particularly expected in the analysis of uncontrolled (spontaneous) data. Where the data in Section 2 could be mapped onto the original experimental conditions maintaining a rather equal distribution of contours over the clusters, this is likely not the case for spontaneously produced contours. This results in an additional challenge to interpret the clustering output. While some asymmetry is expected, large N differences between clusters could mean that some contour distinctions are masked in clusters with a particularly high N (Manual’s Section 2.2.4 discusses how asymmetry can be dealt with). Given the asymmetry in the initial round with two clusters (Figure 3a), the number of assumed clusters was increased to five, each time evaluating the distribution of contours over the clusters (symmetry) and the contour diversity. Thus, with five clusters (Figure 3b), the largest cluster (2) consisted of 48.4% of the data, indicating a more equal distribution of the contours over the clusters. The contours themselves showed a large degree of variety, with a rise–fall contour ending either mid (cluster 1) or falling (cluster 5), two types of final rises; either steep (cluster 3) or shallow (cluster 4), and again a mainly flat contour (cluster 2). With eight contours assumed (Figure 3c), the largest cluster (2) showing a flat contour consisted of 42.2% of the data, indicating a small decrease in asymmetry. More striking is the increase in diversity of contours; a rise–fall–rise (cluster 1), three final rises: a shallow rise (cluster 4) and two steep rises that differed in early and late alignment (cluster 3 and 6 respectively), a rising–falling movement over the entire phrase (cluster 5) and rise–falls (cluster 7 and 8) with different types of alignment (late vs. early respectively) and ranges (narrow range vs. wide range respectively). In a final round with nine clusters assumed (Figure 3d) a more dramatic decrease in asymmetry was obtained; cluster 2 with the mainly flat contour now consisted of 25.5% of the data, closely followed by cluster 4 (20.6% of the data). The distribution of the contours over the clusters reached a more symmetric state, with different types of flat (narrow range) contours distinguished. These are both indications that the cluster analysis reached a level of fine-grained detail, with the smallest cluster still consisting of 12 contours (cluster 5). These could be taken as a reason to not further increase the number of assumed clusters and do fine-grained inspection of the contours based on the analysis with nine clusters assumed. This is done in what follows. Note that the discussed clusters (3 and 6) were also revealed in the analysis with eight clusters assumed.
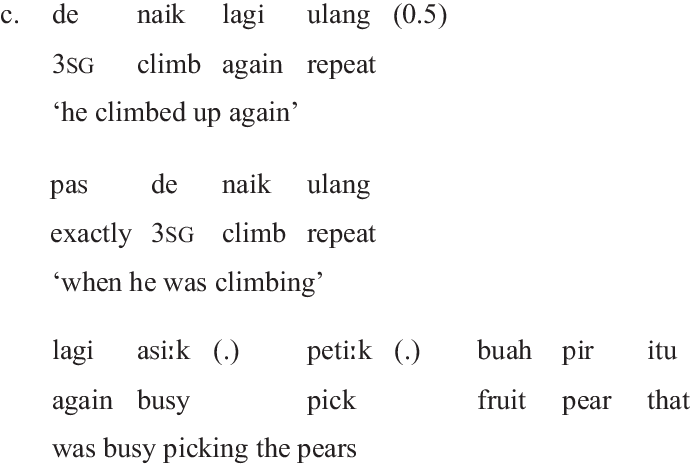
The main difference between the mean contours in cluster 3 and 6 appears to be the alignment of the final rise (Figure 3d). The rise is earlier aligned in cluster 6 than in cluster 3, resulting in a phrase-final plateau with a shallow fall in cluster 6 and a higher phrase final target in cluster 3. Cluster 3 and 6 seem to have more in common, both in terms of shape and in terms of cluster size, than with the shallow rise (cluster 4). This could hint at more systematic differences between the steep rises. Some examples of contours in cluster 3 and 6 are given in (2) and (3); the numbers in parentheses indicate the length of a pause in seconds, and a full-stop in parentheses marks, following the Leipzig Glossing Rules (Comrie, Haspelmath & Bickel Reference Comrie, Haspelmath and Bickel2015) and pause notations suggested in Himmelmann (Reference Himmelmann, Jost, Himmelmann and Ulrike2006).

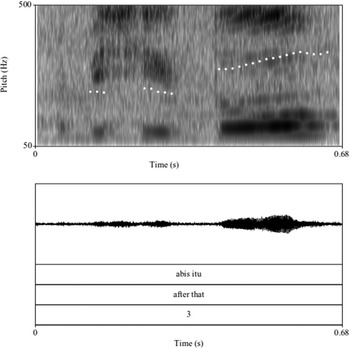
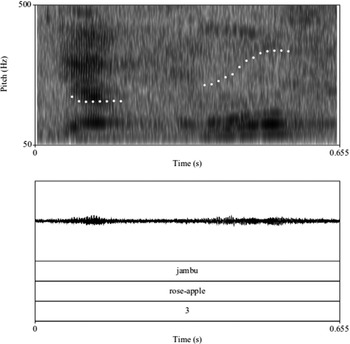
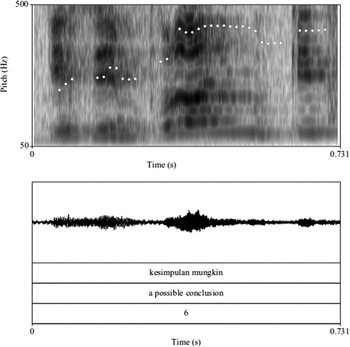
Example of a phrase with a contour assigned to cluster 3 (speaker 3), with the contour and spectrogram in the upper panel, and the waveform, Papuan Malay annotation, English annotation and cluster number in the lower panel.

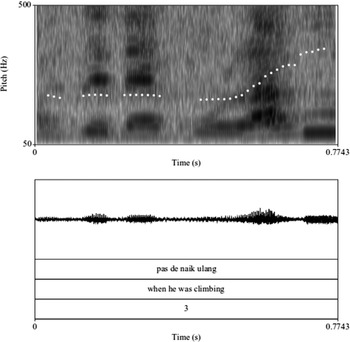
Example of a phrase with a contour assigned to cluster 3 (speaker 11), with the contour and spectrogram in the upper panel, and the waveform, Papuan Malay annotation, English annotation and cluster number in the lower panel.

Example of a phrase with a contour assigned to cluster 3 (speaker 5), with the contour and spectrogram in the upper panel, and the waveform, Papuan Malay annotation, English annotation and cluster number in the lower panel.

Inspection of the individual contours in cluster 3 revealed that one phrase (abis itu ‘after that’) occurred multiple times (see example (2a) and Figure 4a). This is a typical phrase in a spontaneous narrative to signal the upcoming of more content. Consideration of other contours from the same cluster revealed another instance where this speaker signalled continuation (see example (2b) and Figure 4b). This time, the function of the contour was identical to the one displayed in Figure 4a, although the segmental material was different and rather unexpected. That is, jambu ‘rose-apple’ is a noun that refers to a fruit, in this case illustrating the speaker’s attempt to describe a pear. Accordingly, this noun does not have a lexical meaning that signals discourse continuation intrinsically. Nevertheless, given the surrounding discourse material (see example (2b)), it becomes clear that the speaker uses jambu to signal continuation. That is, the repetition of jambu in isolation can be interpreted as a connecting element between the speaker’s explicit attempt to find the right word for ‘pear’ and the remaining part of the story. Thus, by considering only the shape of the contour, the cluster analysis is able to meaningfully group contours regardless of the segmental makeup. The two instances just discussed share their function with other continuation rises found in cluster 3 (example (2c) and Figure 4c). Furthermore, all contours in cluster 3 were produced either in isolation, or before or after a number of phrases that form a coherent unit (i.e. ‘paragraph’). That is, the phrases in (2a) and (2b) occurred in isolation between two longer stretches of discourse, whereas the phrase in (2c) occurred as an introductory phrase to a larger stretch of discourse (i.e. explaining what happened when the man was climbing). Thus, the type of contour that was revealed by cluster 3 can be tentatively considered as a continuation rise in a prominent discourse position, aligned with the last syllable in the phrase.


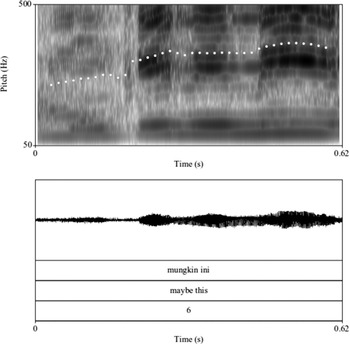
Example of a phrase with a contour assigned to cluster 6 (speaker 3), with the contour and spectrogram in the upper panel, and the waveform, Papuan Malay annotation, English annotation and cluster number in the lower panel.

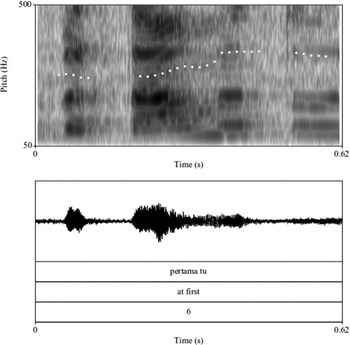
The inspection of cluster 6 revealed that 9 out of 17 contours occur in phrases that end with a demonstrative (ini ‘this’ or itu ‘that’). This appeared to be a larger portion with more variation in the type of demonstratives compared to cluster 3 (5 out of 27). One instance of each demonstrative is given in (3a) and (3b), and visualised in Figures 5a and 5b respectively. Example (3c) and Figure 5c show a third instance of the same contour on a phrase that does not contain demonstratives. In each context, the phrase was immediately followed by another phrase (or multiple phrases) in which the speaker clarified what the demonstrative referred to. The example in Figure 5c was immediately followed by a number of phrases constituting the actual conclusion the speaker drew. It is known from previous research that demonstratives in Papuan Malay are common and often hold a prosodically prominent phrase-final position (Kaland & Baumann 2020). The prosodic prominence, as can now be seen from the prototypical contour in cluster 6, is likely to be the result of the high plateau, making the entire word acoustically more prominent. This is a crucial difference from the final-syllable rise observed in cluster 3. Tentatively, the contour in cluster 6 appears to be another instance of a continuation rise, showing a higher degree of prosodic prominence and coherence between the phrase it occurs on and immediately following phrases (compare cluster 3). It is beyond the scope of this paper to continue with inspection of the other clusters. The example has shown some crucial exploratory steps in the analysis of spontaneous field data.
Example of a phrase with a contour assigned to cluster 6 (speaker 4), with the contour and spectrogram in the upper panel, and the waveform, Papuan Malay annotation, English annotation and cluster number in the lower panel.

Example of a phrase with a contour assigned to cluster 6 (speaker 4), with the contour and spectrogram in the upper panel, and the waveform, Papuan Malay annotation, English annotation and cluster number in the lower panel.

3.3 Conclusion
In sum, the different rounds of analysis have shown a way to come to a relatively evenly distributed number of contours per cluster whilst maintaining a level of detail that could reveal linguistically relevant contour differences. The final analysis round therefore appears ready for further interpretation and analysis. This could involve subsetting (Manual’s Section 2.2.6). Note that the clusters with the steep rises discussed above were not subset. This could have been done in order to set the larger scale differences aside. By default, a conservative approach (demonstrated above) is recommended in which initially only erroneous cases are removed from the data. These could involve measurement errors or incomplete utterances. Further subsetting is only considered as a means of breaking down large sized clusters in order to explore whether further clustering leads to more insightful results. This is particularly fruitful for narrow range contours in large sized clusters, due to the masking effect that large scale f0 differences could have on the clustering. In the example illustrated here, such a consideration could be given to the largest clusters (1, 4, and 8), i.e. by removing the other clusters.
4 Elicited field-data example on Zhagawa tone contours
This section reports an exploratory analysis on Zhagawa, locally known as Beria (iso: zag, Hammarström, Forkel & Haspelmath Reference Hammarström, Forkel and Haspelmath2019), a tone language spoken in Darfur (Sudan). The purpose of this analysis is to demonstrate how contour clustering can be applied to explore tone contrasts in an underdocumented language. The available work on tone in Zhagawa is minimal. The tonal inventory has not been fully established and no acoustic analyses of tone realisations have been carried out.
For the purposes of this paper, the demonstration focuses on Zhagawa tone as number marker, one of the primary and to date best documented functions of tone in this language. Other reported functions of tone are marking tense and aspect, and distinguishing lexical items (Osman Reference Osman, Gilley and Anne2006). The available fieldwork reports singular/plural word pairs for which tone is the sole difference. In the first report of Zhagawa tone in the literature plural noun forms are marked with a low tone that combines with the final tone of the singular form (Tourneux Reference Tourneux1992). However, in later work (Wolfe Reference Wolfe2001, Osman Reference Osman, Gilley and Anne2006) singular forms are marked with a low/falling tone, whereas plural forms are marked with a high/rising tone. For example, tone in monosyllabic words is marked as in /ʊˆr/ and /ʊ̌r/ (‘belly’, sg and pl respectively) and tone is marked word finally in disyllabic words, as in /ʊ̄.rʊ̀/ and /ʊ̄.rʊ́/ (‘throat’, sg and pl respectively). The different analyses on number marking might be at least partially explained by different assumptions on the basic inventory of tones. Tourneux (Reference Tourneux1992) distinguishes three register tones (low, mid and high) that precede modulated tones in six combinations: LH, LM, MH, ML, HM, HL. Wolfe (Reference Wolfe2001) provides a phonological analysis of mainly verbal tones, distinguishing combinations of high and low tones only. Osman (Reference Osman, Gilley and Anne2006) distinguishes five contours: high, low, mid, rising, and falling. It is beyond the scope of this demonstration to resolve the differences between existing analyses, nor to come up with a revised analysis. However, it can be considered undisputed that tone is a feature of Zhagawa that marks, among other aspects, number. The current state of the literature on Zhagawa tone could therefore benefit from further explorations concerning tone number marking. Contour clustering provides a way to inventorise contour distinctions as found between singular and plural word forms. Given some of the differences between existing analyses, this approach could provide new insights and is crucially based on the first acoustic measurements of Zhagawa tone, rather than on perceptual impressions.
4.1 Data analysis
The data used for contour cluster analysis was collected as part of a course on field methods, taught at the University of Cologne. One male native speaker (age 30 years) of the Zhagawa-Wagi variety read aloud words from elicitation lists. Students participating in the course phonetically transcribed and annotated the recordings at the word level. Annotations included an indication of number (for nouns and adjectives) and were checked by a language expert. The recordings and annotations were archived in the Language Archive Cologne (LAC) in 2018 (https://doi.org/10.17616/R3JV4W, files: ZAG_EOI_20141009_1.wav, ZAG_EOI_20141016_1.wav, ZAG_EOI_20141016_2.wav, ZAG_EOI_20141016_3.wav, ZAG_EOI_20141016_4.wav). For the purposes of this demonstration, 54 word pairs were selected for analysis each consisting of at least one singular and one plural form (. Some words (N = 26) occurred multiple times (up to 12 times), resulting in a total number of 212 words in the analysed data. The words are nouns and adjectives referring to common concepts (i.e. body parts, kinship terms, animals and colours). Words that occurred only in singular form or only in plural form were not taken into account for analysis.
F0 measurements were taken from the voiced portion of the final syllable in the word, where tone has been reported to be a nominal plural marker (Tourneux Reference Tourneux1992, Osman Reference Osman, Gilley and Anne2006). The voiced portion was determined automatically using a Praat script. That is, intervals within the syllable for which Praat could measure f0 were taken as unit of analysis. If voicing started or ended with the left or right syllable boundary respectively, that syllable boundary was taken as boundary for the voiced portion. If multiple voiced portions were found within one syllable, the longest portion was taken for analysis. In this way, the tone contour could be measured accurately for its entire duration, disregarding voiceless parts (due to consonantal material). The voiced portions were measured using the time-series Praat script provided for contour clustering, taking 20 measures per contour and correcting for octave jumps (settings in Table 4). Note that a pilot run with 10 measures per contour was also performed. This pilot however failed to capture more fine-grained contour distinctions, that could be relevant for further analysis (see discussion in Section 4.2 below).
F0 measurement settings for the Zhagawa tone example.

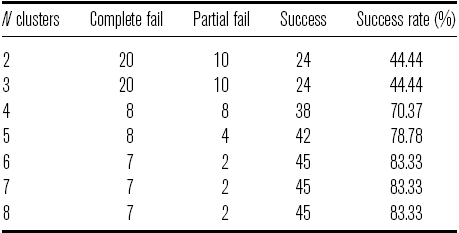
The cluster analysis was applied in several rounds, starting with a minimum of two clusters up to eight clusters with one cluster added in each round. Analysis rounds with more than eight clusters could have been performed to provide greater detail in the results. However, for the purpose of this demonstration the maximum number is kept limited. The discussion of the exploratory analysis (Section 4.2) shows that the level of detail up to 8 clusters already provides some fundamental insights into Zhagawa tone. No corrected octave jumps were removed from the data as corrections did not result in mean f0 changes of more than 10% per contour (see Manual’s Section 2.2.2). No speaker correction was applied to the f0 measures as the data concerned a single speaker. After every round, the number of successfully distinguished singular/plural forms was counted (success), as well the forms that were not successfully distinguished. A separate count was made for cases where all singular and plural forms ended up in the same cluster (complete fail) and cases where some forms were successfully distinguished and others were not (partial fail). The latter option applied only to the forms that occurred multiple times in the recordings.
4.2 Results
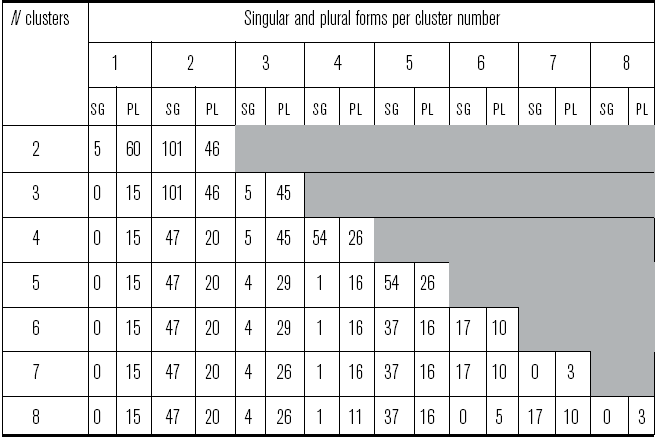
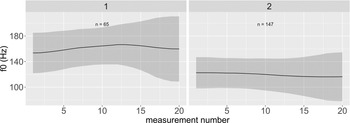
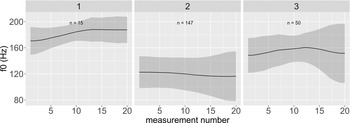
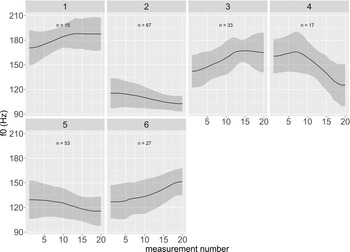
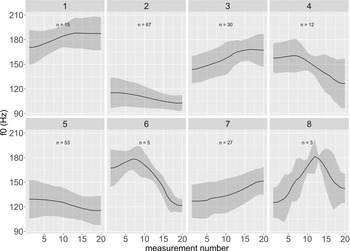
Results of the counts are given in Table 5. Table 6 shows the division of singular and plural forms for each cluster in each round of analysis. Figures 6a–d provide mean contour plots for each cluster after analysis with 2, 3, 6 and 8 clusters respectively.
The results show that with increasing number of clusters, more singular and plural forms could be distinguished on the basis of f0 contours (Table 5), with the success rate yielding 83% in the final cluster rounds (six, seven or eight clusters assumed). The division of singular and plural forms over the different clusters in each round (Table 6) indicates different degrees of skewing. Note that contour shapes and cluster numbers do not always match between different rounds of analysis (see Figures 6a–d). For example, in the final round (Figure 6d; eight clusters), clusters 1, 3, 4 and 8 mainly consist of plural form contours. Clusters 2, 5, 6 and 7 mainly consist of singular form contours, however with a smaller degree of skewing.
4.3 Conclusions
It is unsurprising that with higher numbers of assumed clusters, therefore allowing for smaller differences between contours, singular and plural forms can be distinguished with more success (Table 5). With only two clusters assumed, it becomes clear that the overall majority of singular forms are clustered with a low, slightly falling, contour. The plural forms are more equally spread over the two clusters, with a small majority assigned to the cluster with a high, rising contour. These results confirm to some extent the analysis of a high/rising tone as plural marker in Osman (Reference Osman, Gilley and Anne2006). When assuming three clusters, the mean contours in each cluster seem to suggest different registers, i.e. high/rising (>175 Hz), low/falling (<125 Hz) and shallow mid rise-fall (∼150–160 Hz) respectively. The little overlap between the standard deviations and the distinction between the f0 ranges could be interpreted as another indication that Zhagawa tone indeed applies to three registers, corroborating Tourneux (Reference Tourneux1992).
Counts of complete fails, partial fails, successes and success rates to distinguish singular and plural forms for each round of analysis (between two and eight clusters).

Division of singular and plural forms per cluster number for each round of analysis (between two and eight clusters). Shaded cells indicate clusters that were not analysed.

Mean contour per cluster with two clusters assumed.

Mean contour per cluster with three clusters assumed.

Mean contour per cluster with six clusters assumed.

Further support for the analysis in Tourneux (Reference Tourneux1992) can be found when considering the contours for the round in which six clusters were assumed (Figure 6c). The six contours group into three rises and three falls, spanning different registers. The steepest rise (cluster 3) and steepest fall (cluster 4) could match LH and HL tones respectively, the highest rise (cluster 1) and lowest fall (cluster 2) could match MH and ML respectively, and the mid rise (cluster 6) and mid fall (cluster 5) could match LM and HM respectively. As for the latter two, the absolute levels do not provide a perfect match with the registers. In this case, a relative difference between the start and the end level of f0 could be sufficient to make the tonal contrast, although further confirmatory analysis would be needed. It has to be noted, however, that the analysis with six clusters shows that high rises (cluster 1 and 3) steep falls (cluster 4) are mainly found for plural forms, suggesting that only the direction of the contour (rising/falling) is not sufficient to distinguish number markers in Zhagawa (Osman Reference Osman, Gilley and Anne2006). It rather seems that contours can be roughly distinguished according to at least two registers, partially confirming Tourneux (Reference Tourneux1992); a high register associated with plurality (cluster 1, 3, 4) and a low register (cluster 2, 5 and 6) with singularity. A tentative cut-off point when assuming two registers can be drawn around 150 Hz for the speaker analysed here, with the majority of the contour falling within either register being a tentative criterion.
Mean contour per cluster with eight clusters assumed.

Fundamentally different contour shapes (other than rises or falls) only appeared in the final rounds of analysis (Figure 6d). For example, in the final round two rise–fall contours (cluster 6 and 8) were exclusively found in plurals. However, the contours were particularly infrequent (N = 5 and N = 3 respectively), and does not allow for any further interpretation without additional analysis. Zhagawa tone, therefore, seems to be much more complicated than the final round of cluster analysis could reveal (see also verbal tones in Wolfe Reference Wolfe2001). That is, cluster 2 and 5 in the final analysis remained relatively large and showed a large number of plural forms, despite their low registers. It is left for further analysis to explore more fine-grained tone contour differences. The cluster analysis would be able to capture them by further increasing the number of clusters (>8). However, further cluster analysis would be recommended with a more controlled selection of tones. For example, one could consider separate cluster analyses on contours found in different registers or exploring whether more contour shapes can be identified when selecting only the rising or falling contours. In addition, different realisations of the same tone could be clustered, based on different contexts, giving insight into interactions with morphology (e.g. Stage II in Hyman Reference Hyman2014). Besides additional cluster analyses, perceptual testing should be considered as a means of analysing the extent to which cluster differences are perceptible. It can now be concluded that the contour clustering approach is not restricted to phrase intonation. Meaningful differences between tone contours can be distinguished successfully and specific hypotheses for follow-up analysis can be formulated, partially confirming the little work available. Follow-up analyses could still be performed using cluster analysis, for example on the singular and plural words separately, in order to further reveal potential lexical tonal contrasts. It therefore appears that contour clustering is a useful exploratory tool when the phenomenon at hand has been ill studied, as remains to be the case for Zhagawa tone.
5 Conclusion
This paper has shown a cluster-analysis approach to identifying prototypical intonation or tone contours. To sum up, the approach outlined here is meant as a tool for descriptions of intonation based on representative speech data. The crucial advantages of this technique, demonstrated in Sections 2, 3 and 4, concern its applicability in initial stages of the research, where hypotheses can be formed entirely on reproducible data analyses. In addition, the approach is centred around the acoustic form of the intonation contour. This paper showed that potentially meaningful and functional differences between contours can be readily revealed by the cluster analysis, providing reproducible and unbiased directions for further testing.
The outcome of the cluster analysis as such does not allow any conclusions about phonological categorical distinctions. Following cluster analysis, hypothesised categories should be tested in follow-up perception experiments, in order to investigate whether acoustic differences are actually meaningful to native listeners. For example, after the inspection of the Papuan Malay contours with a final rise (as discussed in Section 3), a follow-up analysis could (experimentally) investigate whether early versus late alignment indeed signals different degrees of discourse coherence, as could be hypothesised on the basis of the clustering. Similarly for tone contrasts in Zhagawa (Section 4), further analyses could be done to investigate to what extent the register distinctions are indeed numbers markers, as suggested on the basis of the clustered contours. One possibility to test register differences would be through Functional Principle Component Analysis (FPCA) on the f0 contours, followed by mixed model analysis (e.g. Gubian, Torreira & Boves Reference Gubian, Torreira and Boves2015, applied in e.g. Lohfink, Katsika & Arvaniti Reference Lohfink, Katsika, Arvaniti, Sasha, Paola and Marija2019 and Hu et al. Reference Hu, Janssen, Hanssen, Gussenhoven, Chen, Helen, Bo and Thomas2020).
All materials needed to perform contour clustering as described in this paper are available online (https://constantijnkaland.github.io/contourclustering/). These materials include the Praat and R scripts as well as the datasets used for the scripted example (Section 2), the field-data example (Section 3) and the tone example (Section 4).
Acknowledgements
The research for this paper has been funded by the German Research Foundation (DFG, Project-ID 281511265 – SFB 1252). The author thanks the staff of the Center for Endangered Languages Documentation (CELD) in Manokwari for participant recruitment and facilitation of the Papuan Malay data collection, Jonas Heinen and Katherine Walker for data processing, Isabel Compes for support on Zhagawa tone, Maximilian Hörl for statistical advice, T. Mark Ellison, Naomi Peck and Heiko Seeliger for feedback on the scripts, Sarah Agius for text corrections, and three anonymous reviewers for valuable and constructive comments on earlier versions of this paper.
Supplementary material
To view supplementary material for this article (including audio files to accompany the language examples), please visit https://doi.org/10.1017/S0025100321000049